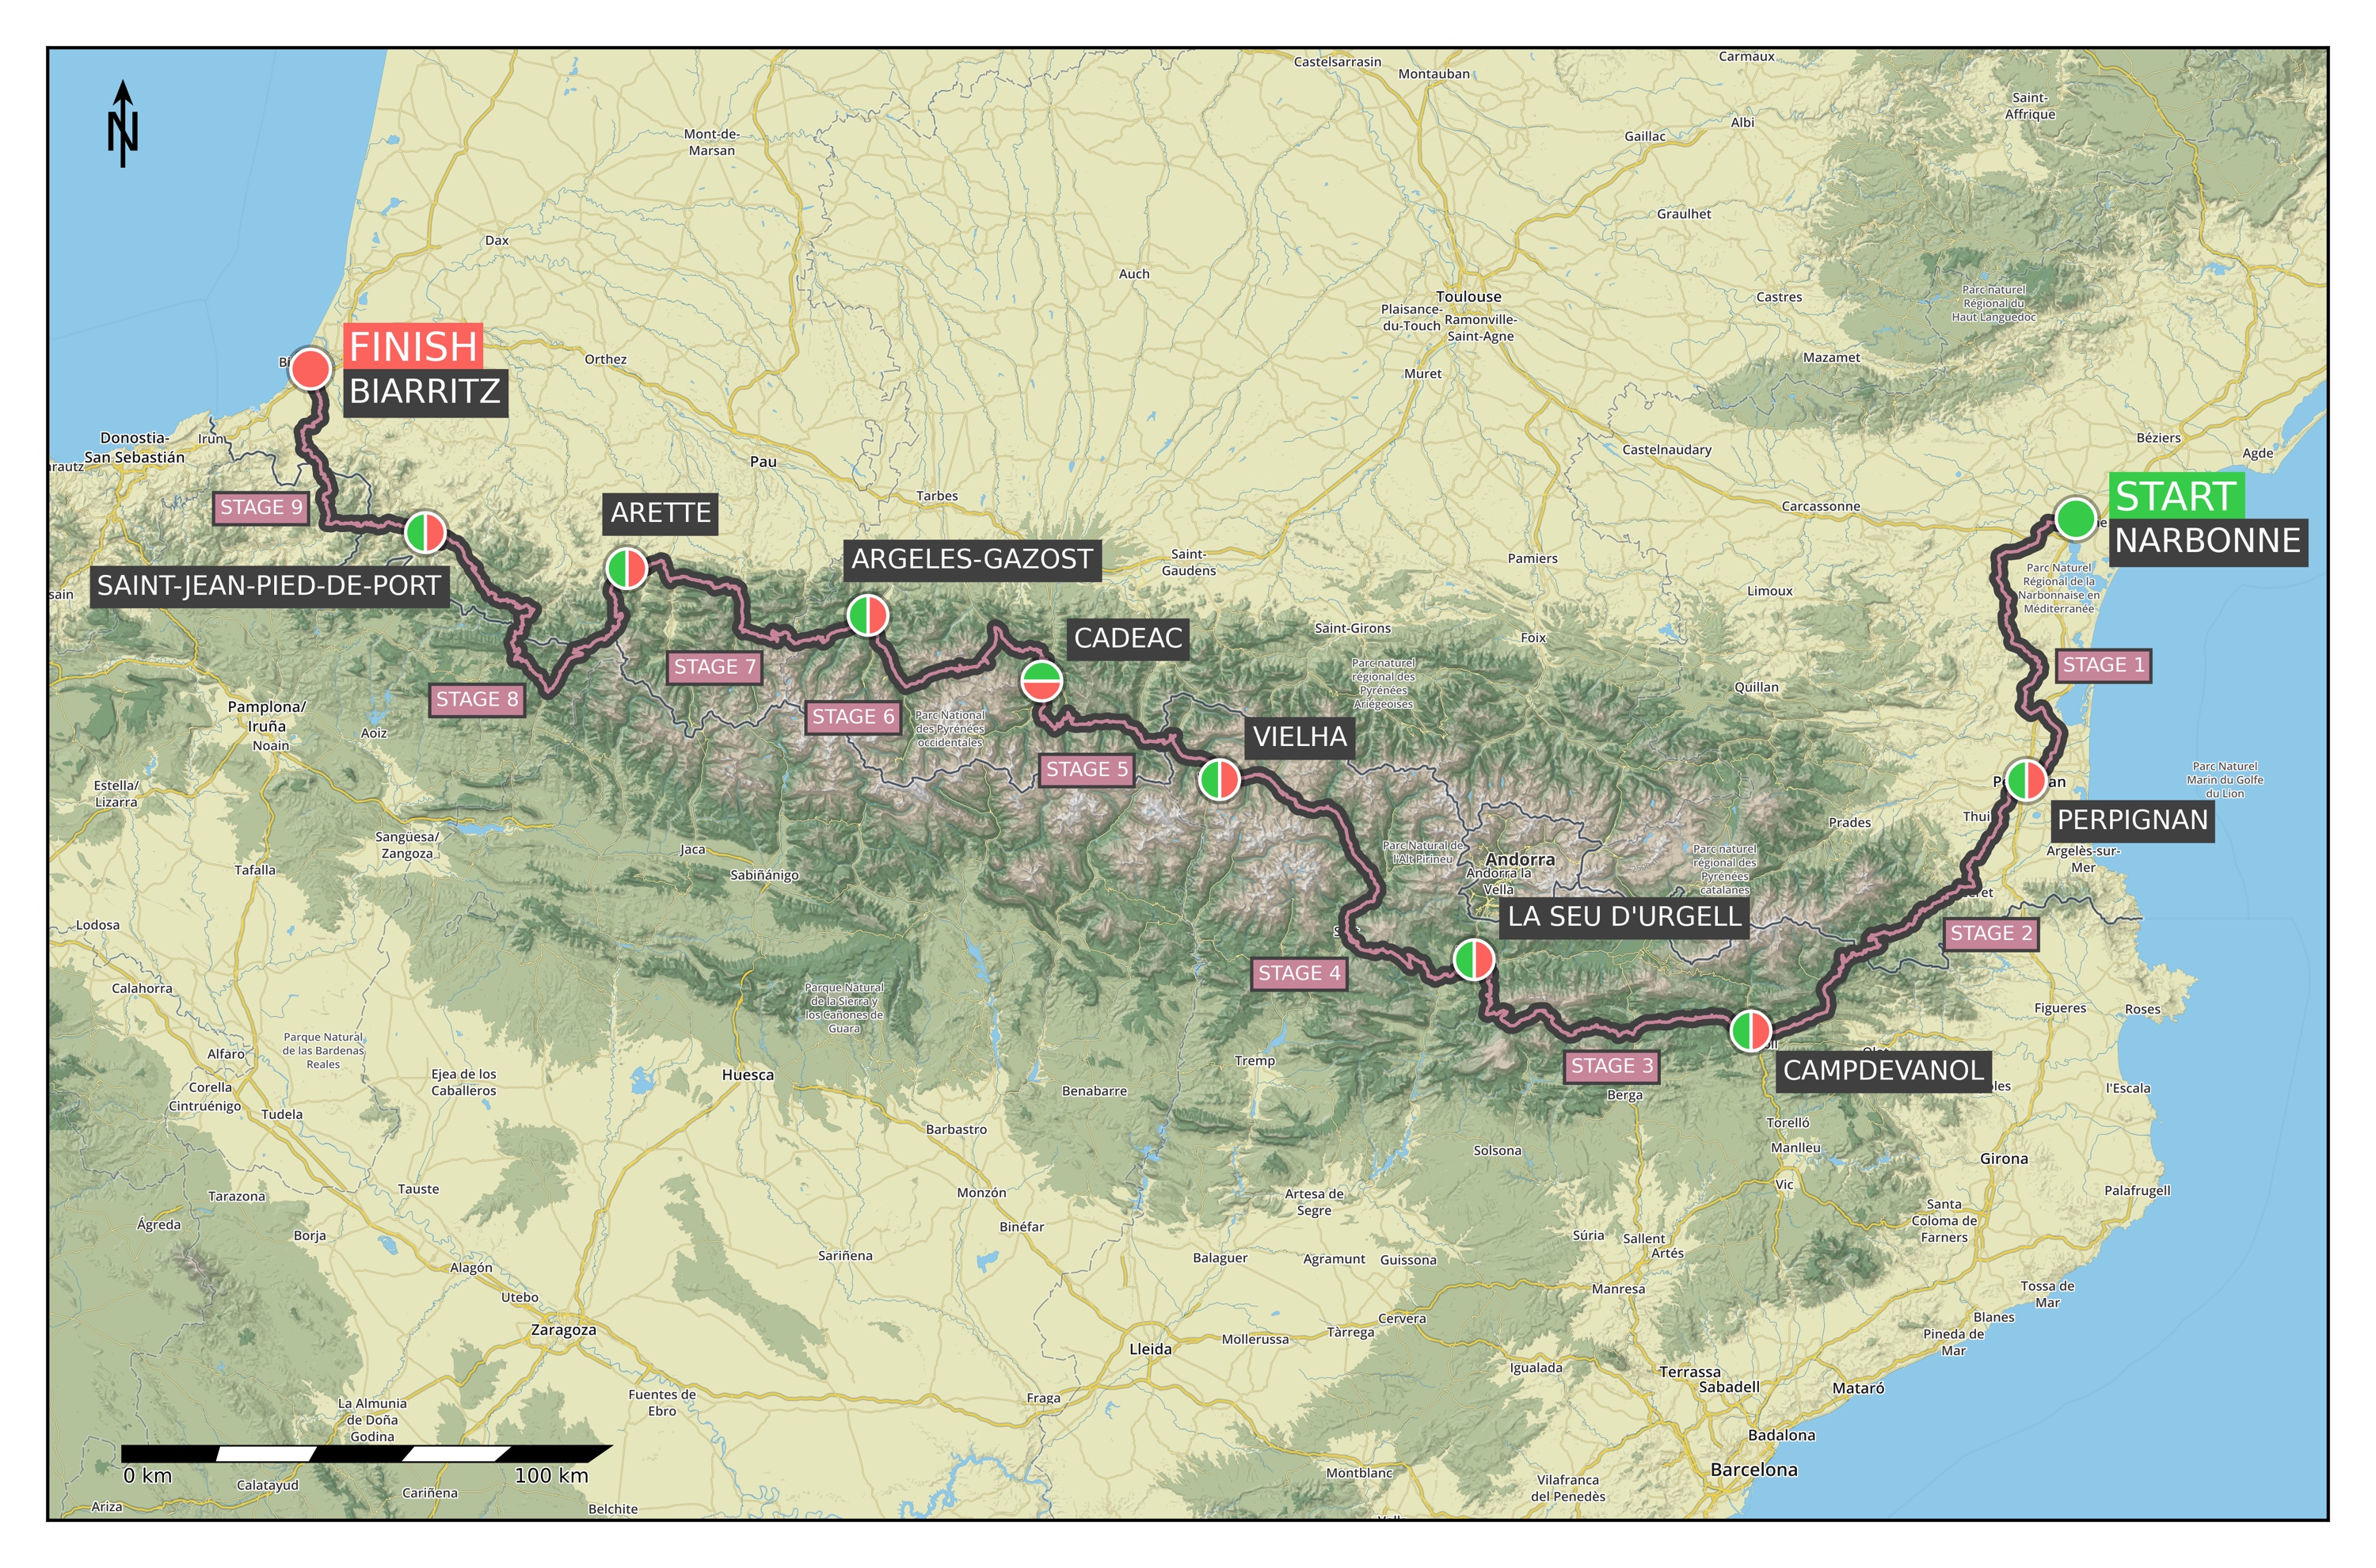
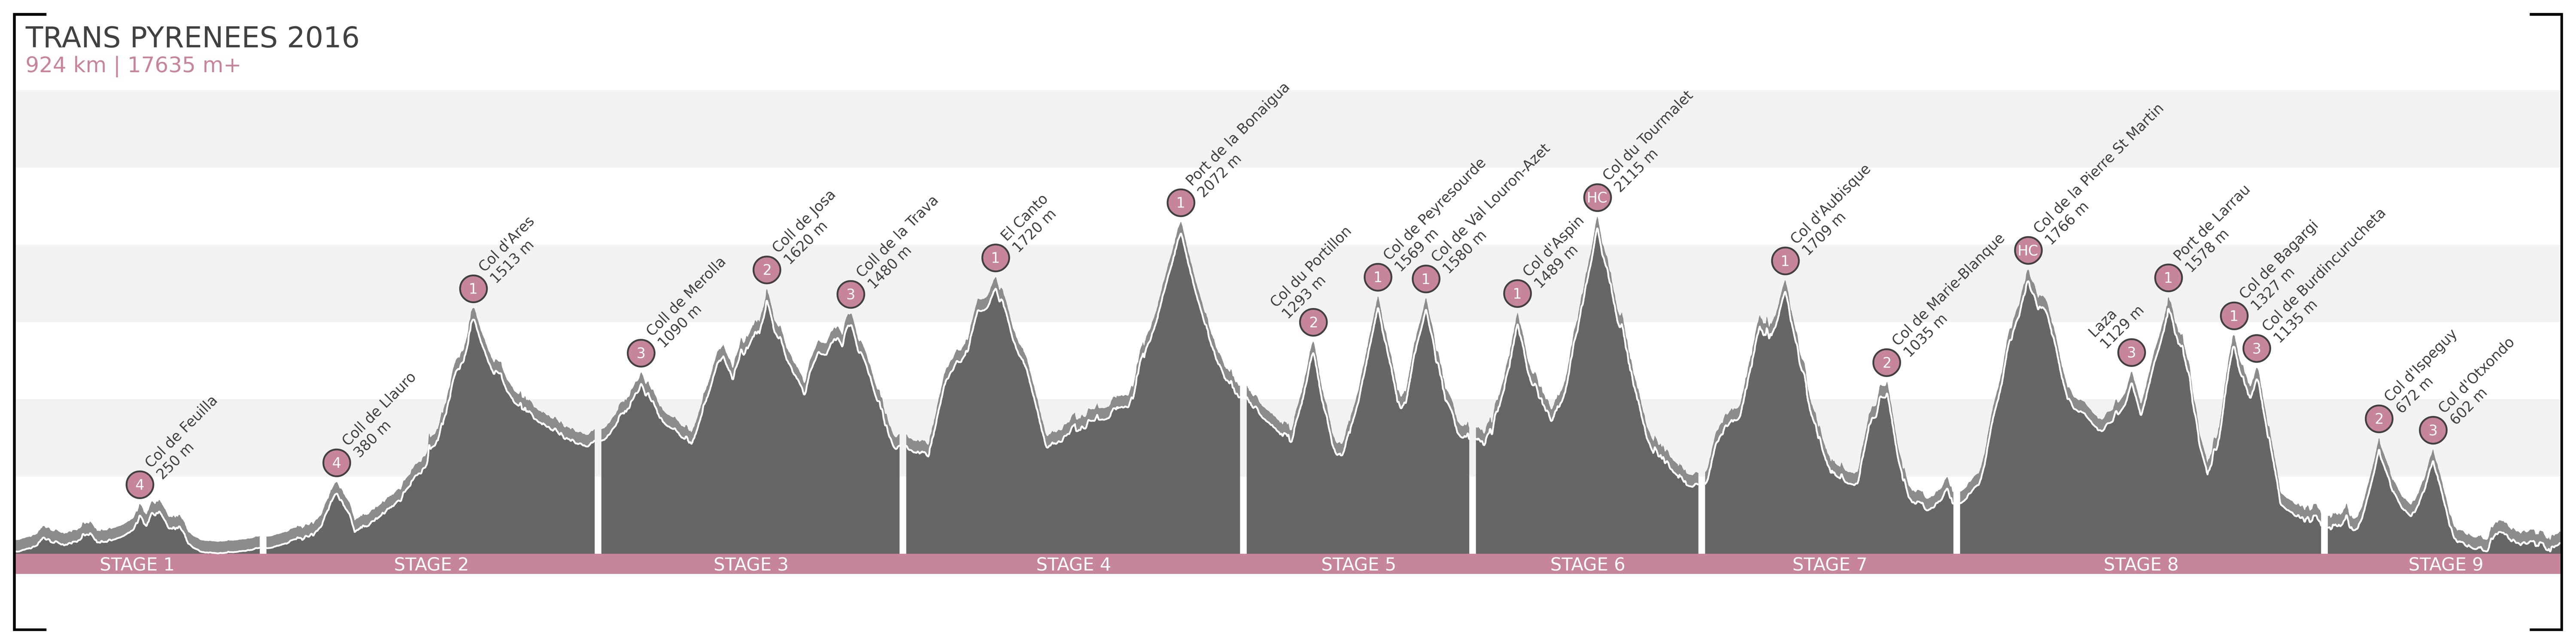
Four years after crossing the Pyrenees with Willem from East to West (see the relevant posts here), I am going to revisit the region, and bike from the Atlantic Ocean to the Mediterranean Sea with a colleague (Stef). After a few months of low activity levels and motivation, I finally got back into the sport around the Christmas holidays, and since then I have been commuting by bike again (I love my Brompton), and I have been doing some proper training both inside (Zwift training plan) and outside (when the weather permits, and lately it has been really wet and windy, so less often than I would like to). Of course I needed a proper goal too, because one of the reasons I had lost my motivation to ride last year was the apparent pointlessness of my training, so I definitely wanted to change that. And since I don’t like races and big busy events, what better is there to do than another self supported ride across the Pyrenees!
My planning technique has not really changed since 2016, I still used Strava (even though I had a look at Komoot too, but it had difficulties handling very long routes) and Google Street View to draw up the initial draft, then the availability of hotels set the final stage starts and finishes. I originally wanted to start from San Sebastián, but in the last minute it turned out that the one way extra fee for renting a car in France and dropping it off in Spain (that we need for the drive back to the start on the last day) would have been more than 2000 EUR, so at the end I had to settle with starting in Biarritz (where we finished four years ago).
We have already booked everything (hotels, rental car from Perpignan to Biarritz, long-term parking in Biarritz), so now we just need to train. Being in a good shape will be definitely necessary, because while this time we will have a rest day in the middle, there will be much more climbing than the last time… The final route can be seen below.
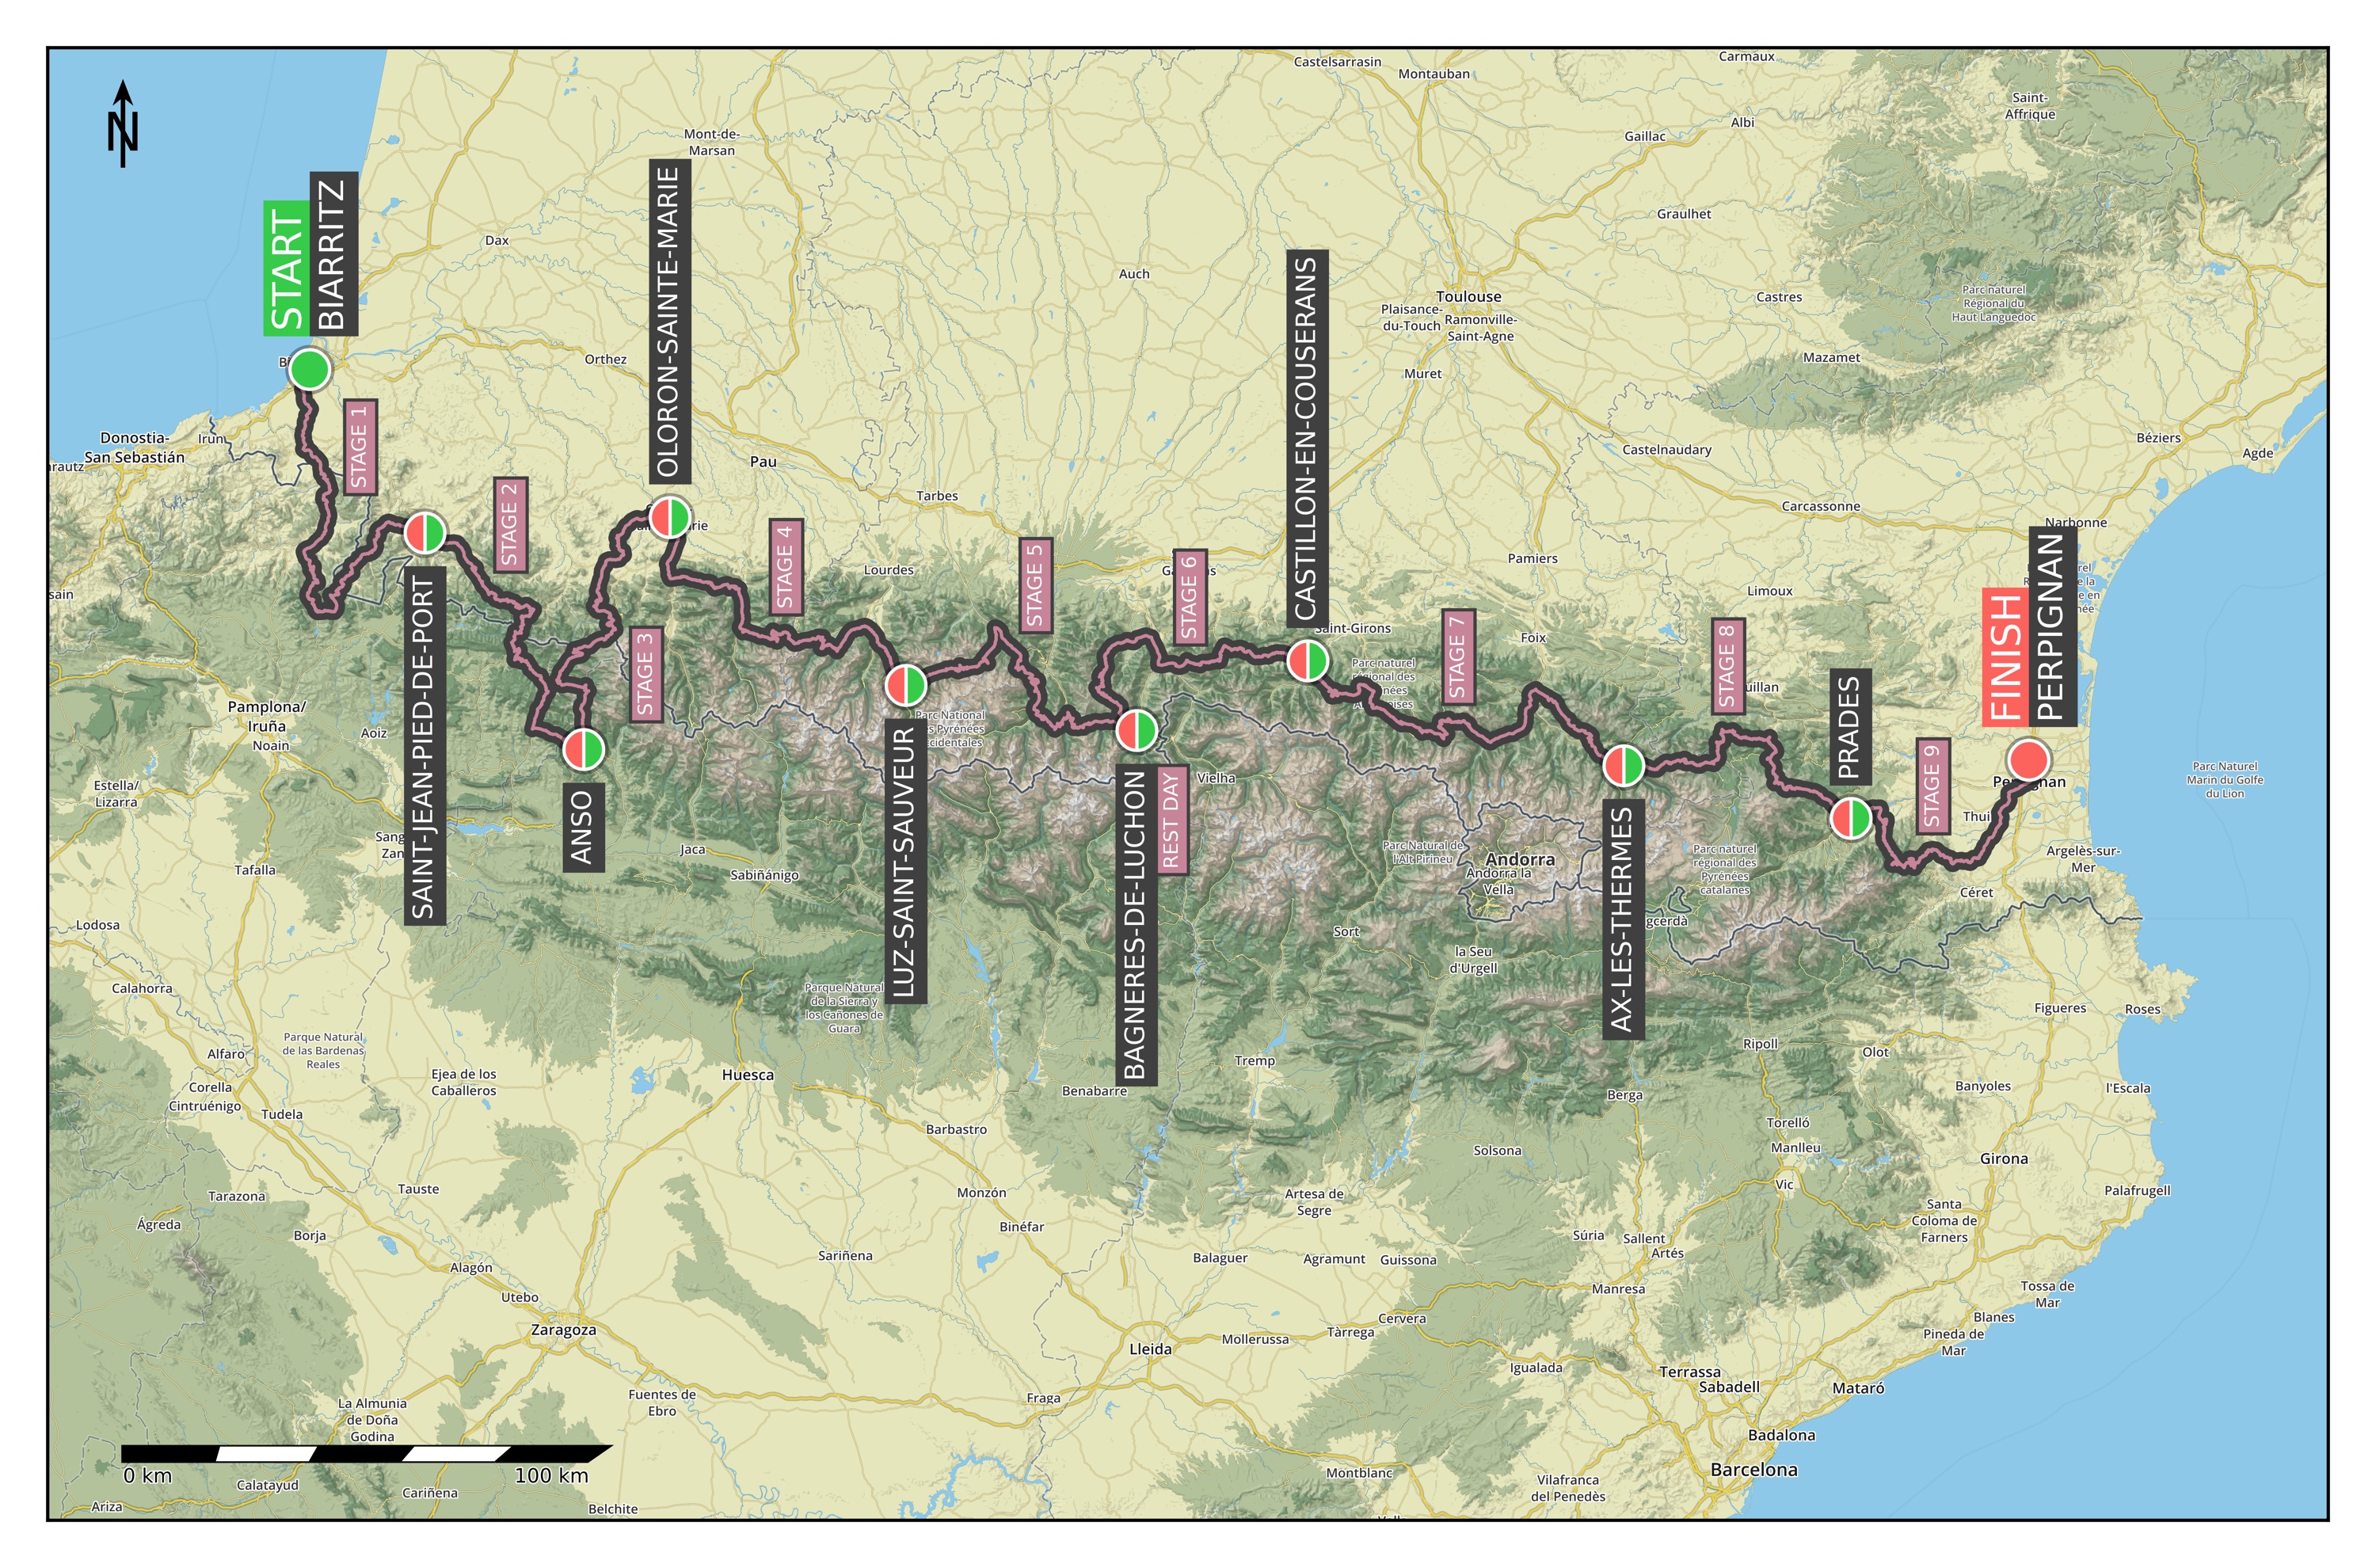
It is a total of 993 km, and 25601 metres of elevation gain over 32 (+1) cols (excluding the rest day). An overview of the elevation profile of the whole route can be seen below. (The climb categories were calculated following the discussion presented here.)
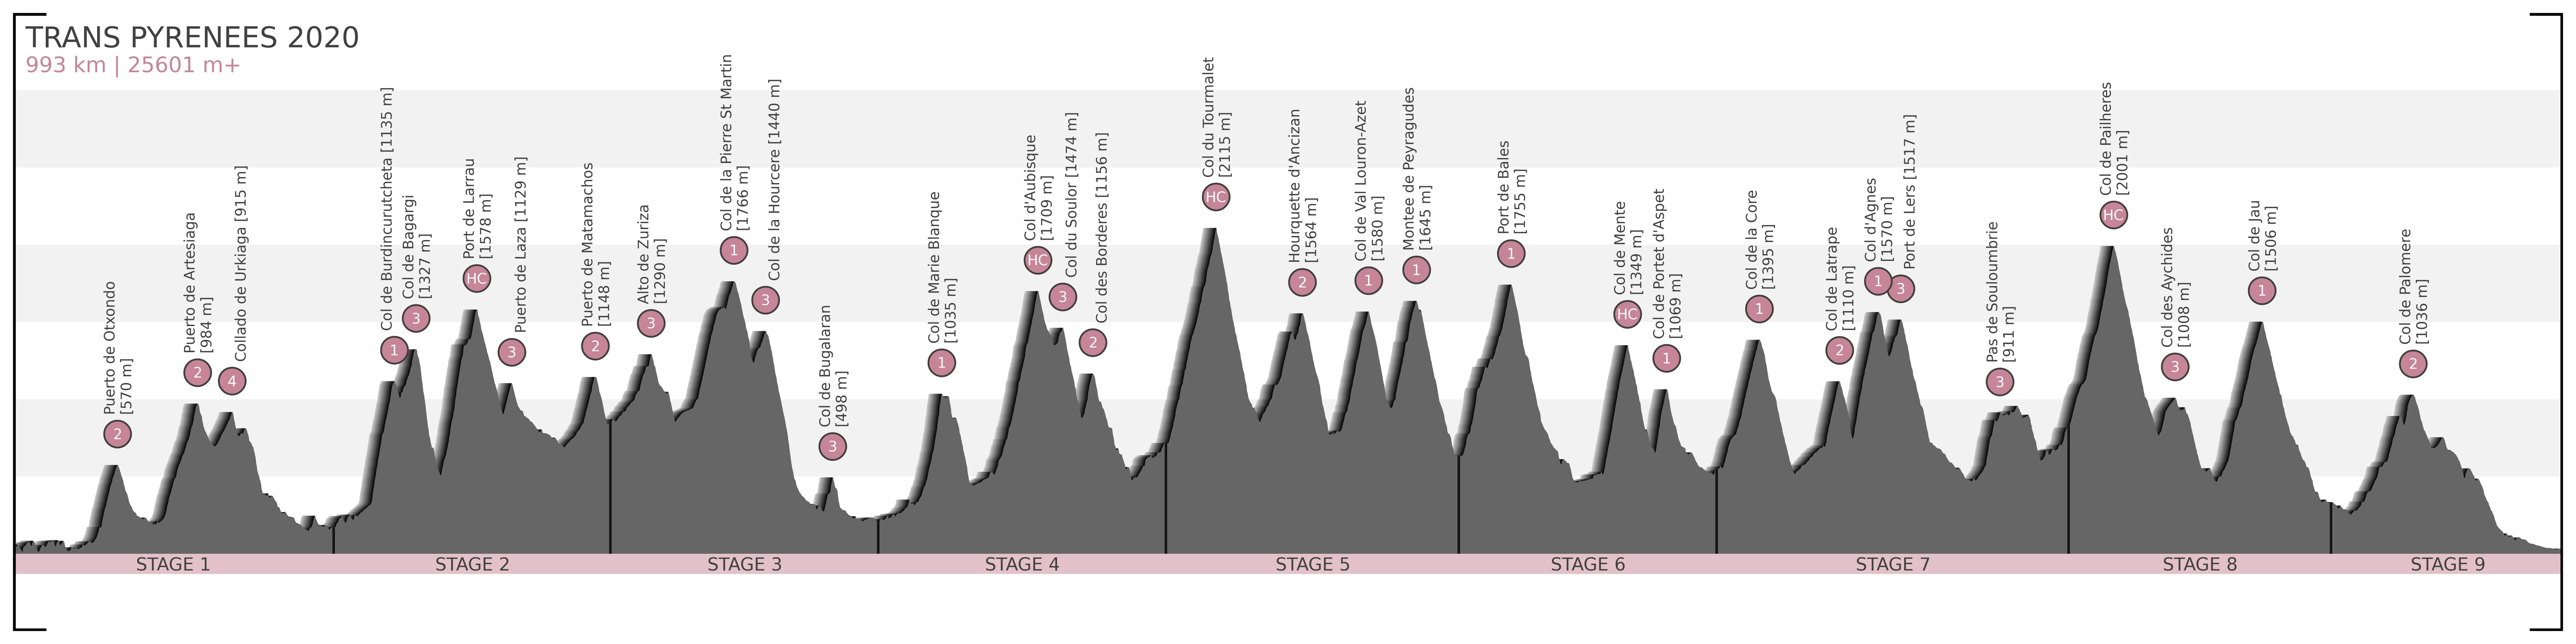
Now here is a detailed overview of the planned stages with distances, elevation gains, maps, profiles, and a list of cols for each day:
- June 10:
Drive to Biarritz. - June 11:
On the morning we drive to the airport, where we have long-term parking booked, and start from there.
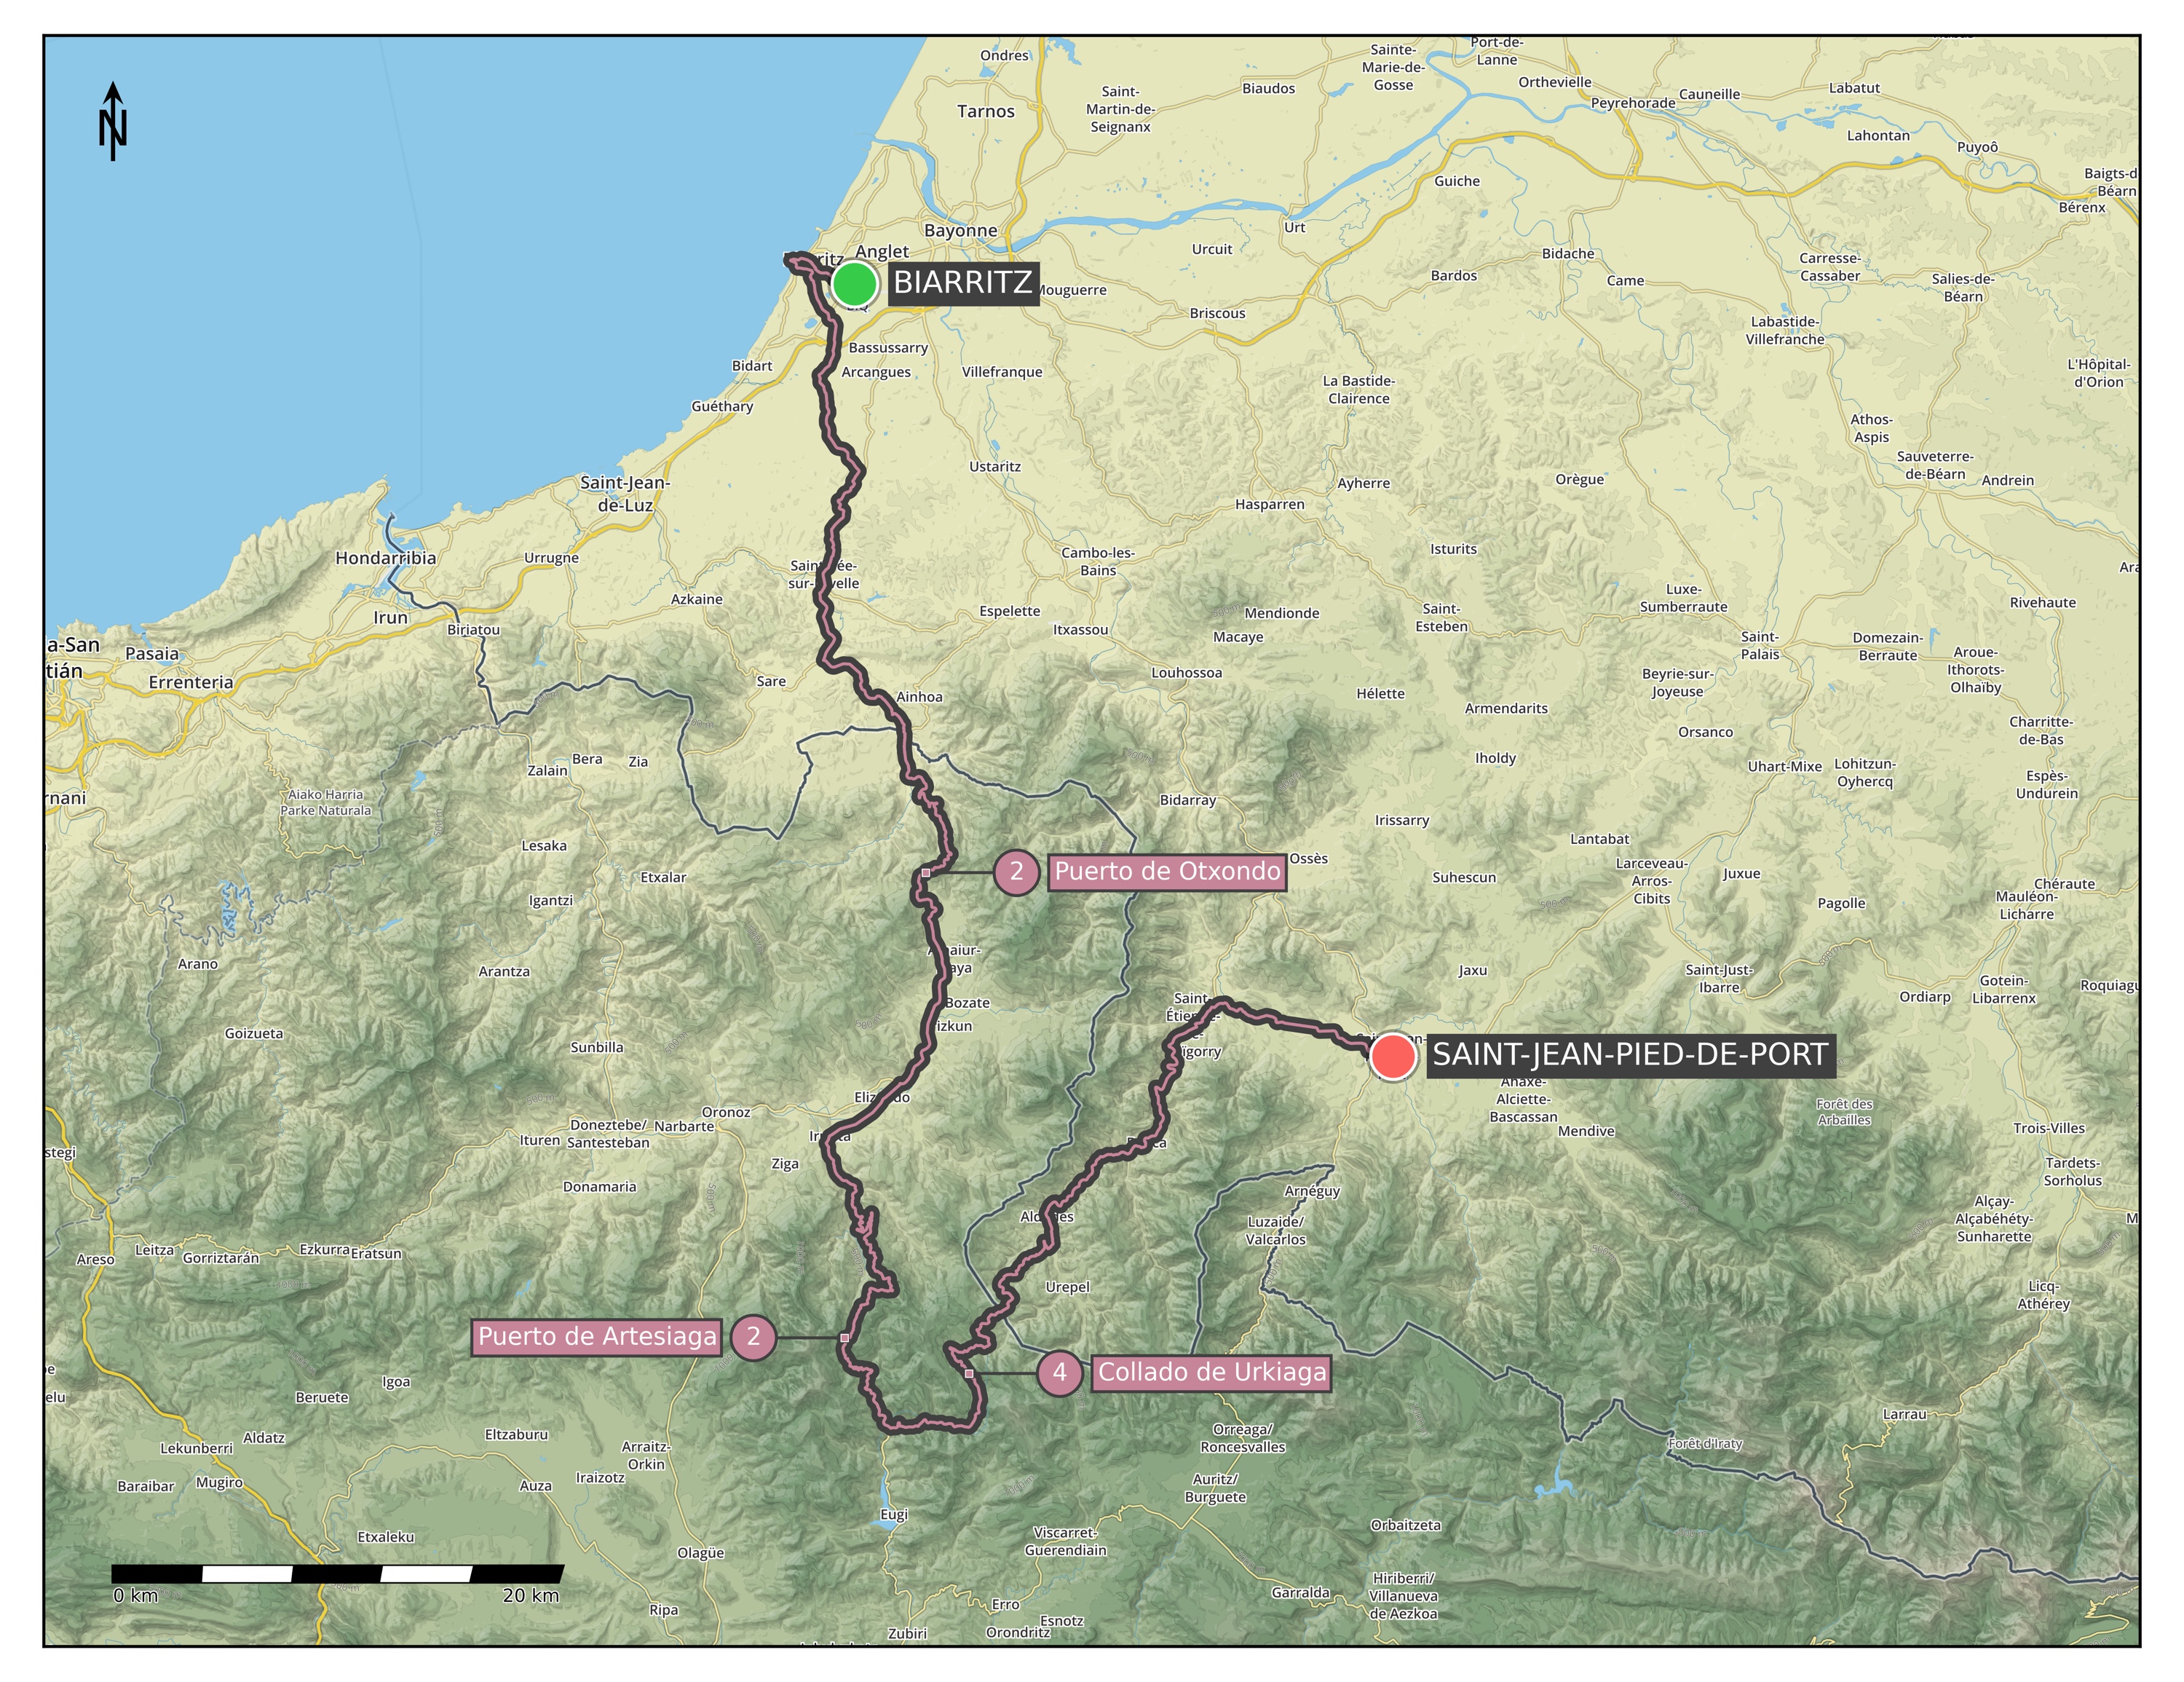
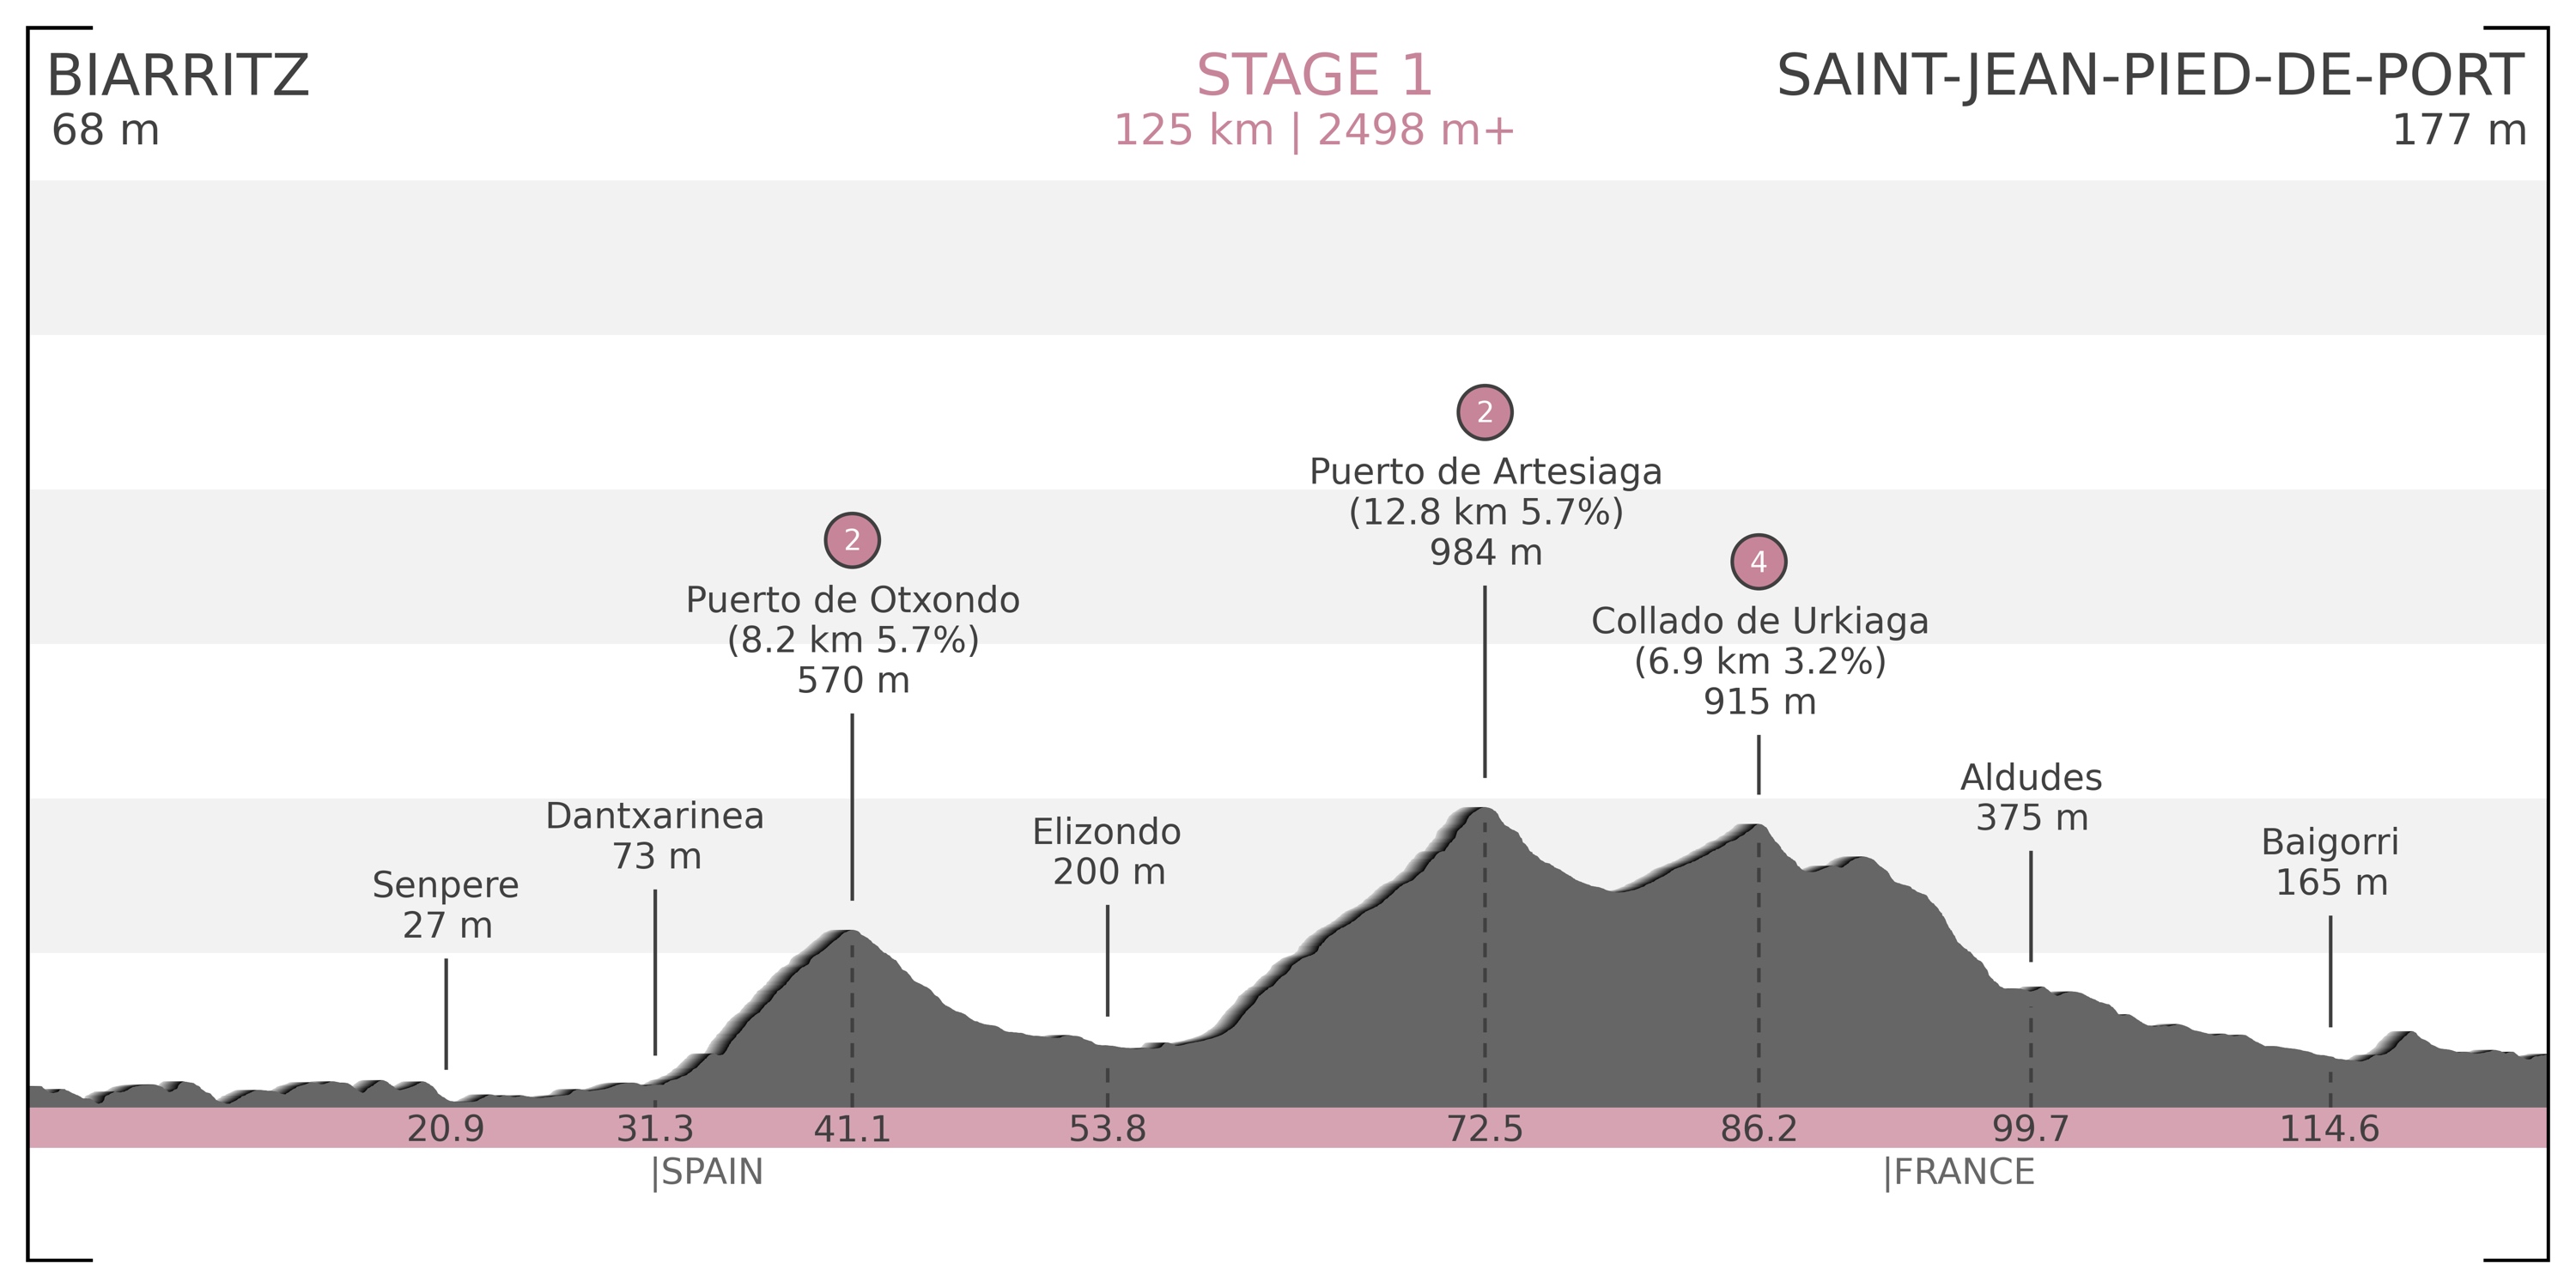
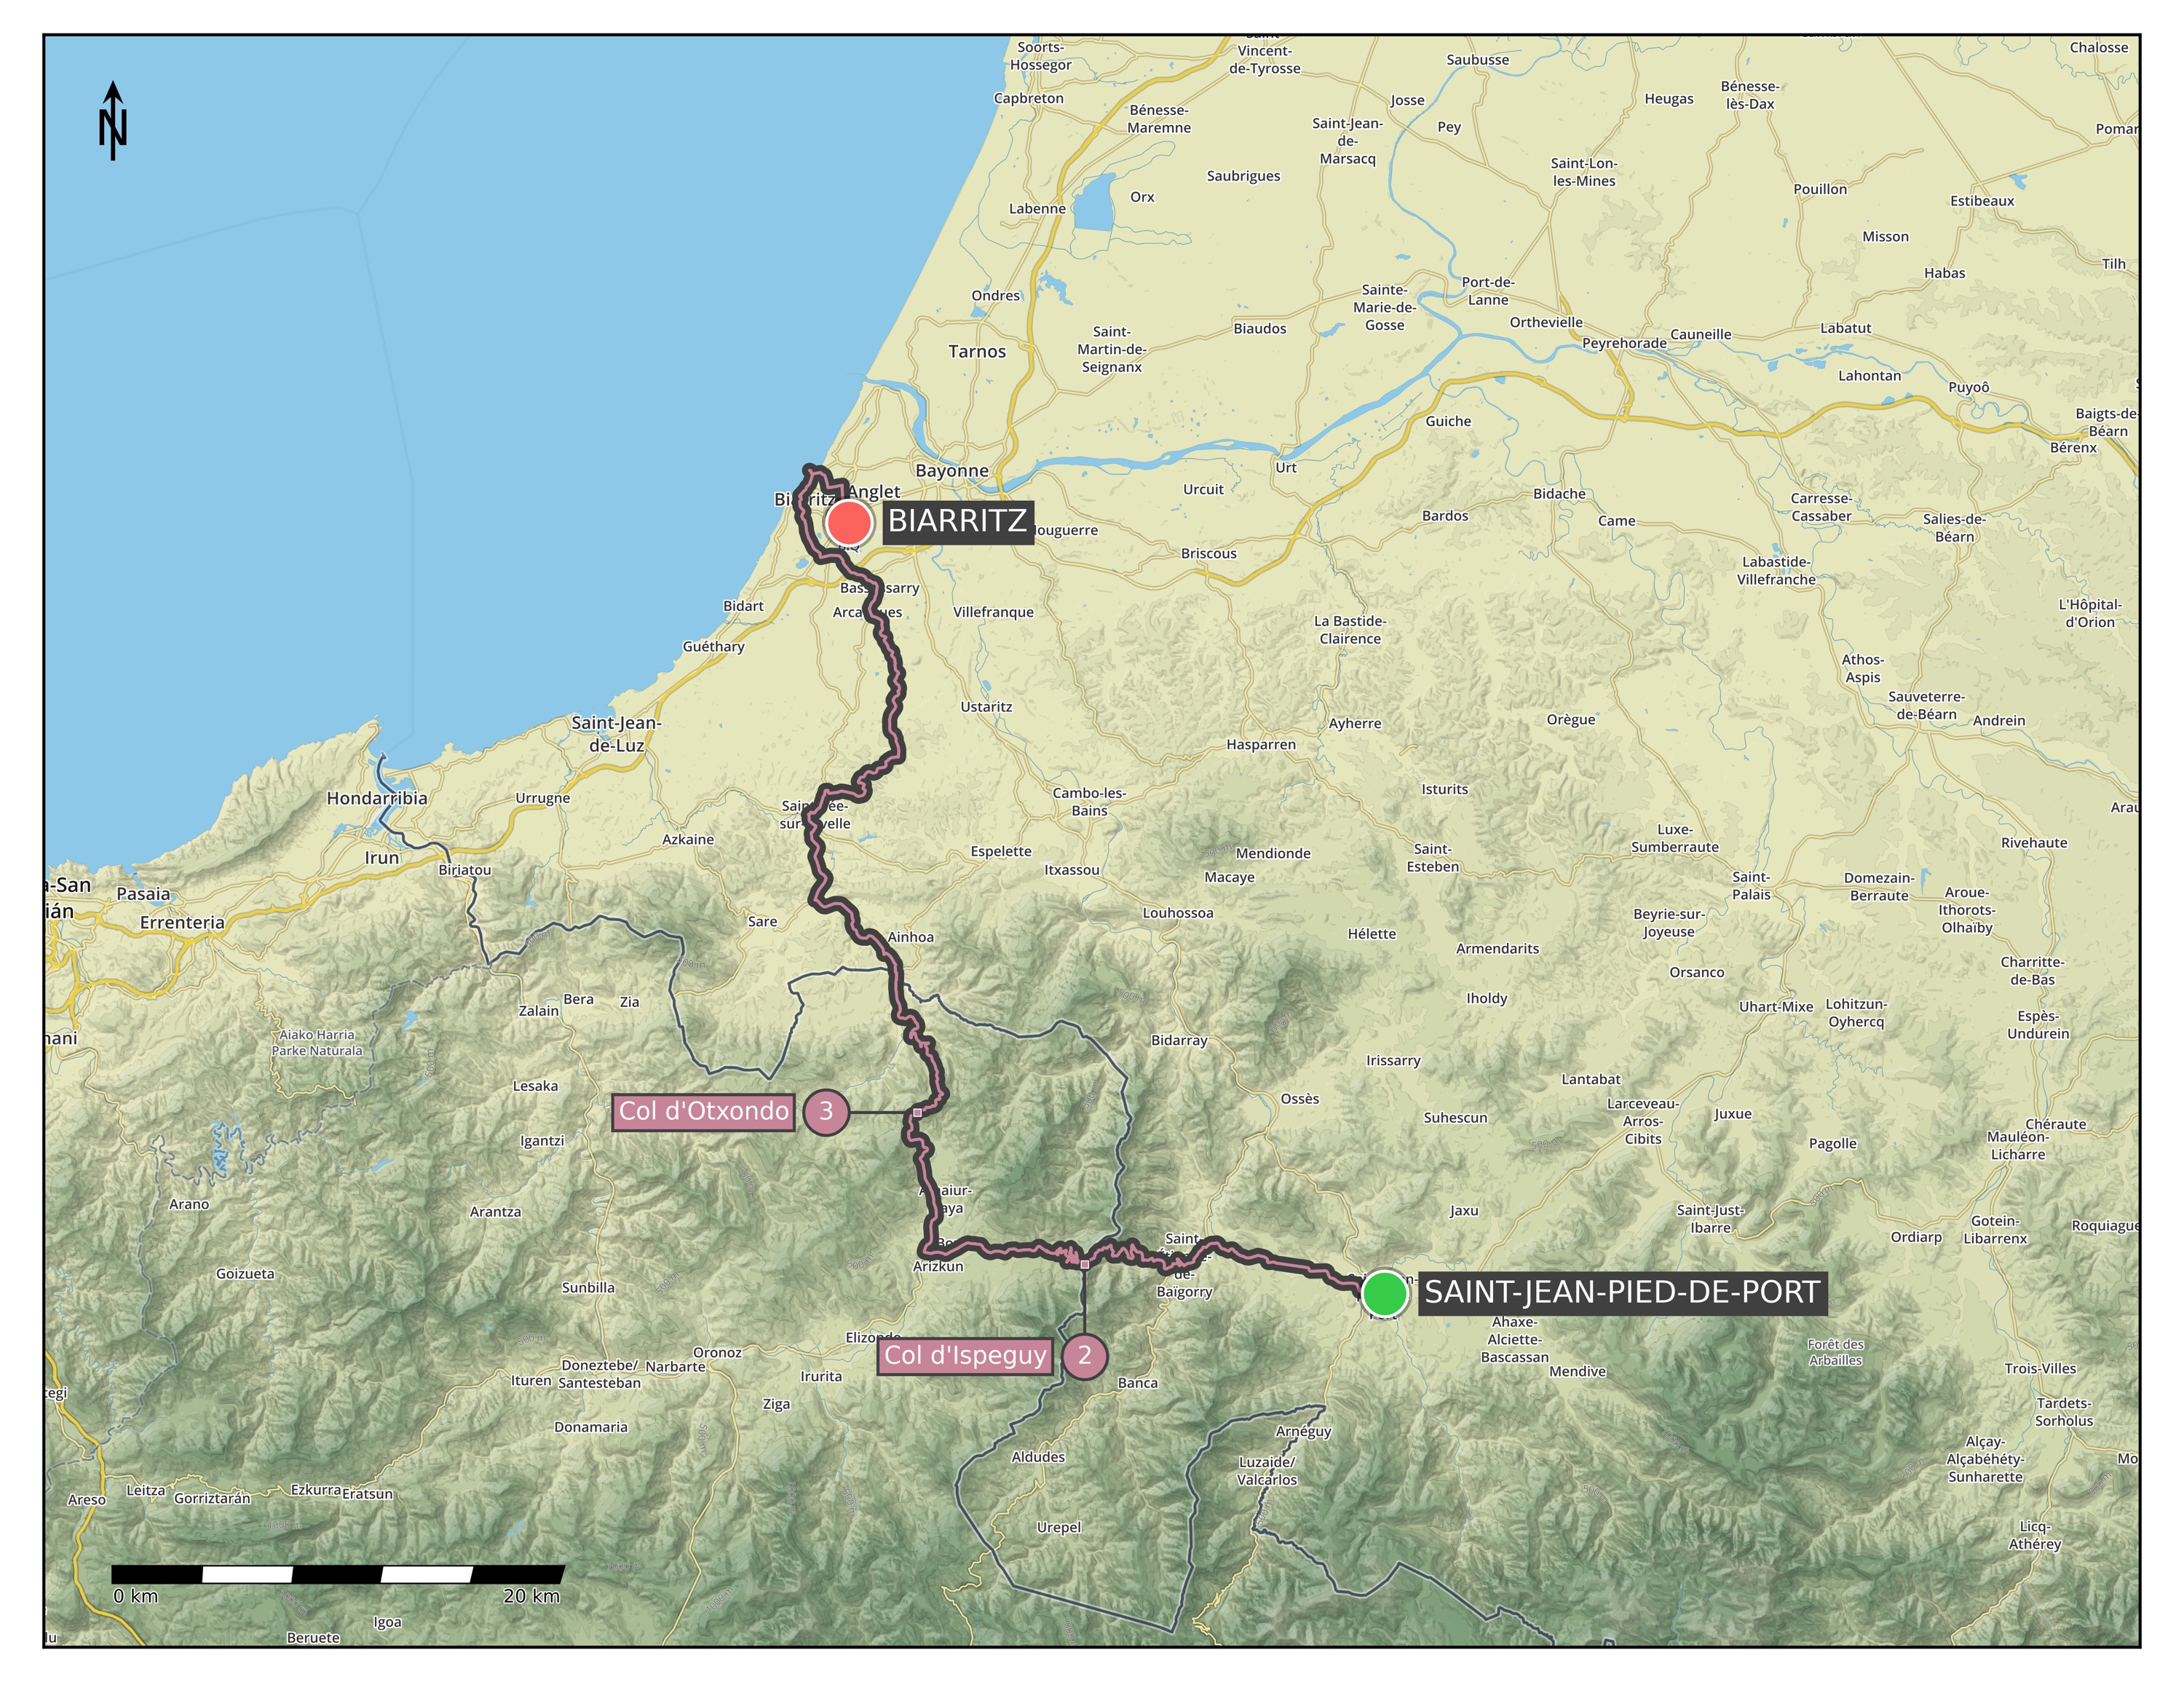
Stage 1) Biarritz – Saint-Jean-Pied-de-Port: 125 km | 2498 m+ (Map / Profile)
– Puerto de Otxondo [570 m] Cat 2 (8.2 km @ 5.7%)
– Puerto de Artesiaga [984 m] Cat 2 (12.8 km @ 5.7%)
– Collado de Urkiaga [915 m] Cat 4 (6.9 km @ 3.2%) - June 12:
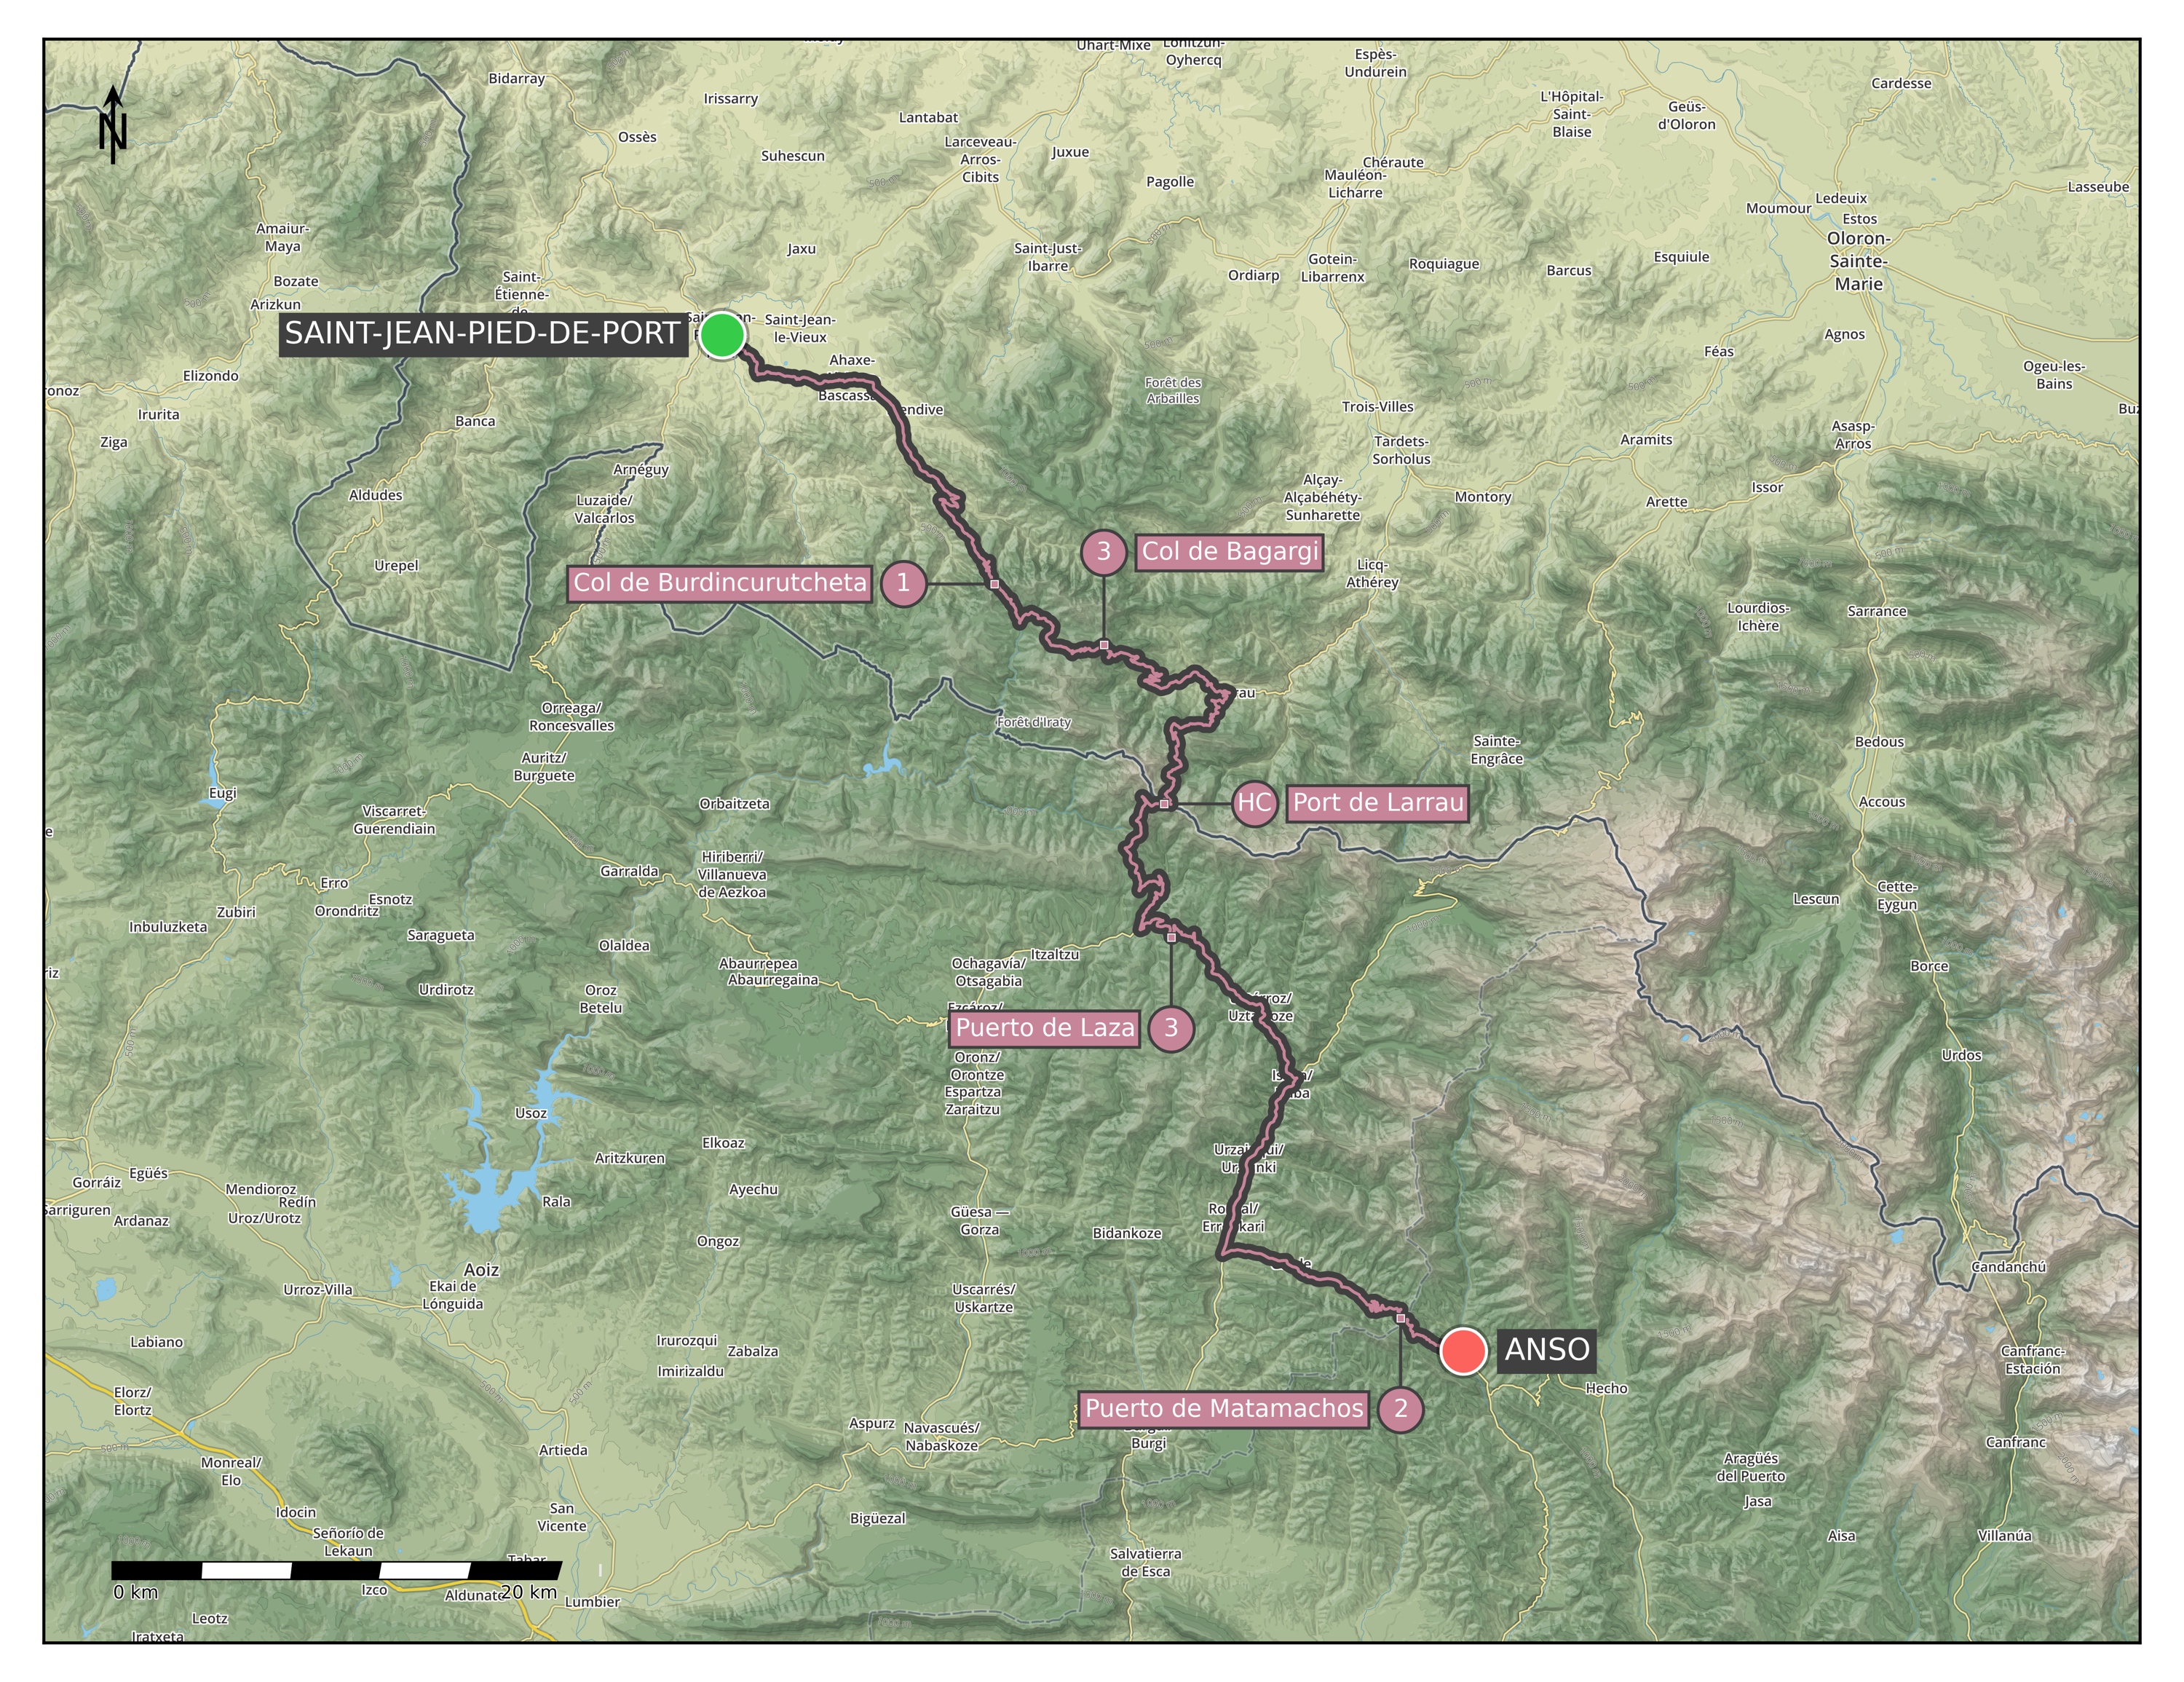
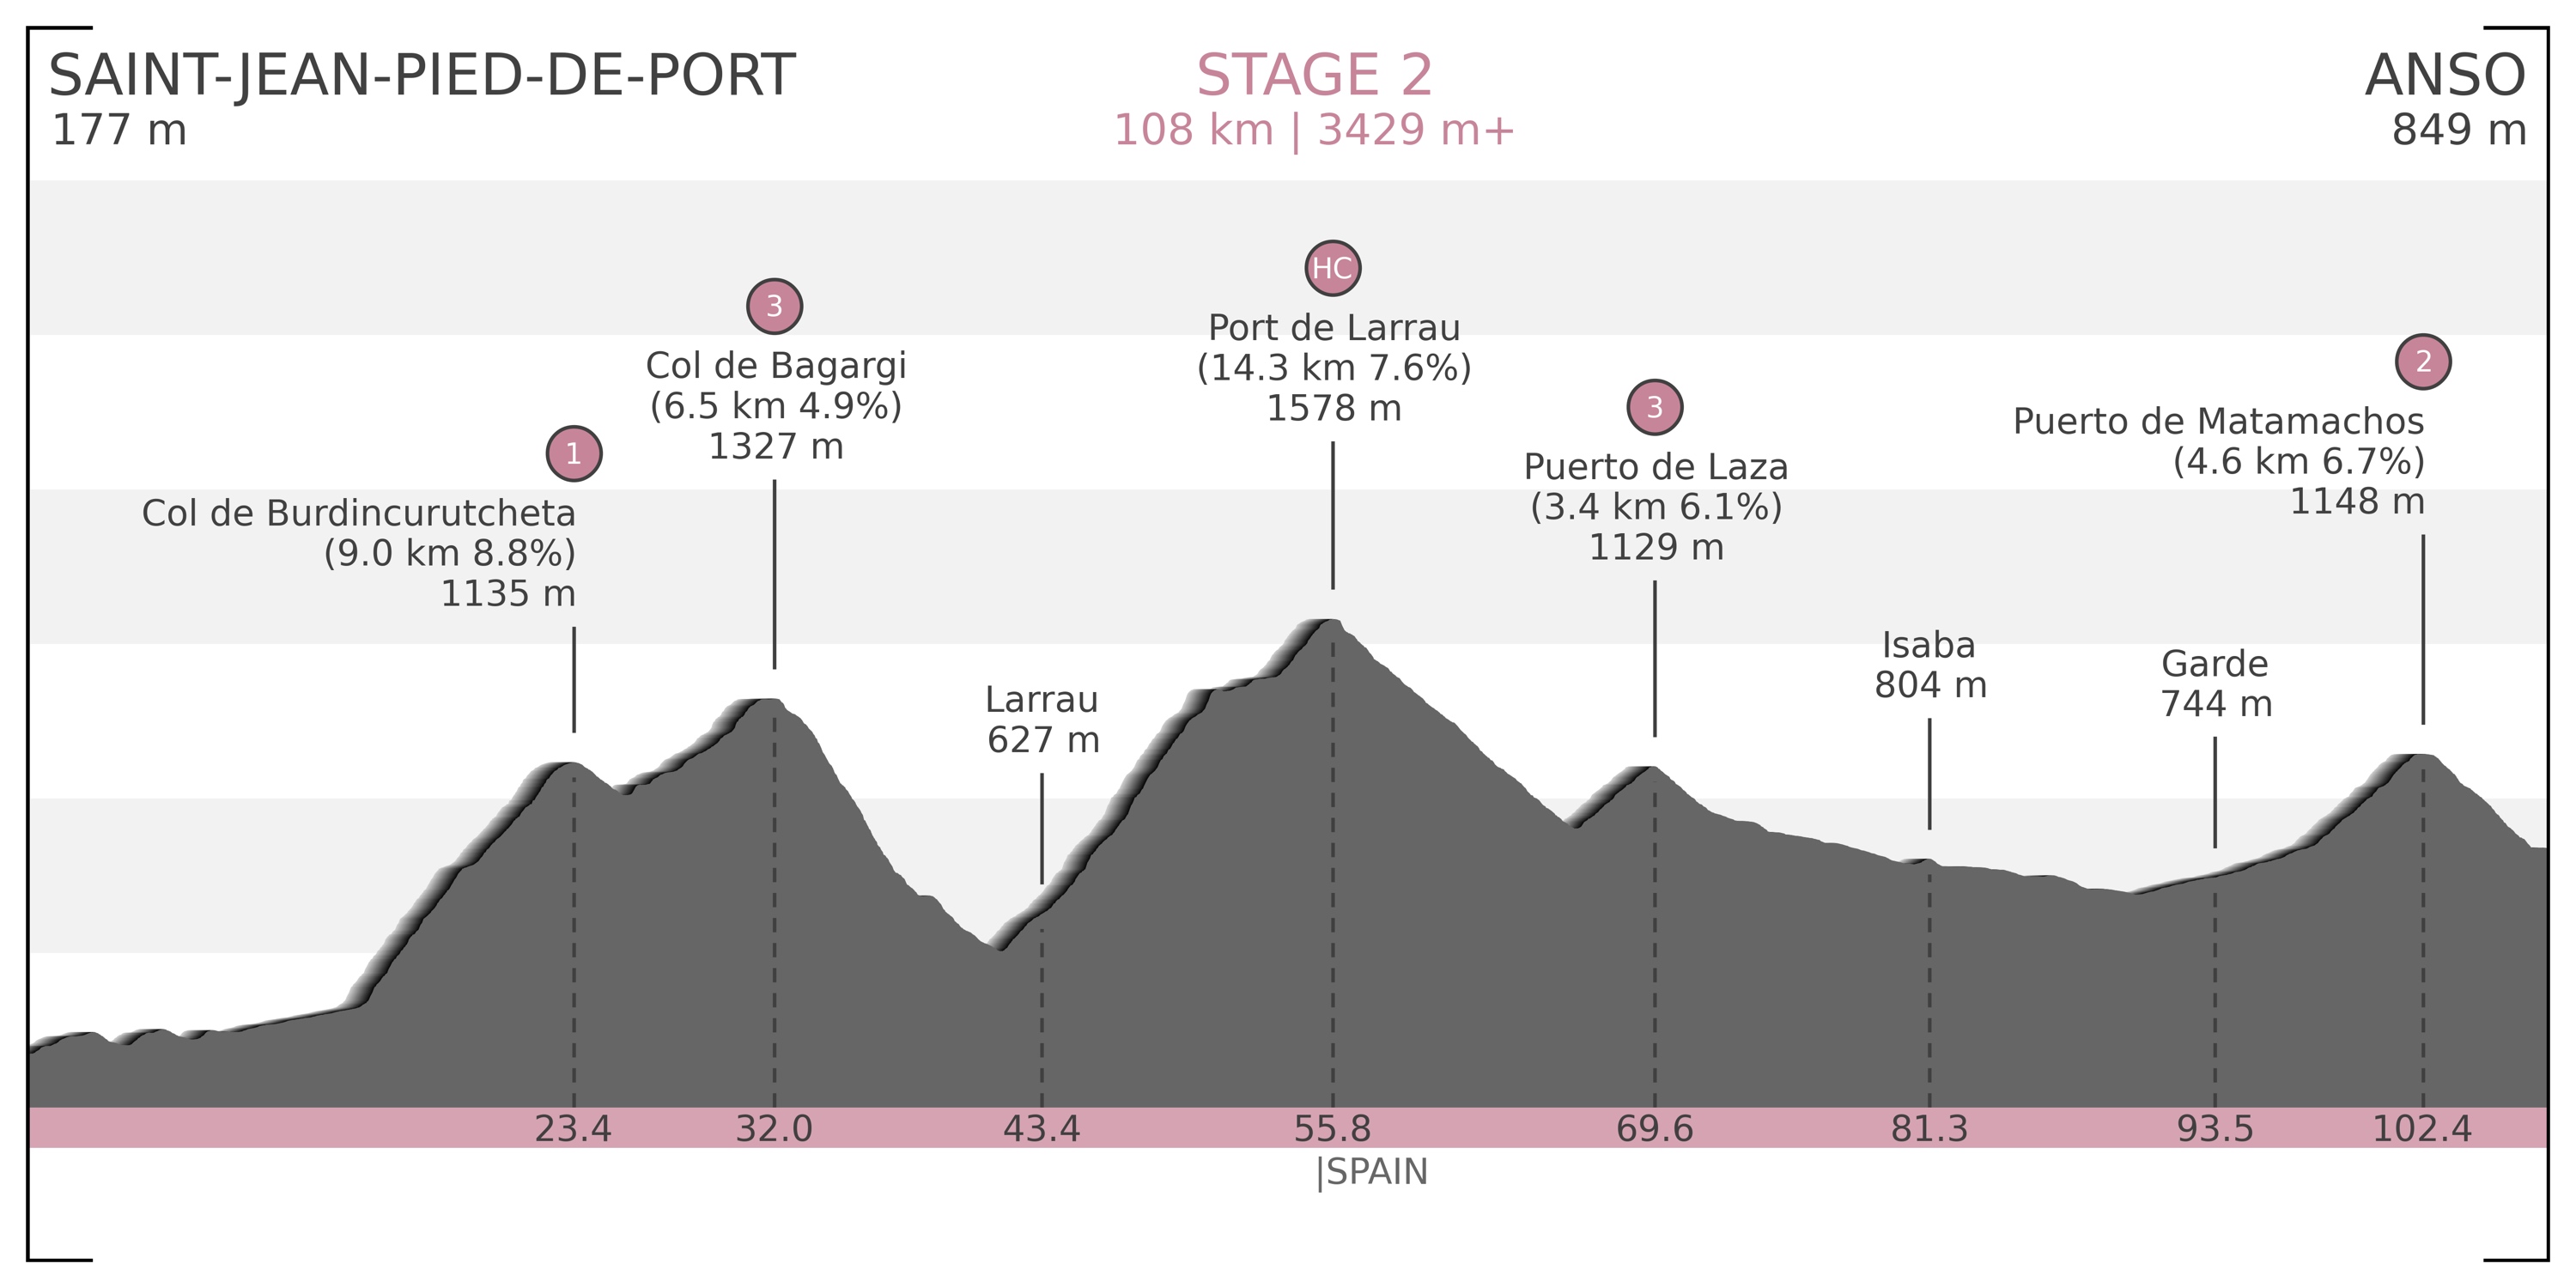
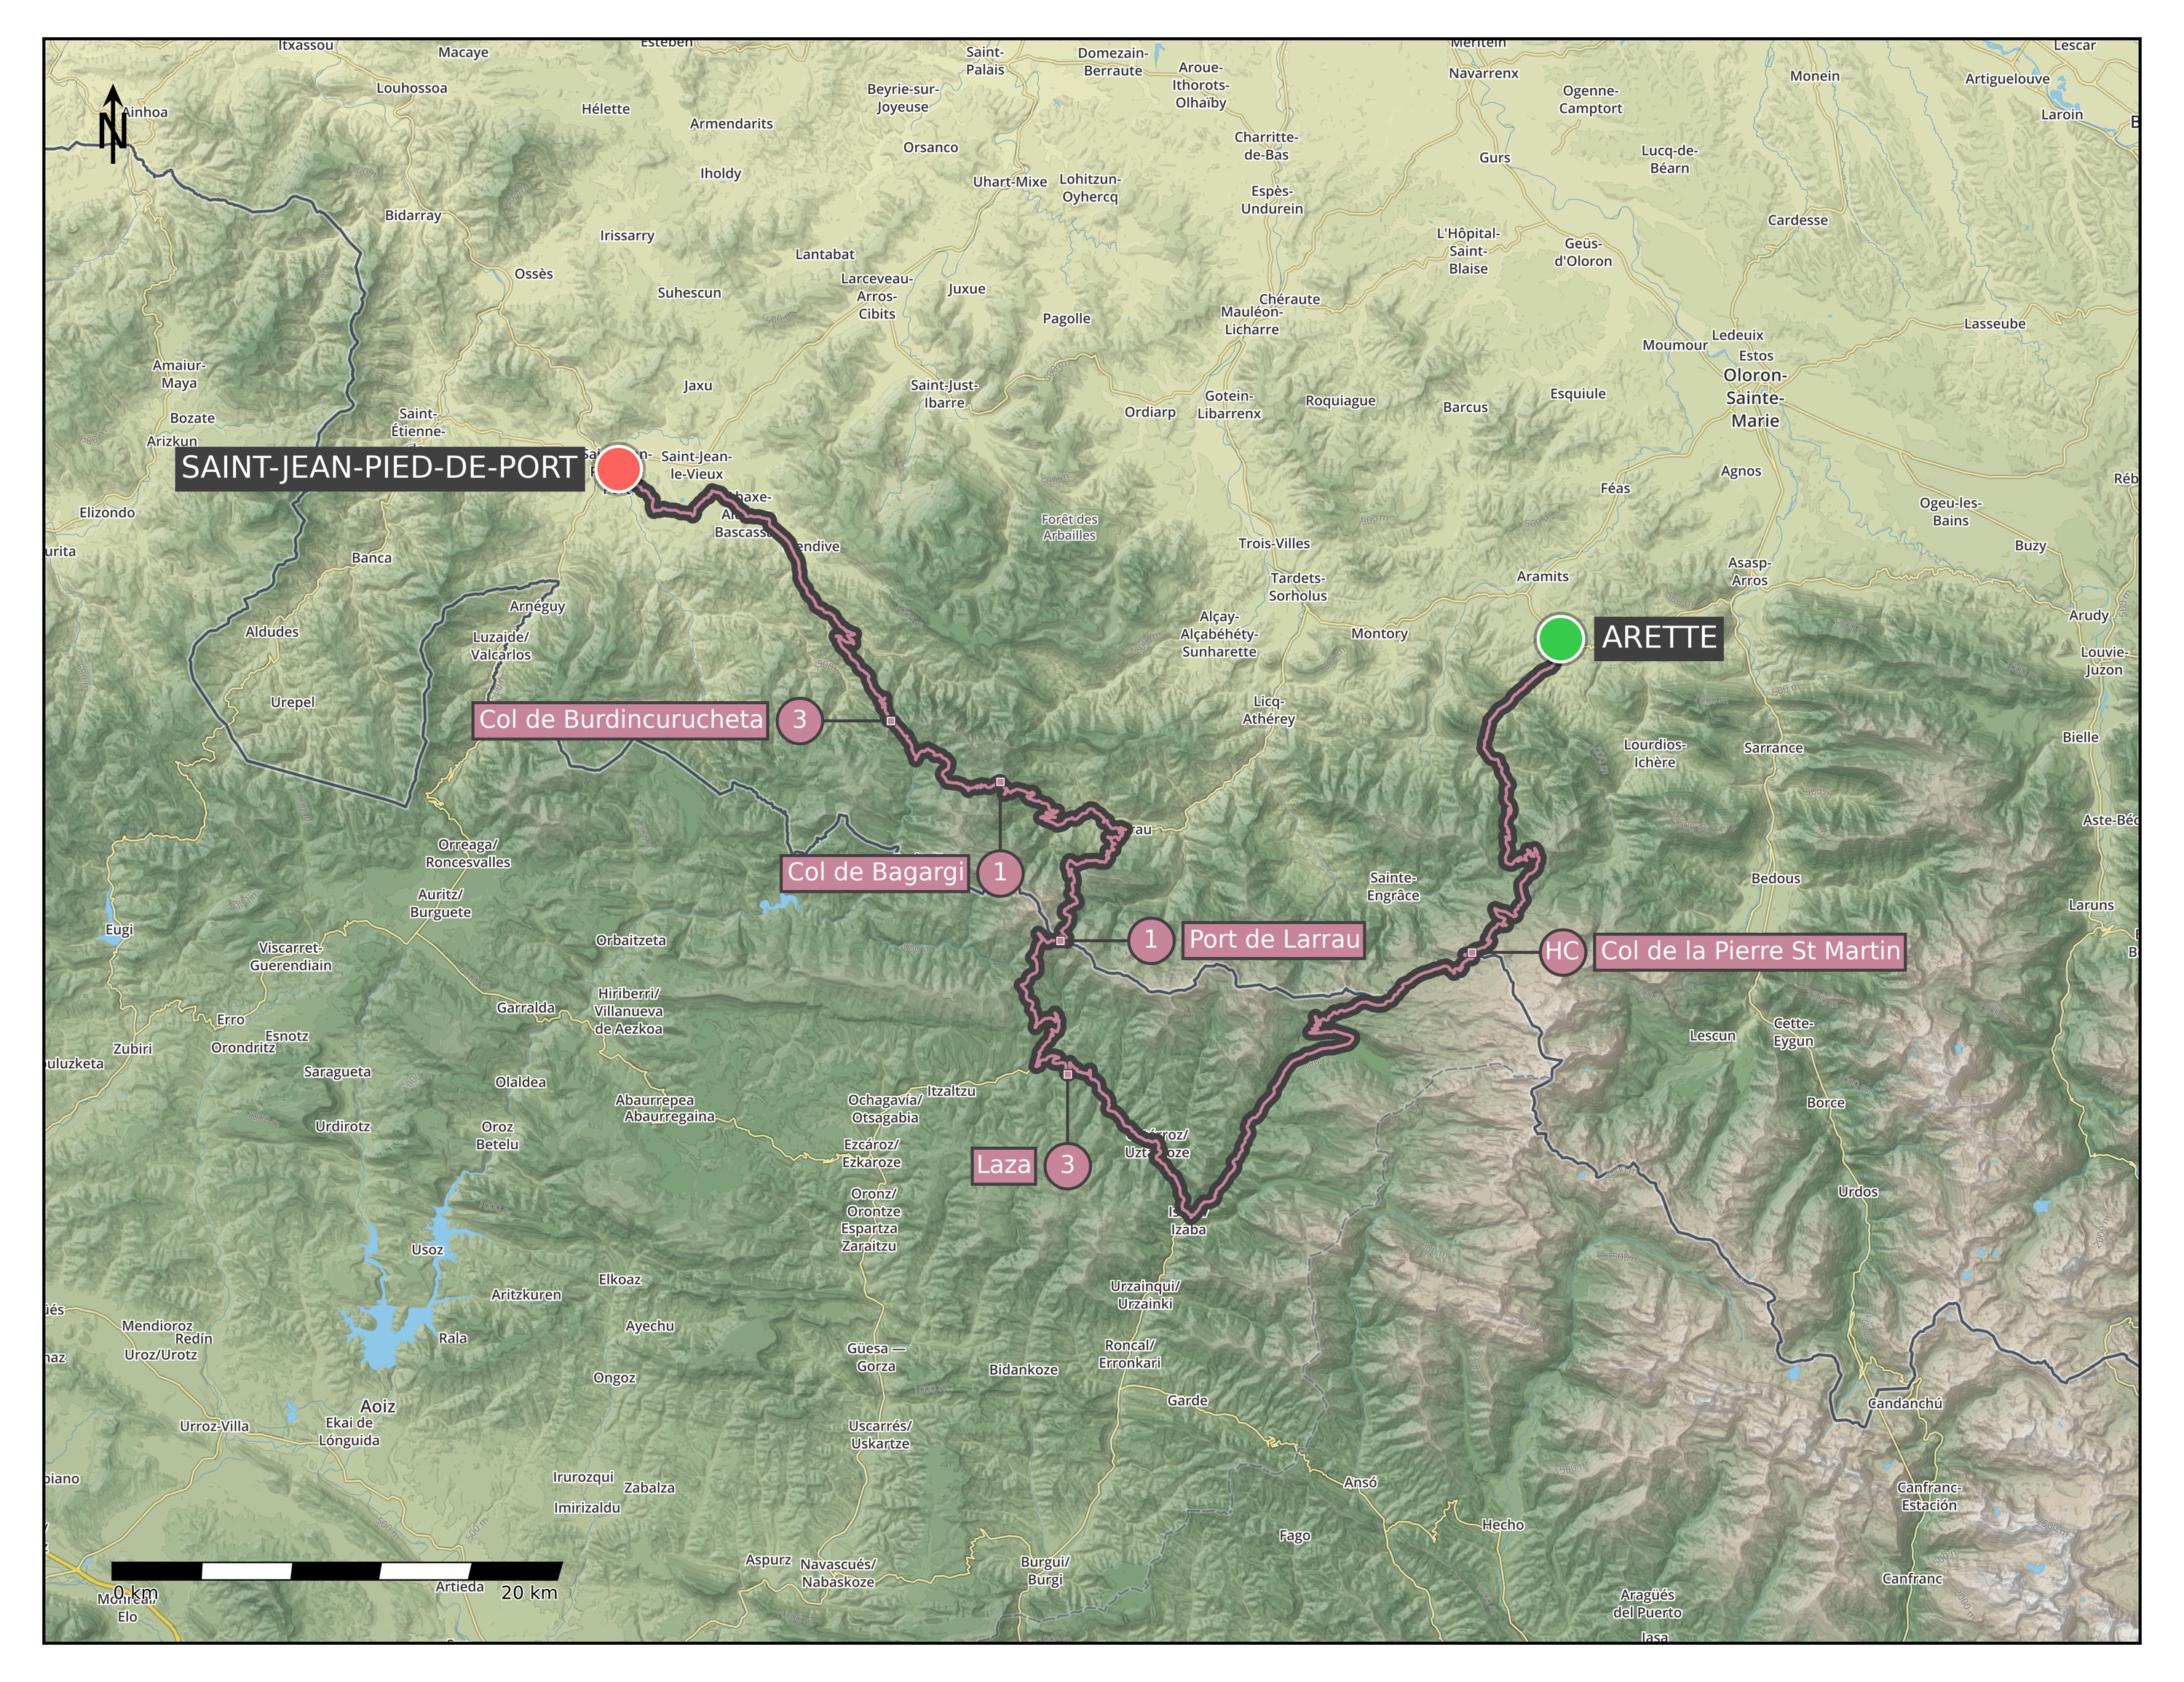
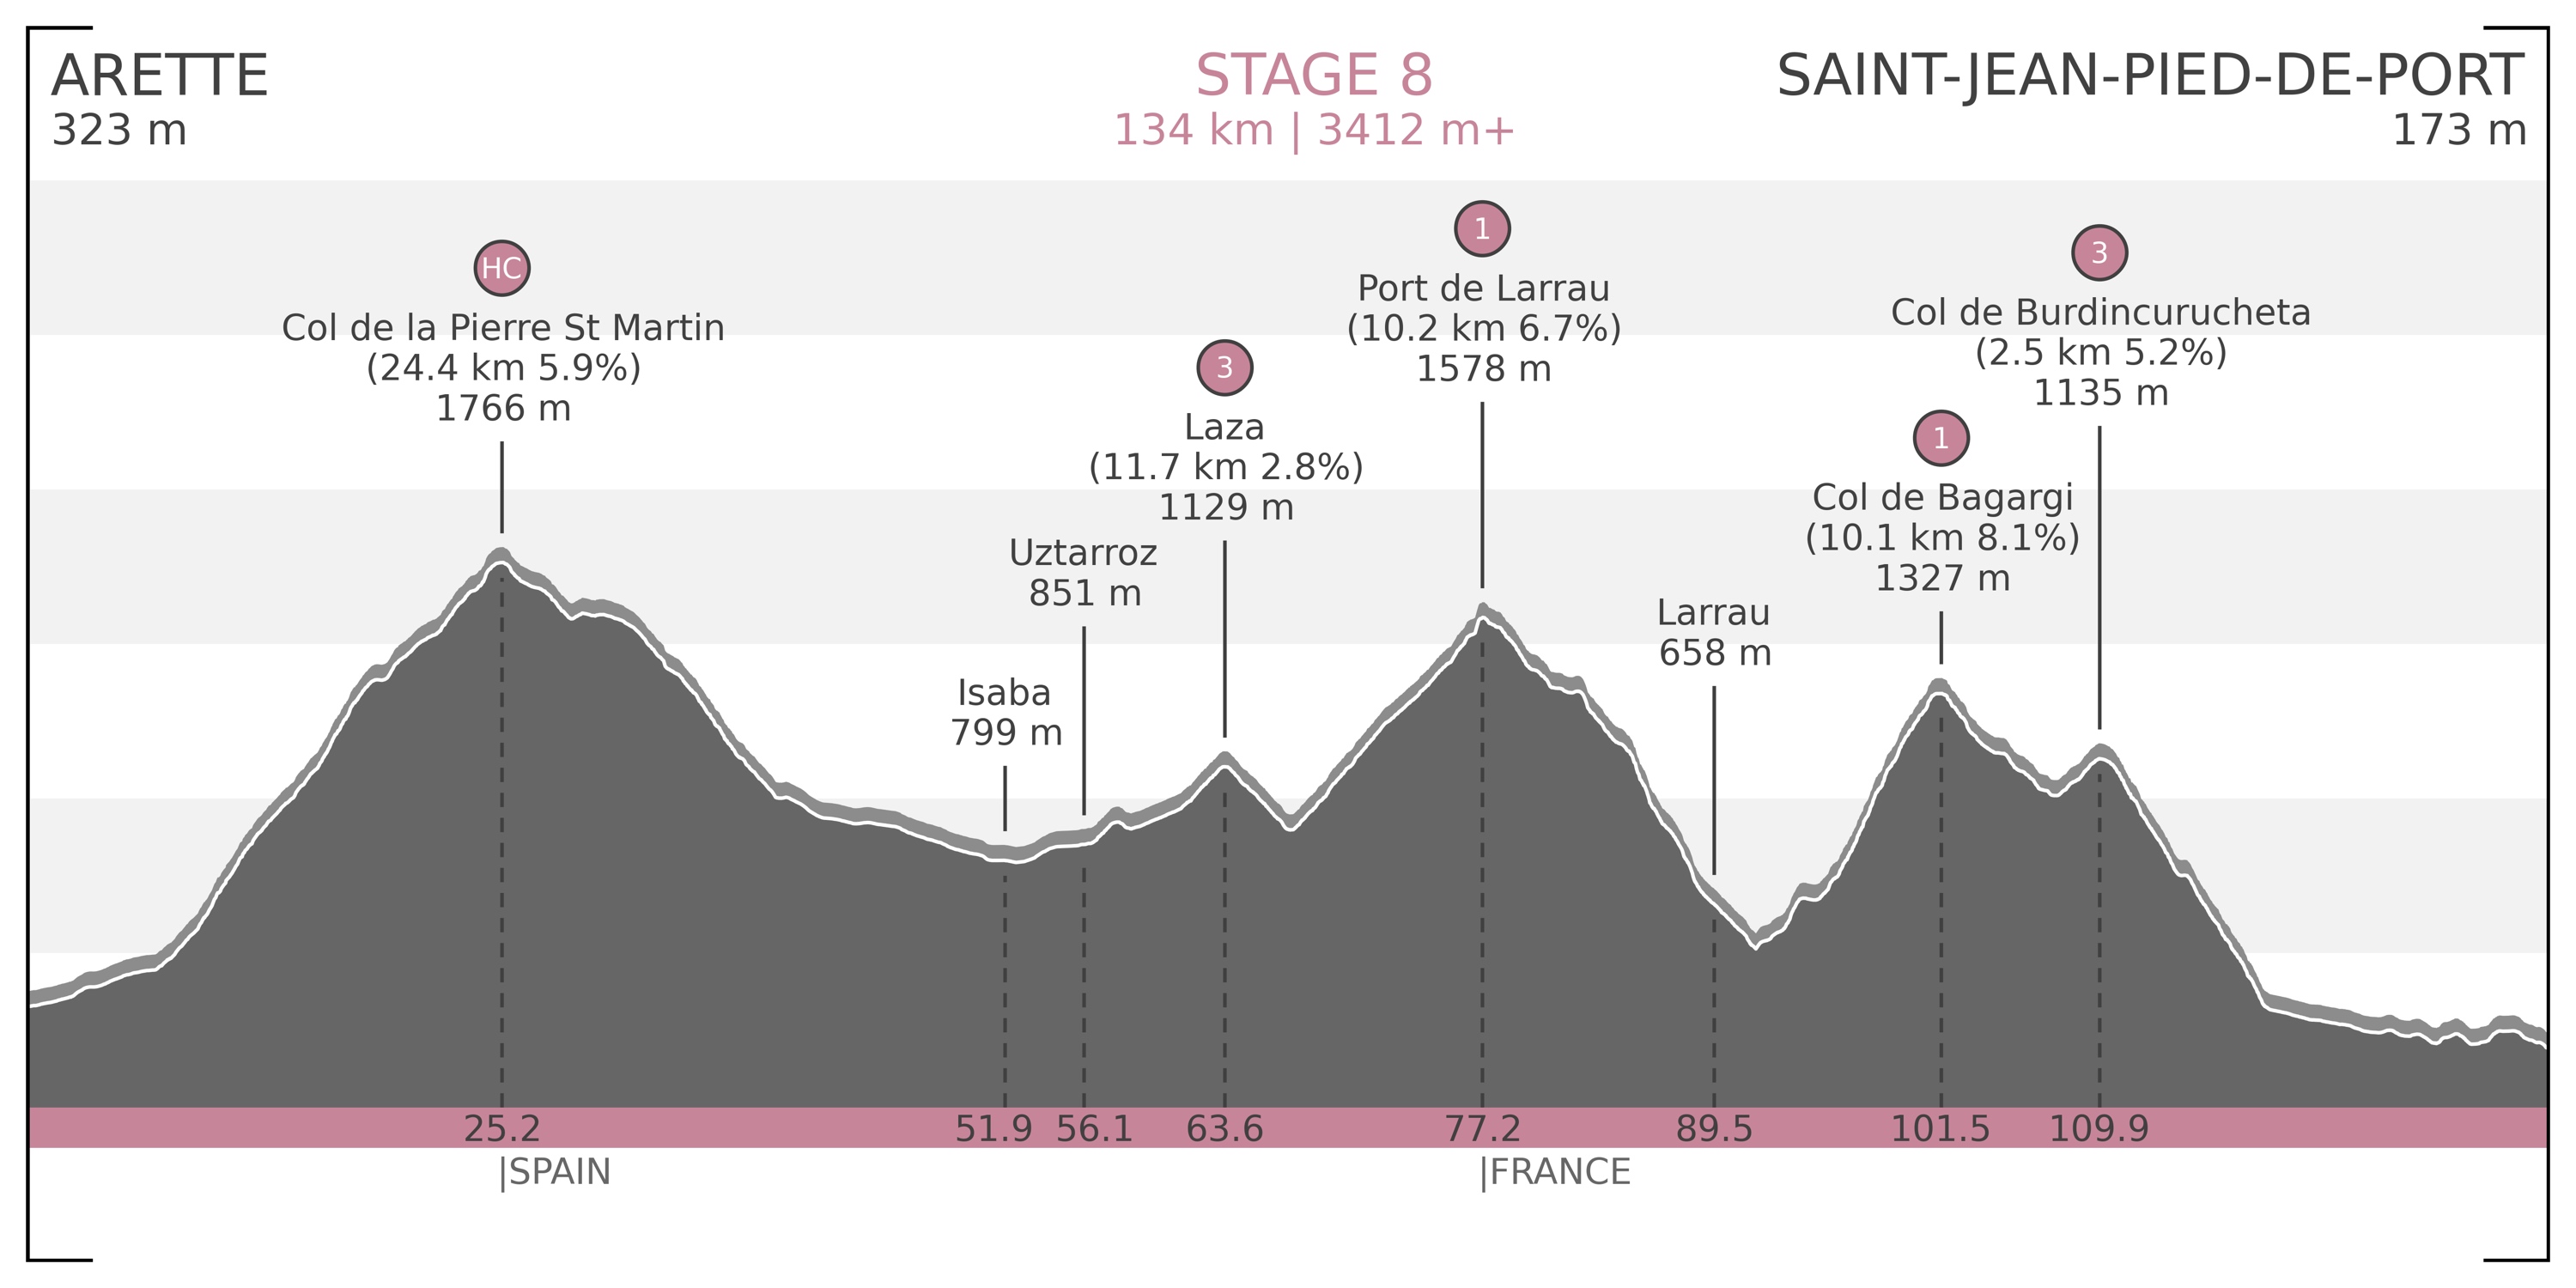
Stage 2) Saint-Jean Pied-de-Port – Anso: 108 km | 3429 m+ (Map / Profile)
– Col de Burdincurutcheta [1135 m] Cat 1 (9.0 km @ 8.8%)
– Col de Bagargi [1327 m] Cat 3 (6.5 km @ 4.9%)
– Port de Larrau [1578 m] HC (14.3 km @ 7.6%)
– Puerto de Laza [1129 m] Cat 3 (3.4 km @ 6.1%)
– Puerto de Matamachos [1148 m] Cat 2 (4.6 km @ 6.7%) - June 13:
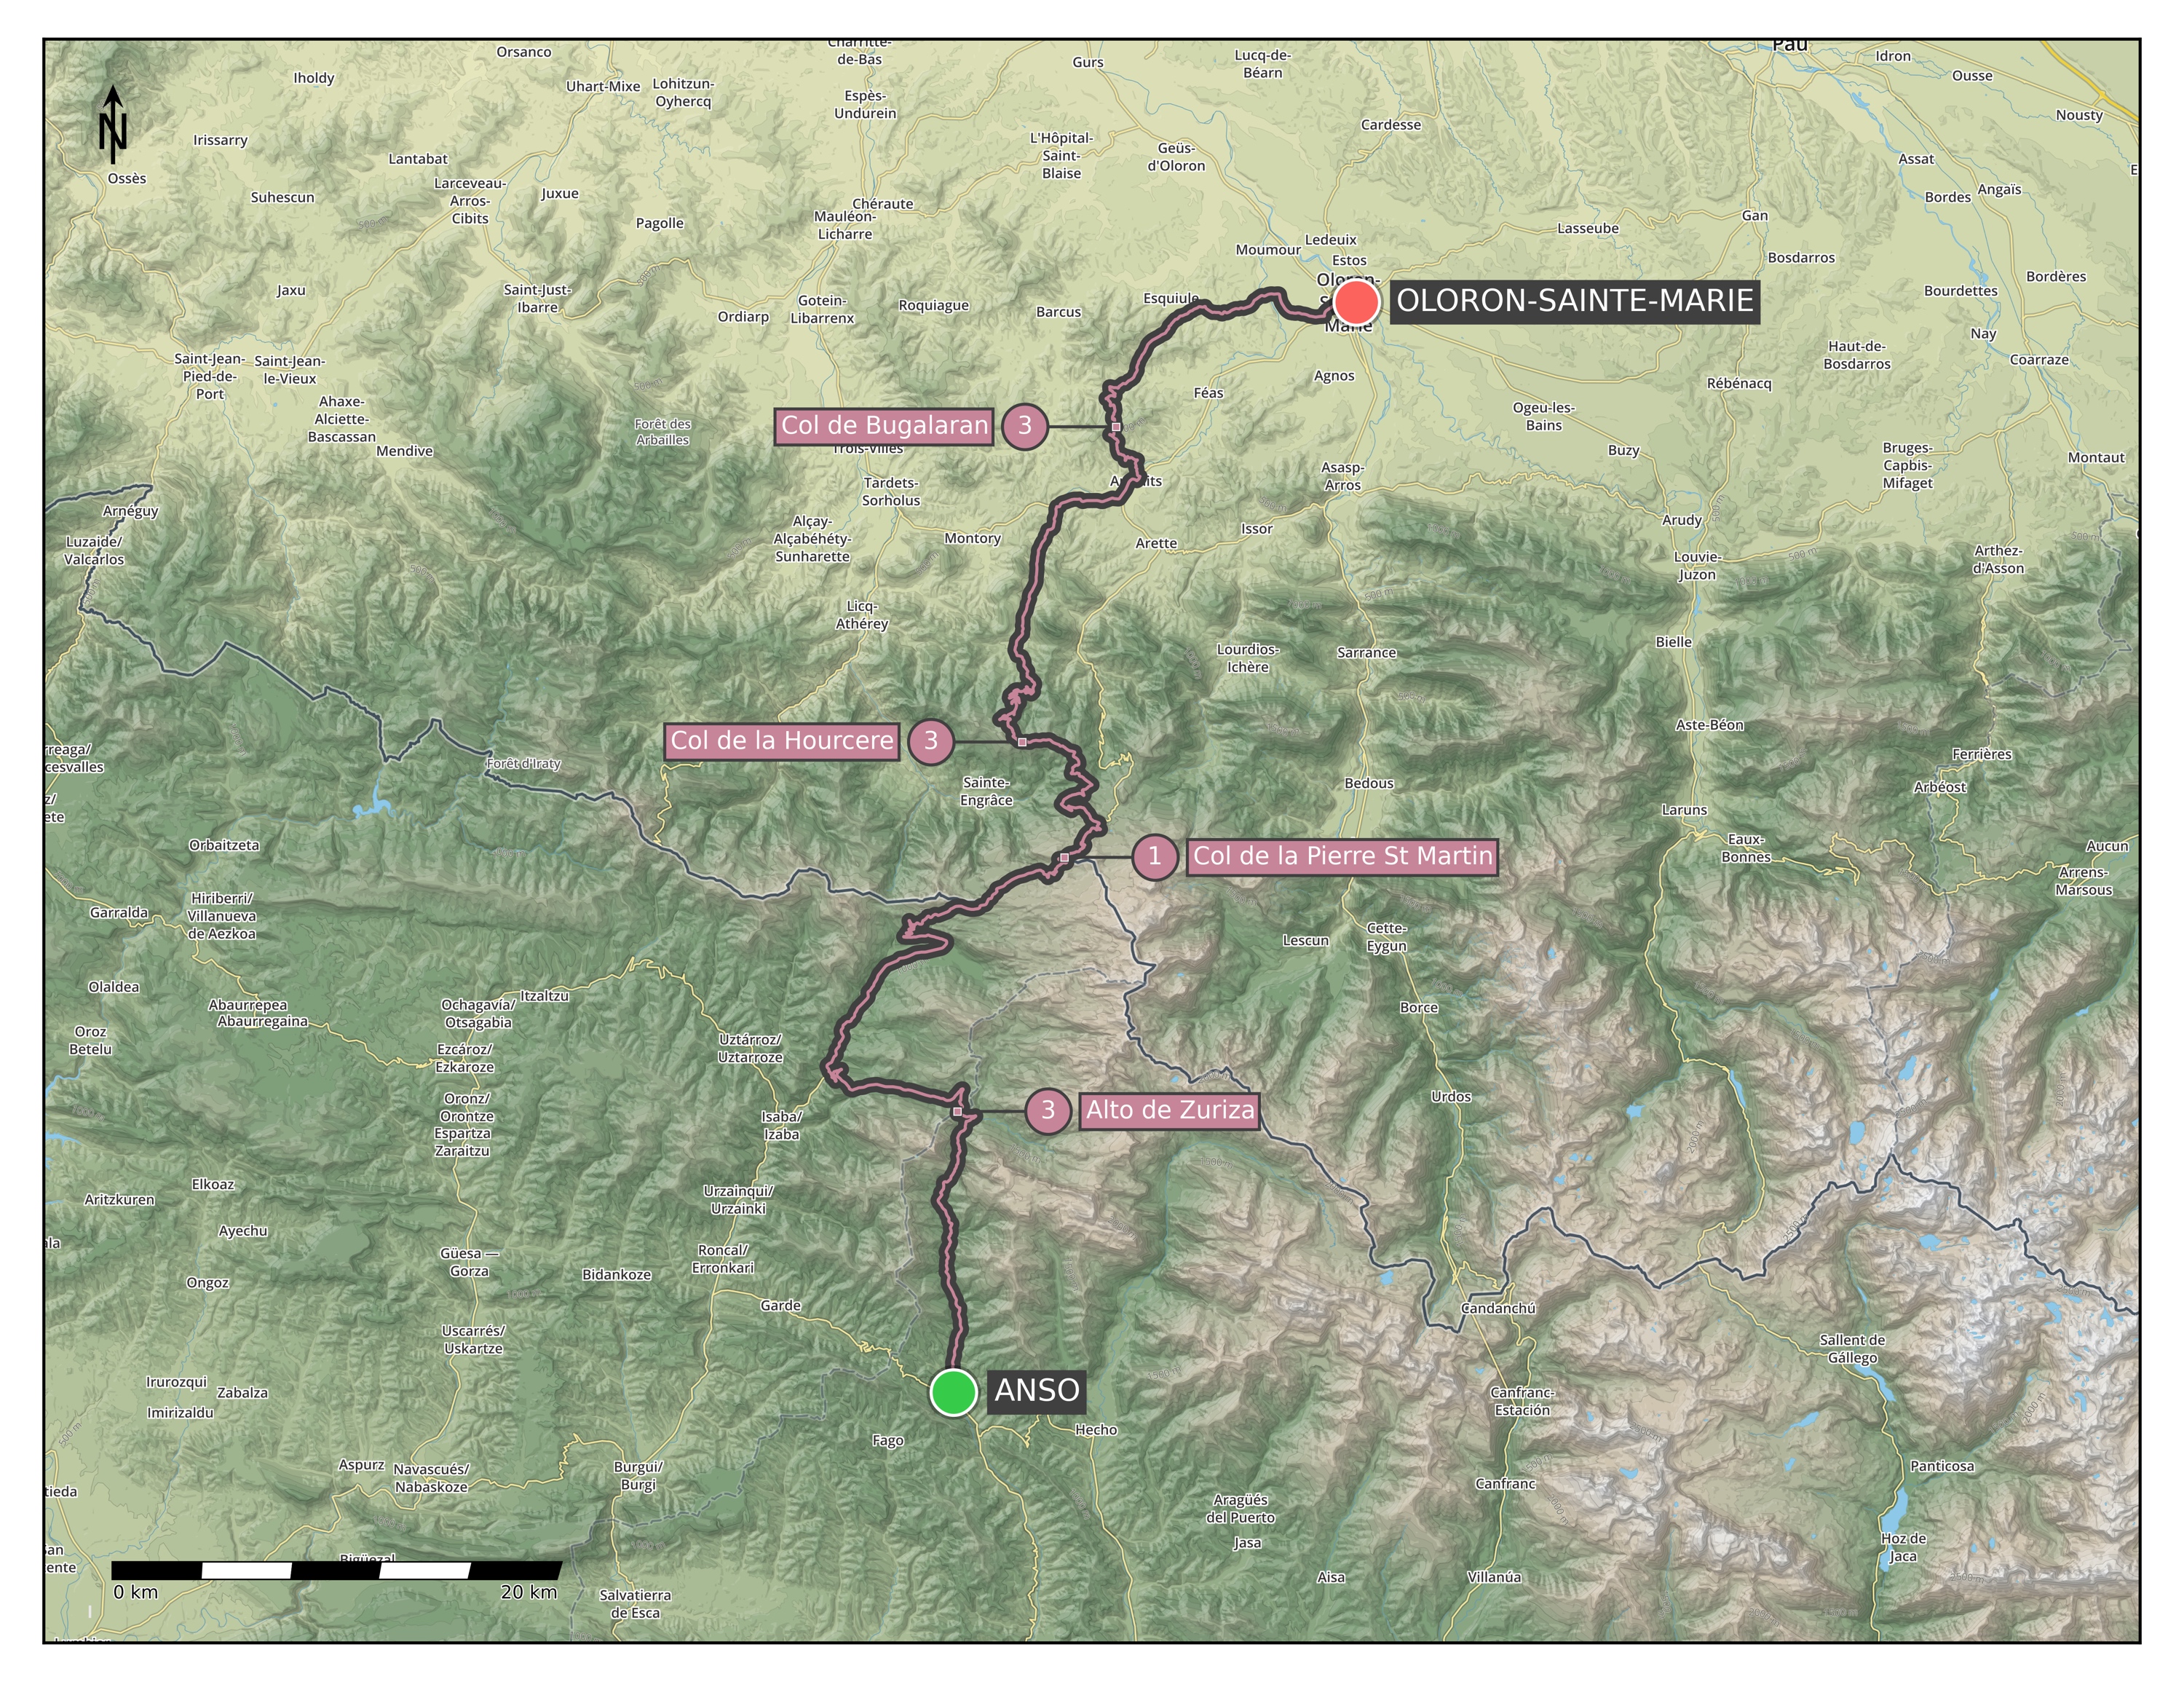
Stage 3) Anso – Oloron-Sainte-Marie: 104 km | 2158 m+ (Map / Profile)
– Alto de Zuriza [1290 m] Cat 3 (13.8 km @ 3.2%)
– Col de la Pierre St Martin [1766 m] Cat 1 (14.3 km @ 5.3%)
– Col de la Hourcère [1440 m] Cat 3 (4.8 km @ 4.5%)
– Col de Bugalaran [498 m] Cat 3 (3.3 km @ 6.9%) - June 14:
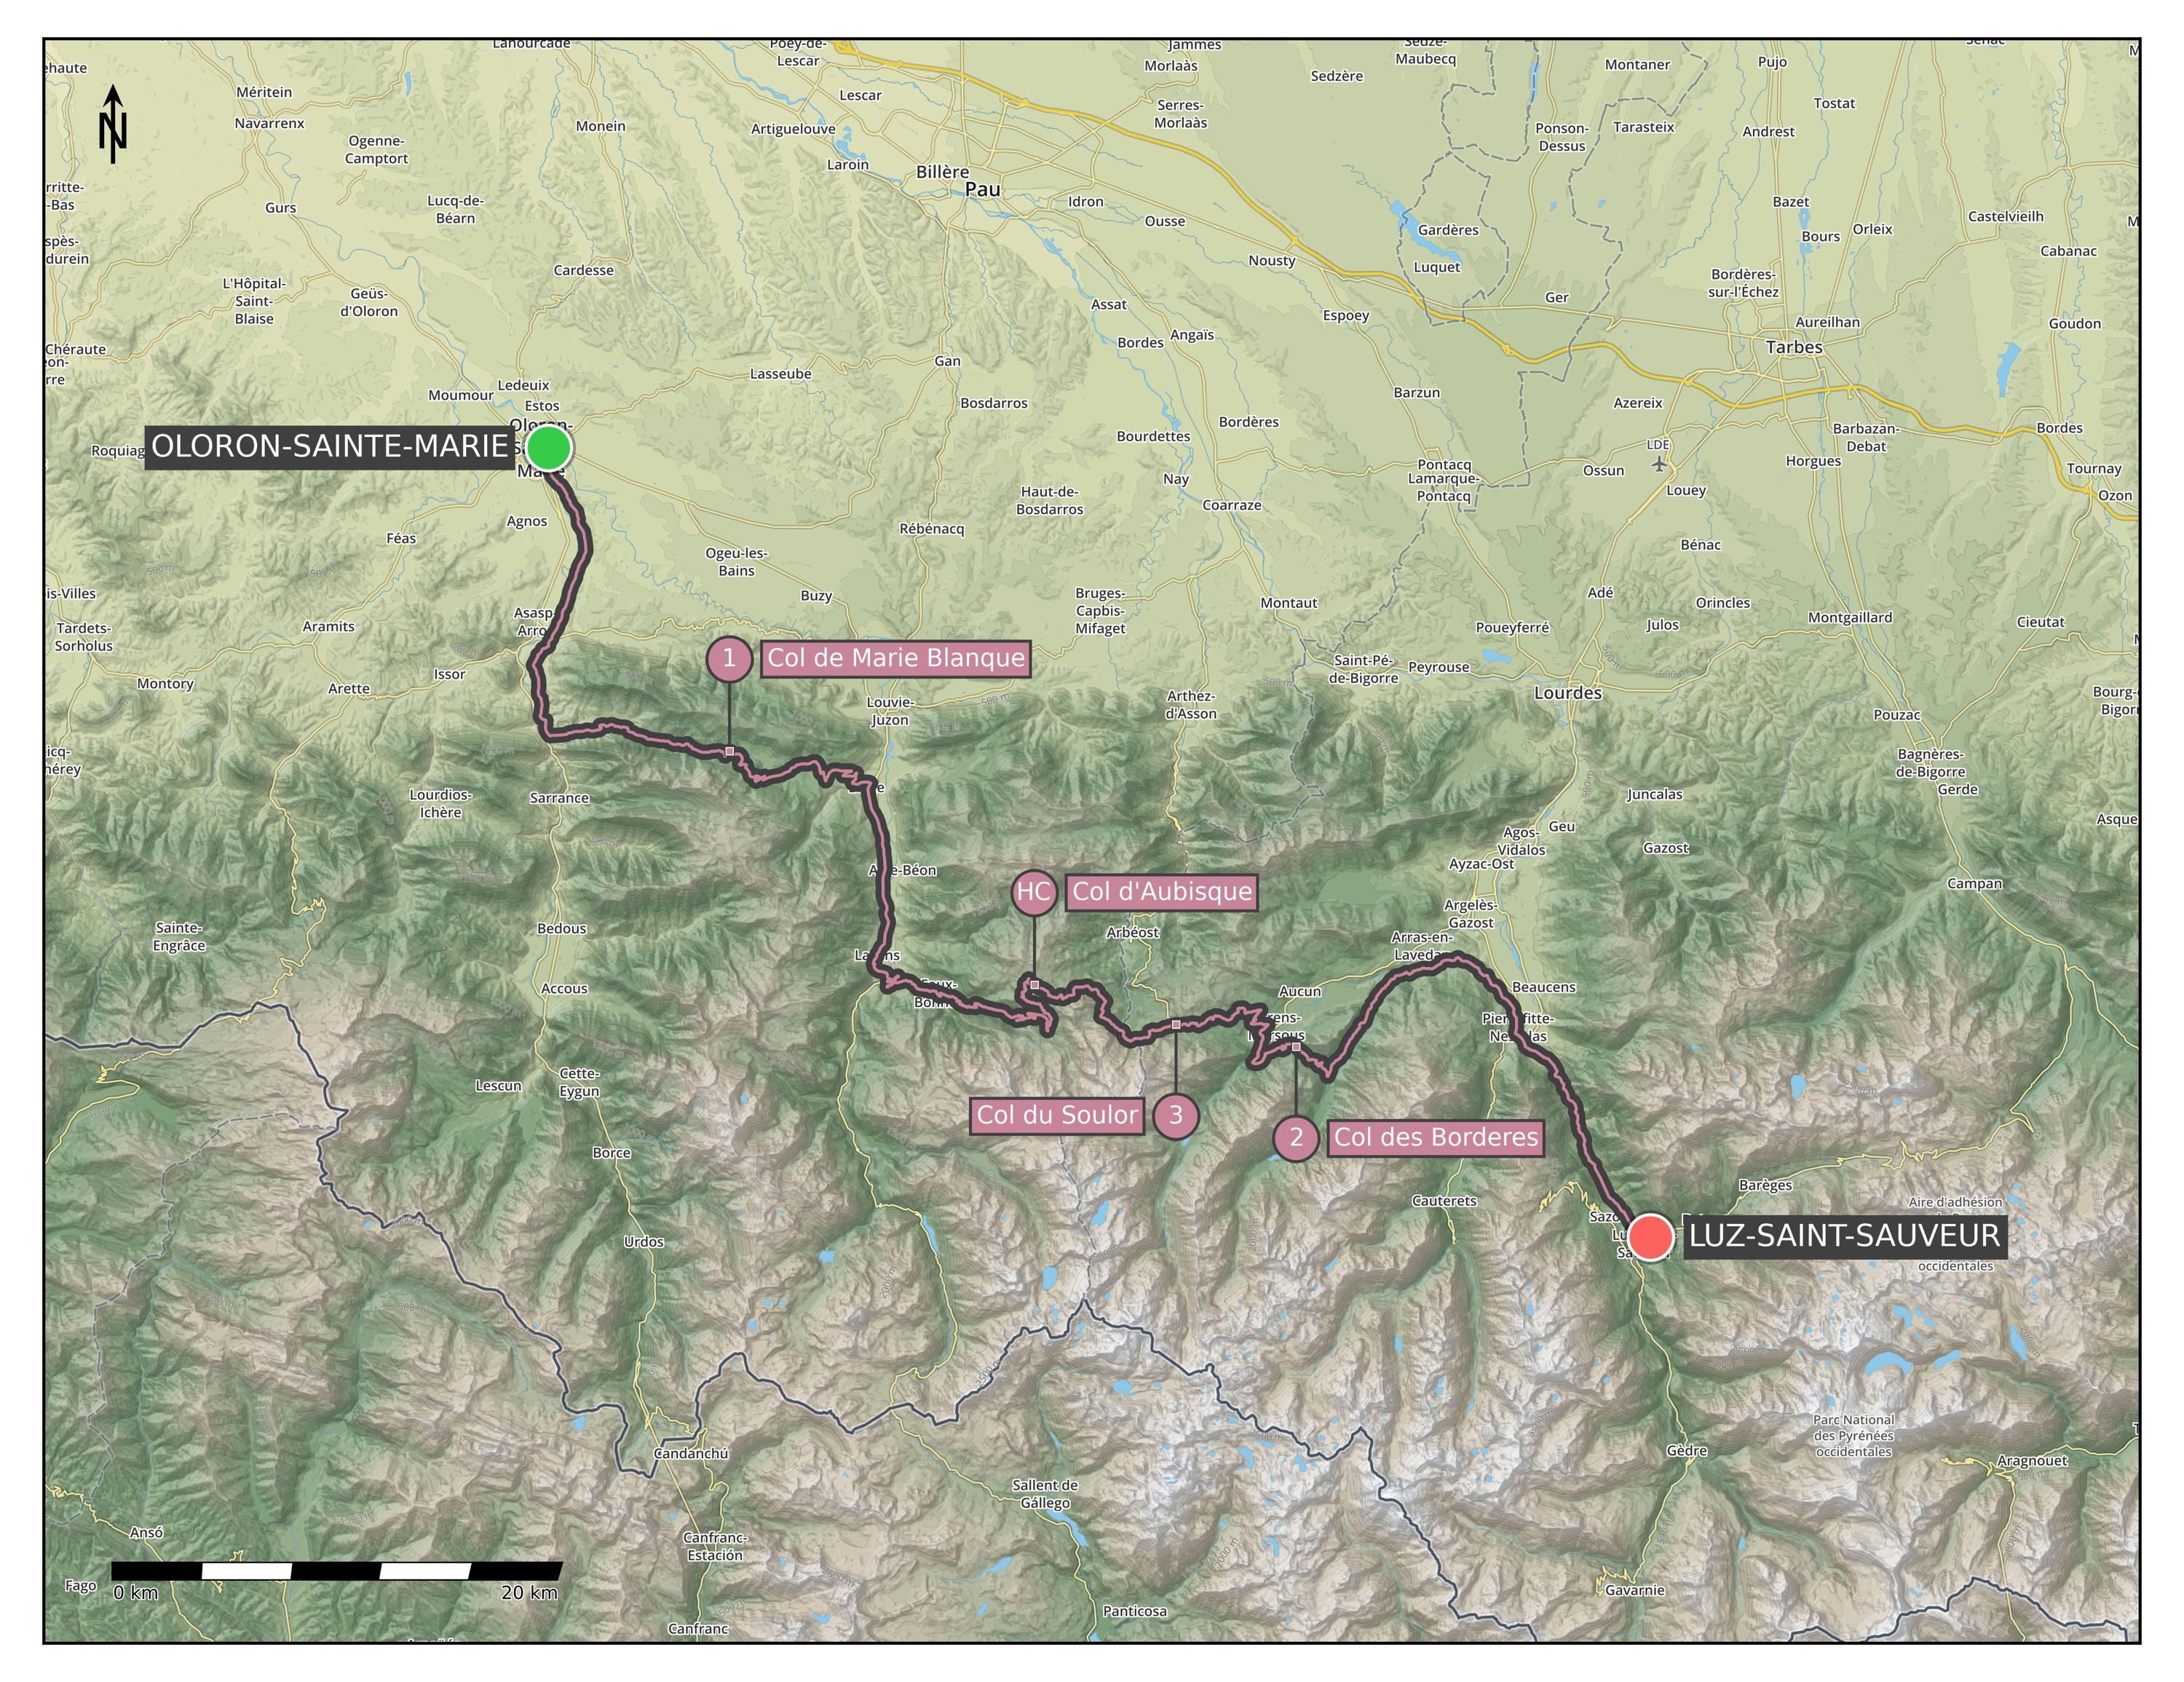
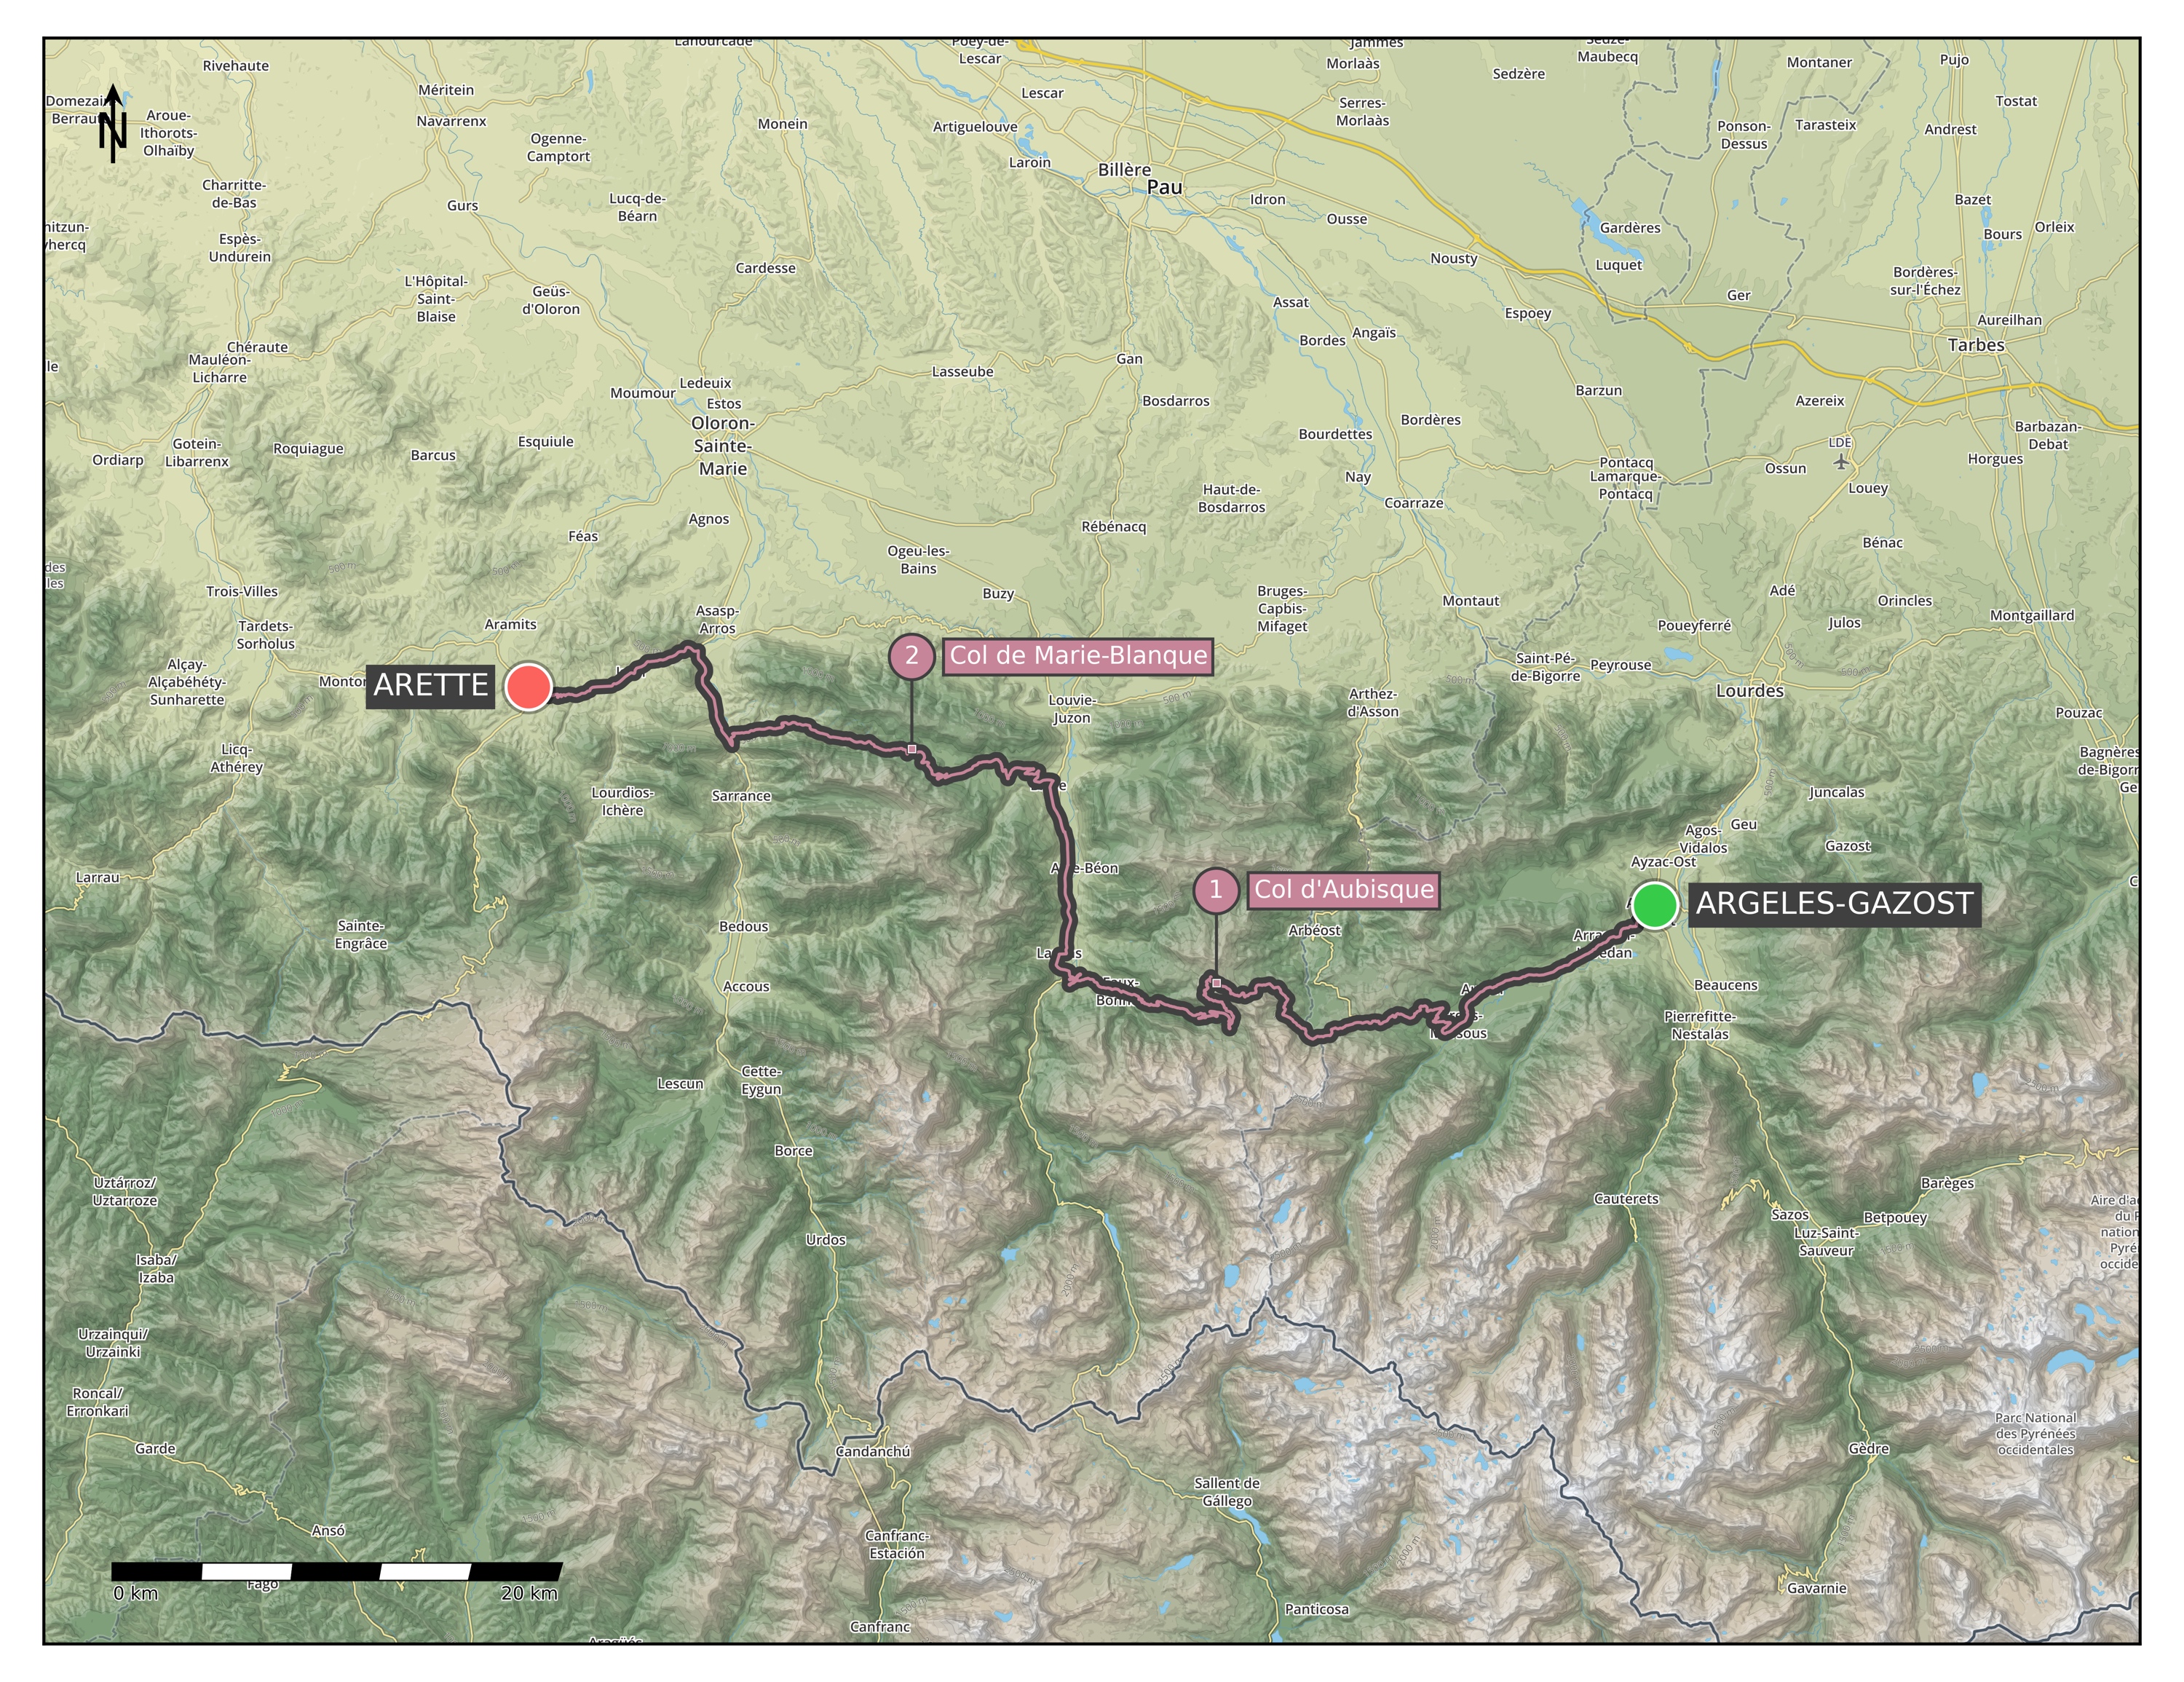
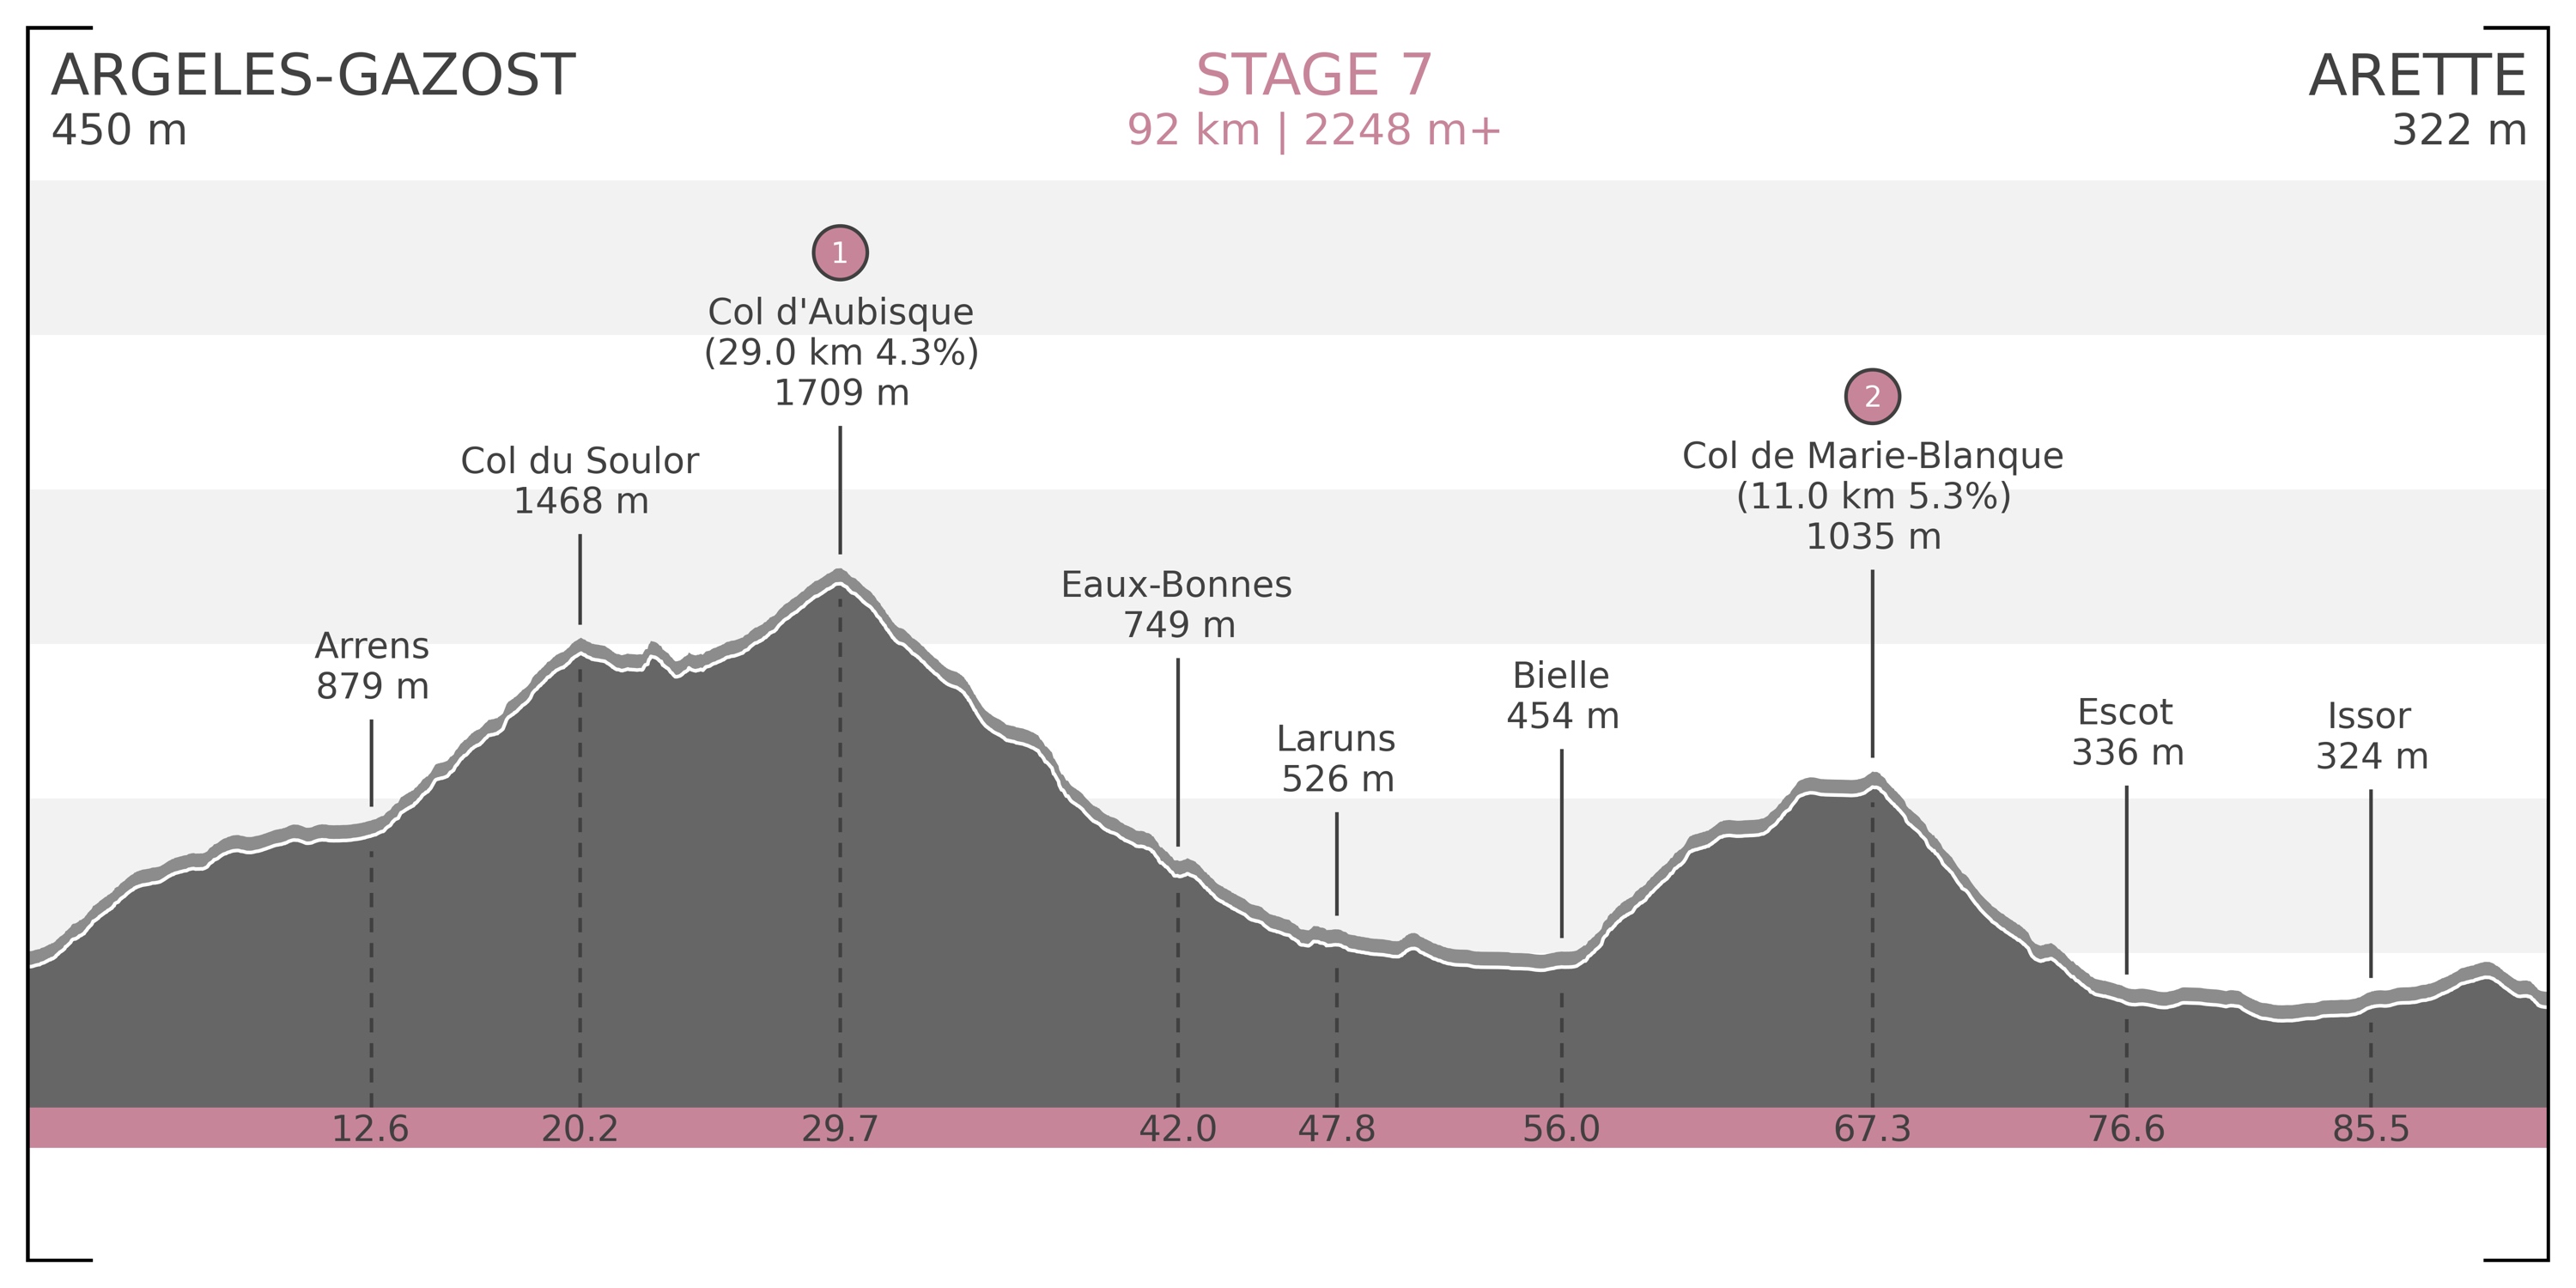
Stage 4) Oloron-Sainte-Marie – Luz-Saint-Sauveur: 112 km | 3275 m+ (Map / Profile)
– Col de Marie Blanque [1035 m] Cat 1 (9.1 km @ 7.8%)
– Col d’Aubisque [1709 m] HC (17.0 km @ 7.0%)
– Col du Soulor [1474 m] Cat 3 (1.9 km @ 5.0%)
– Col des Bordères [1156 m] Cat 2 (4.2 km @ 6.9%) - June 15:
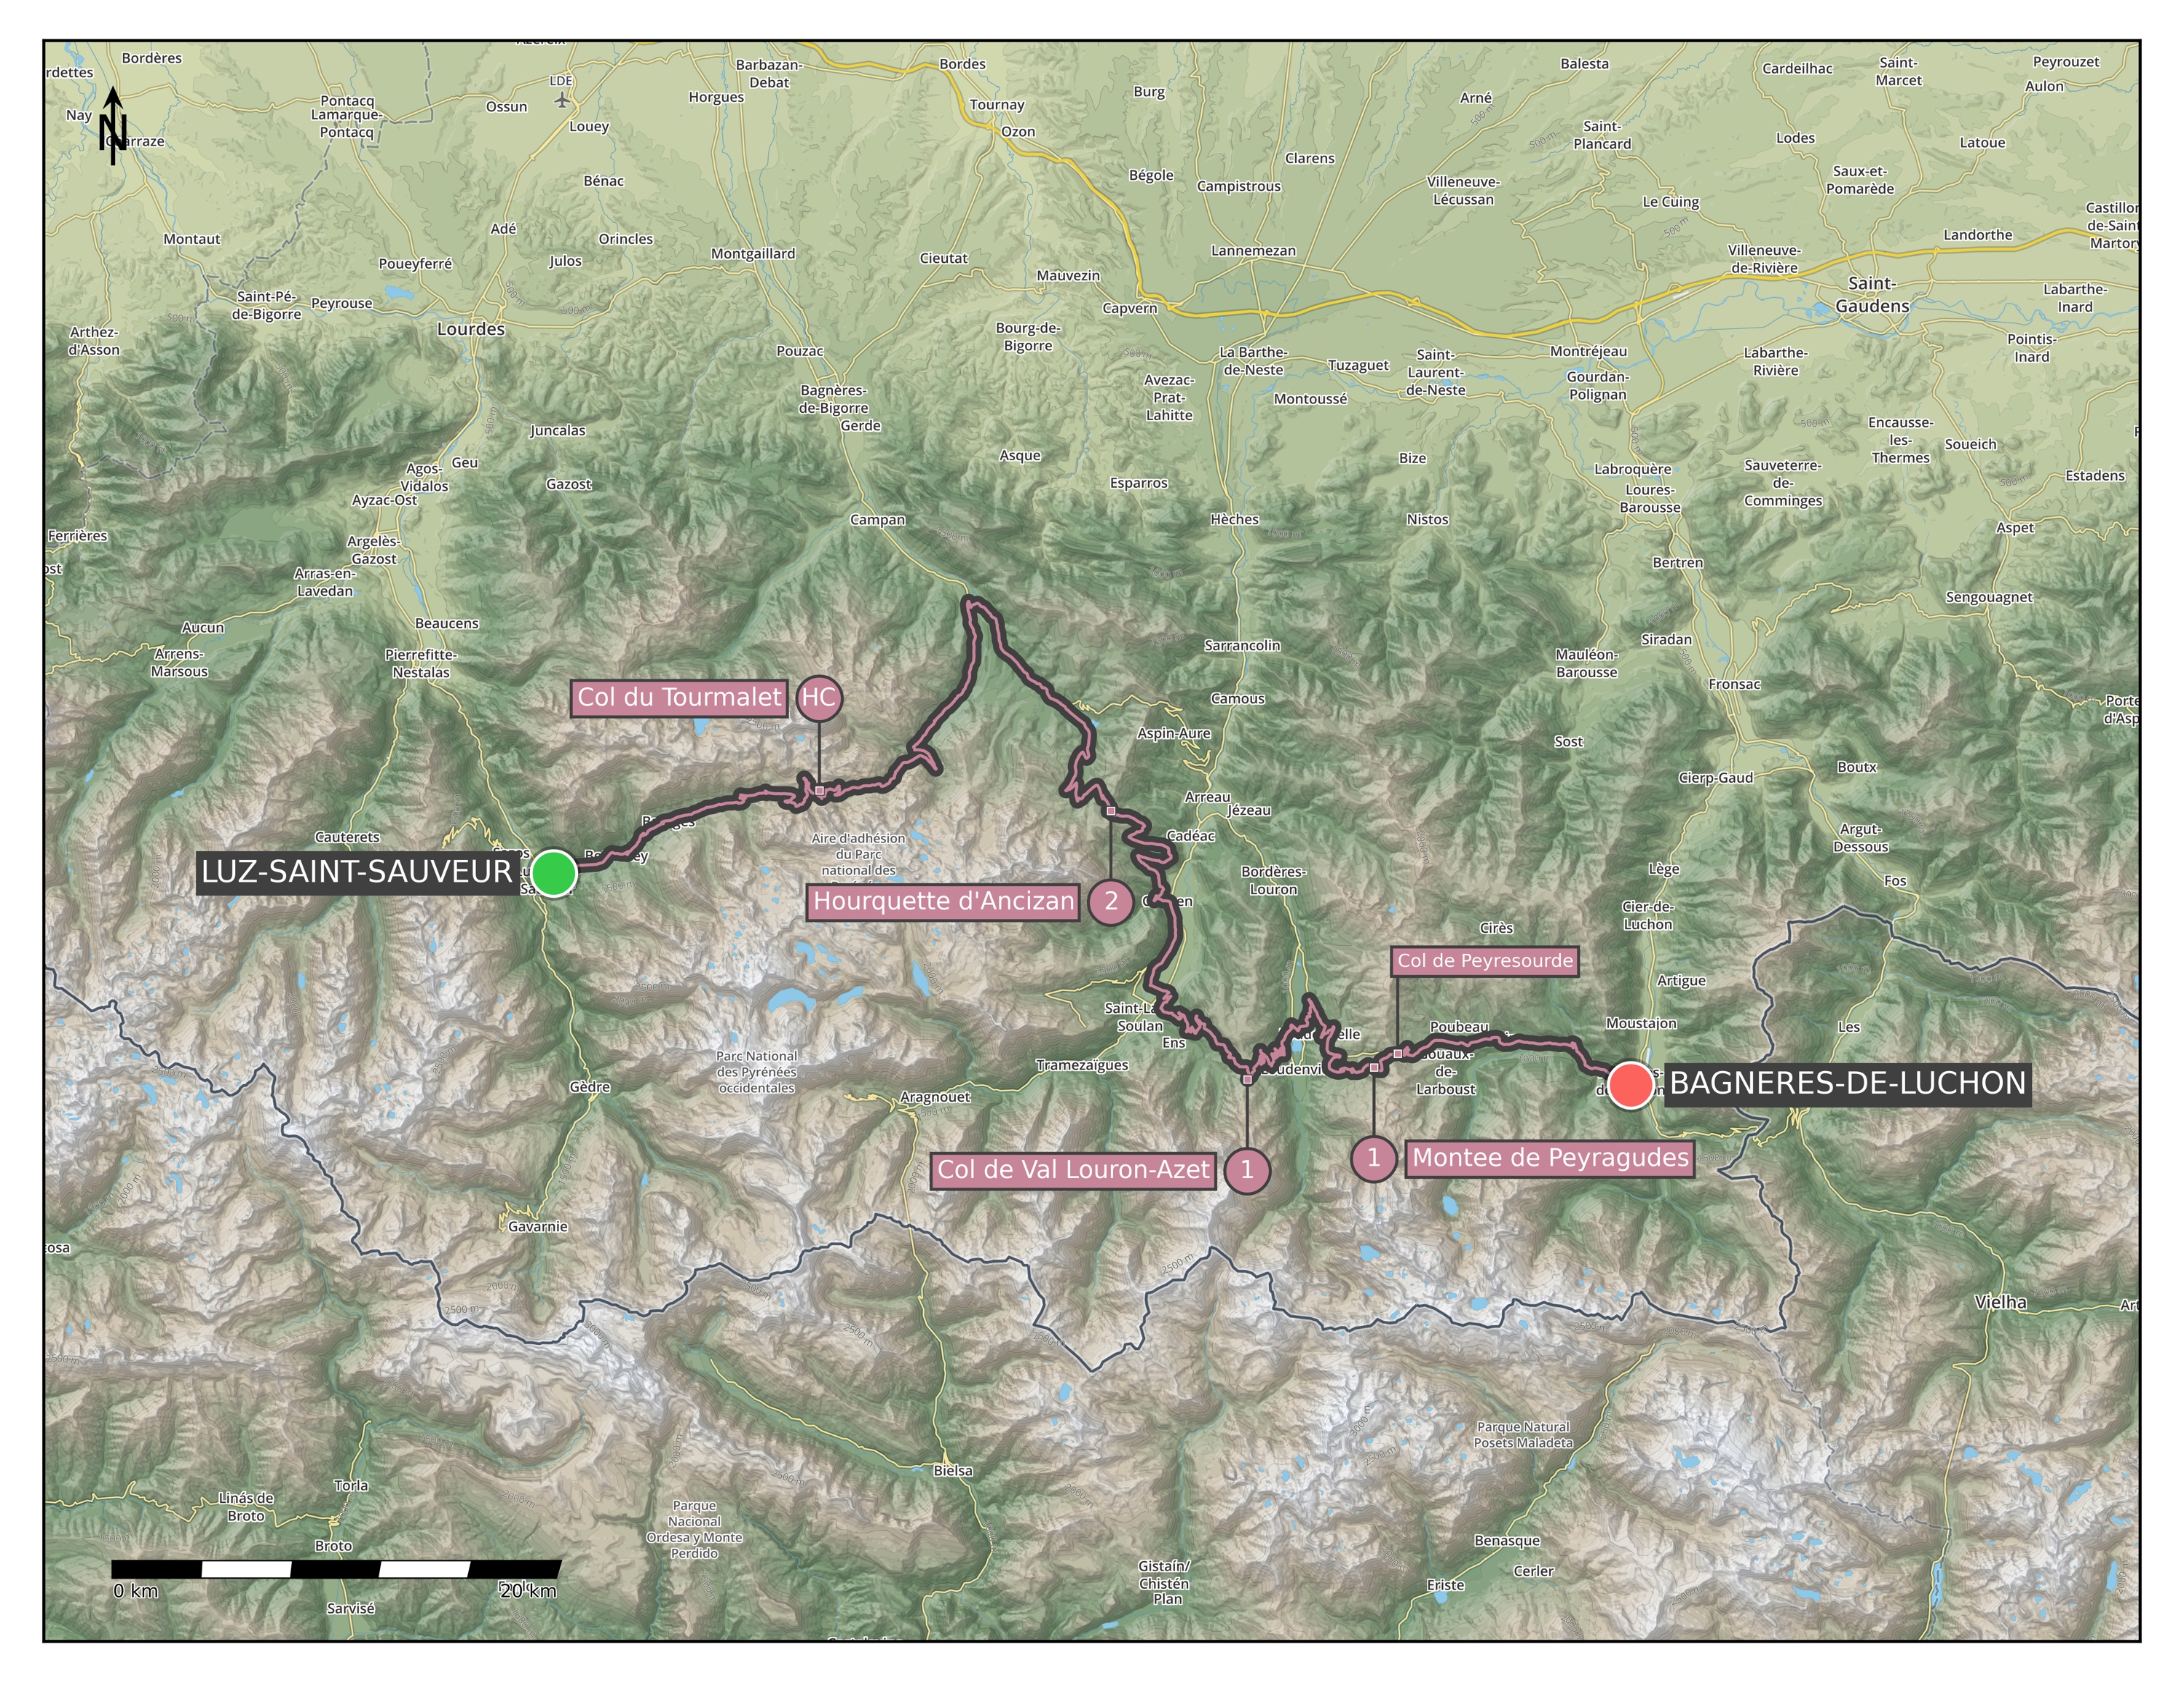
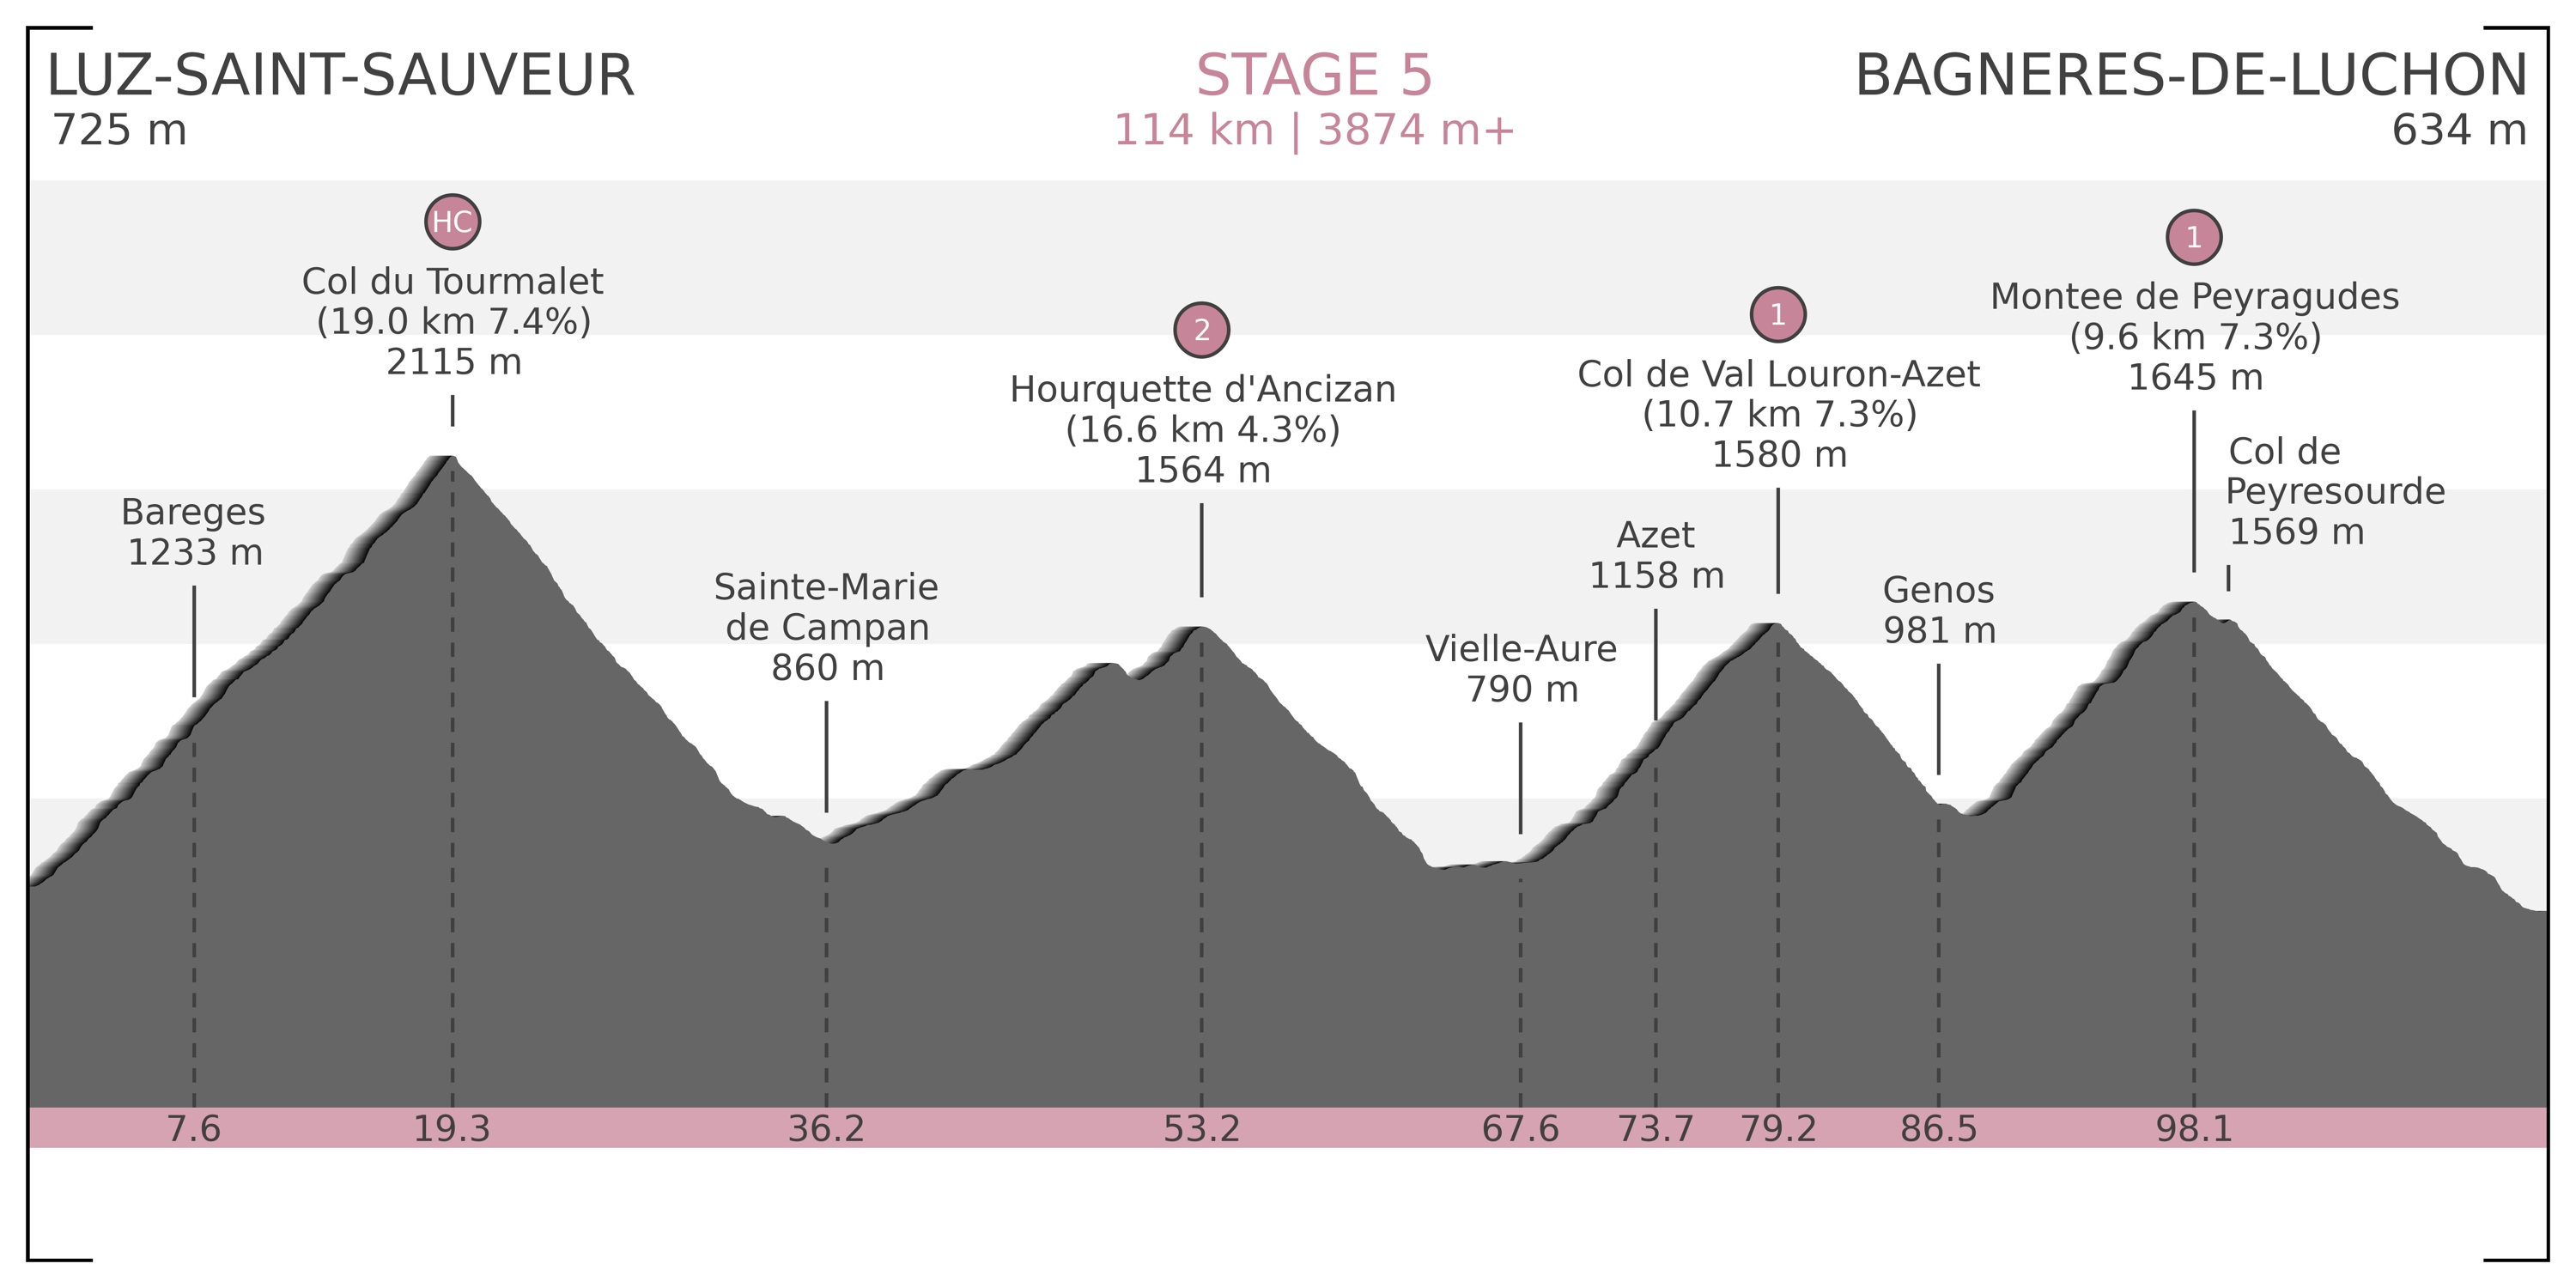
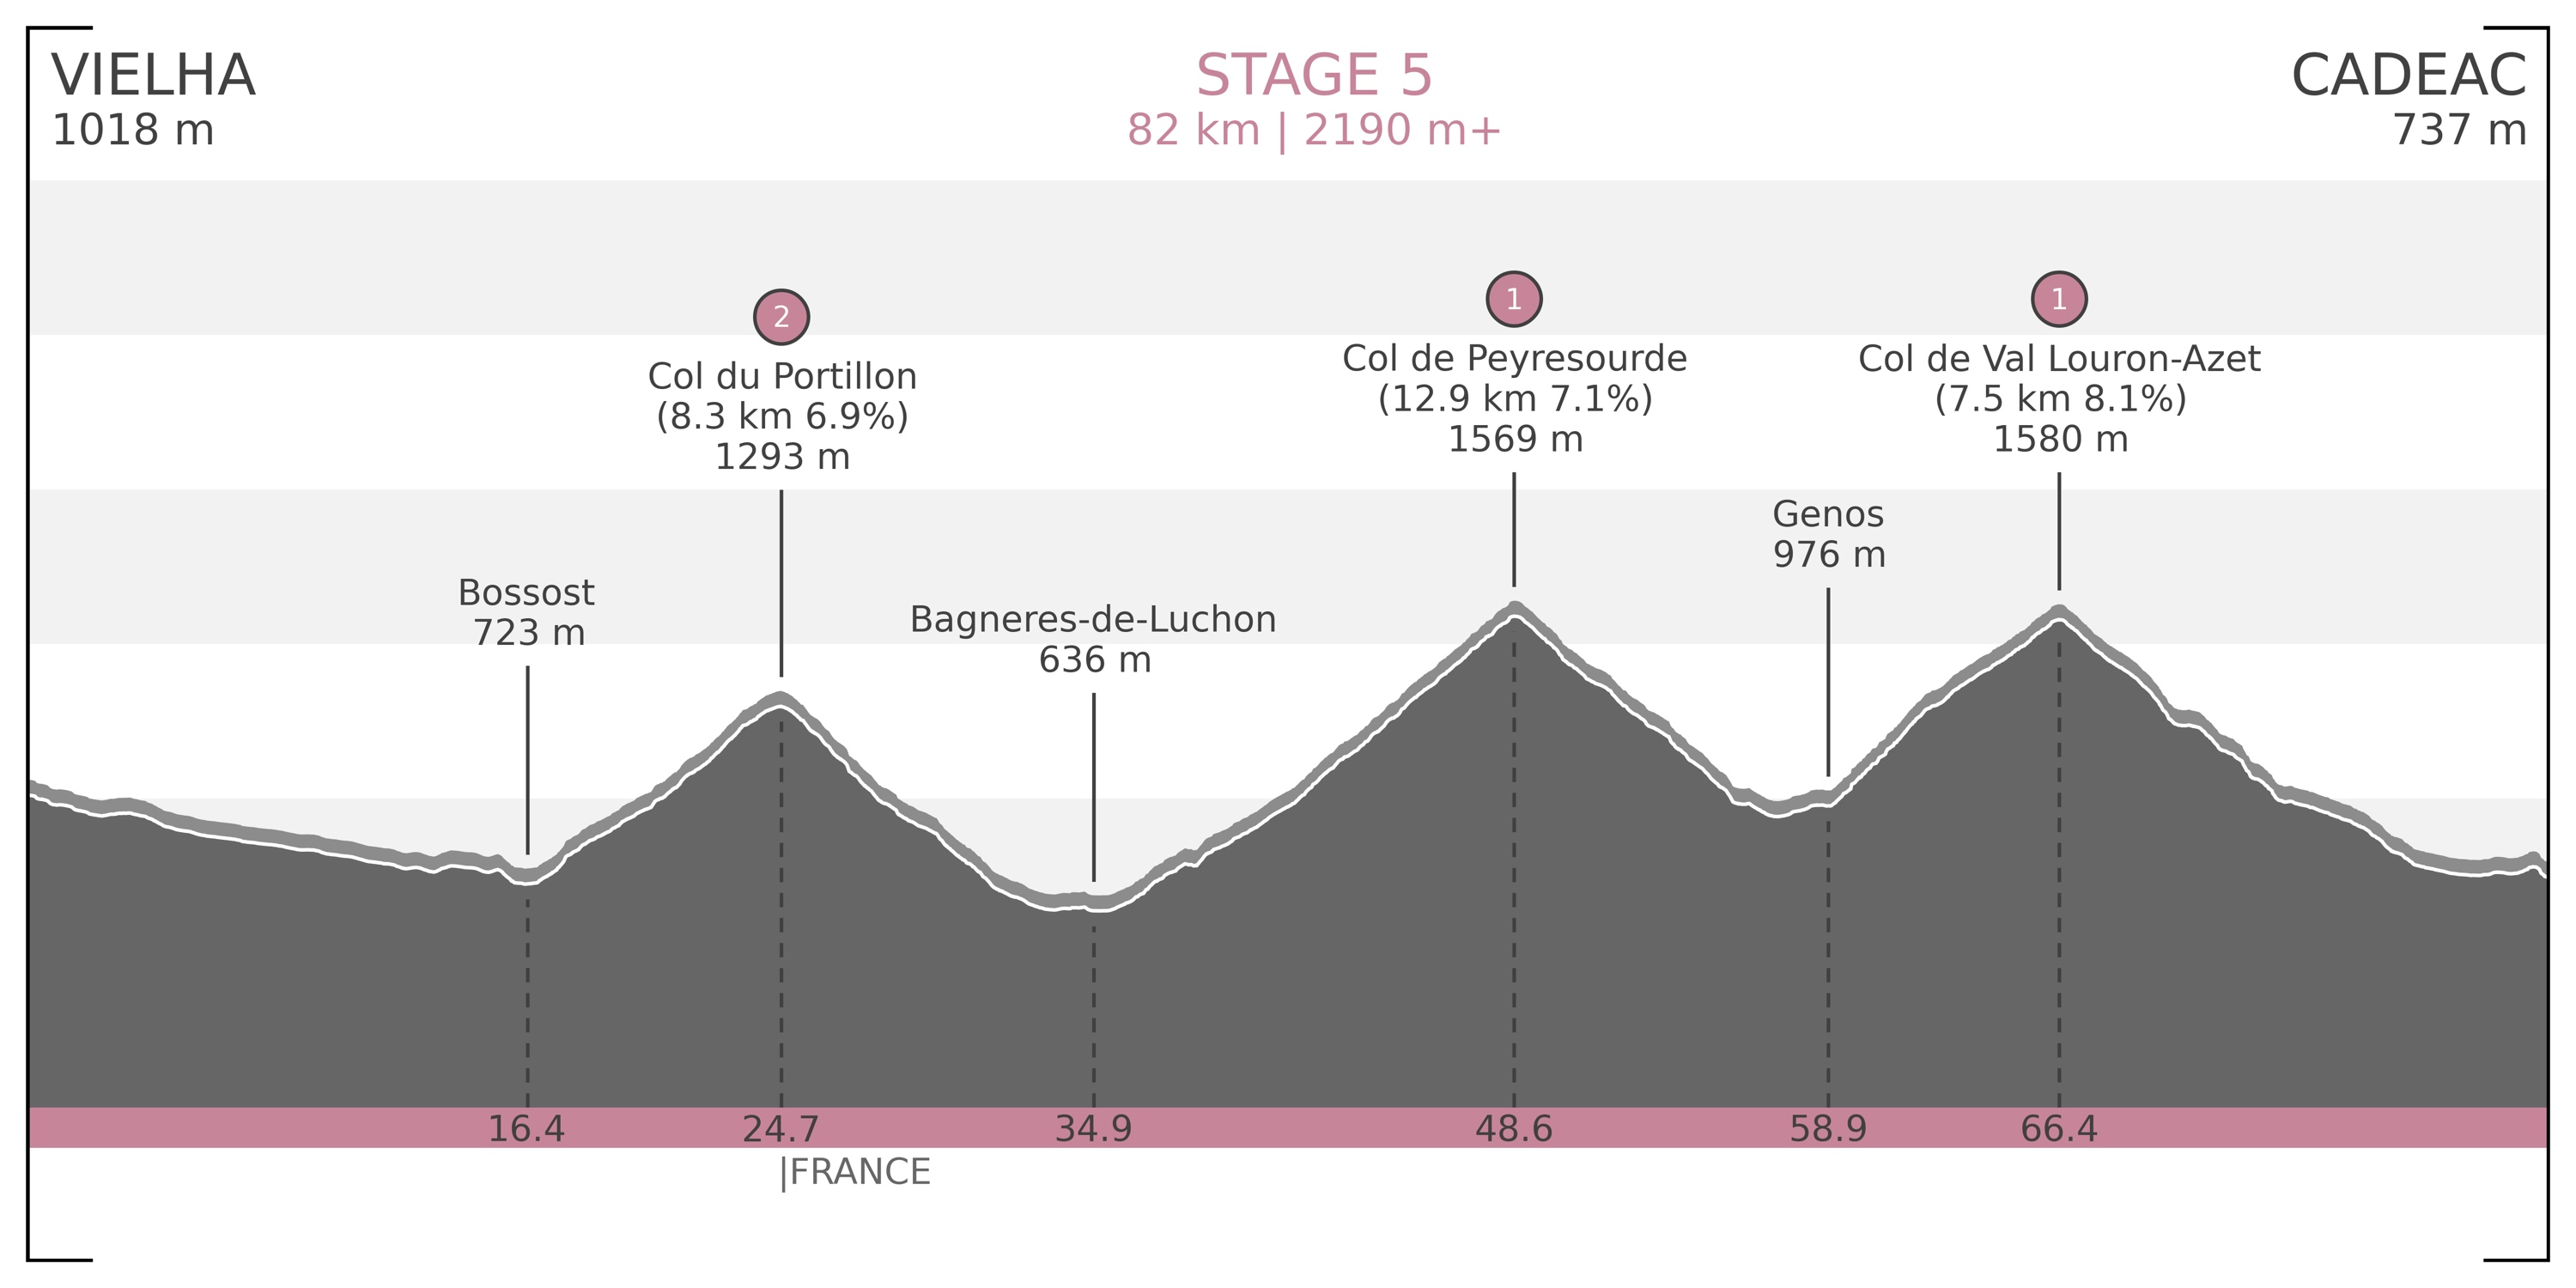
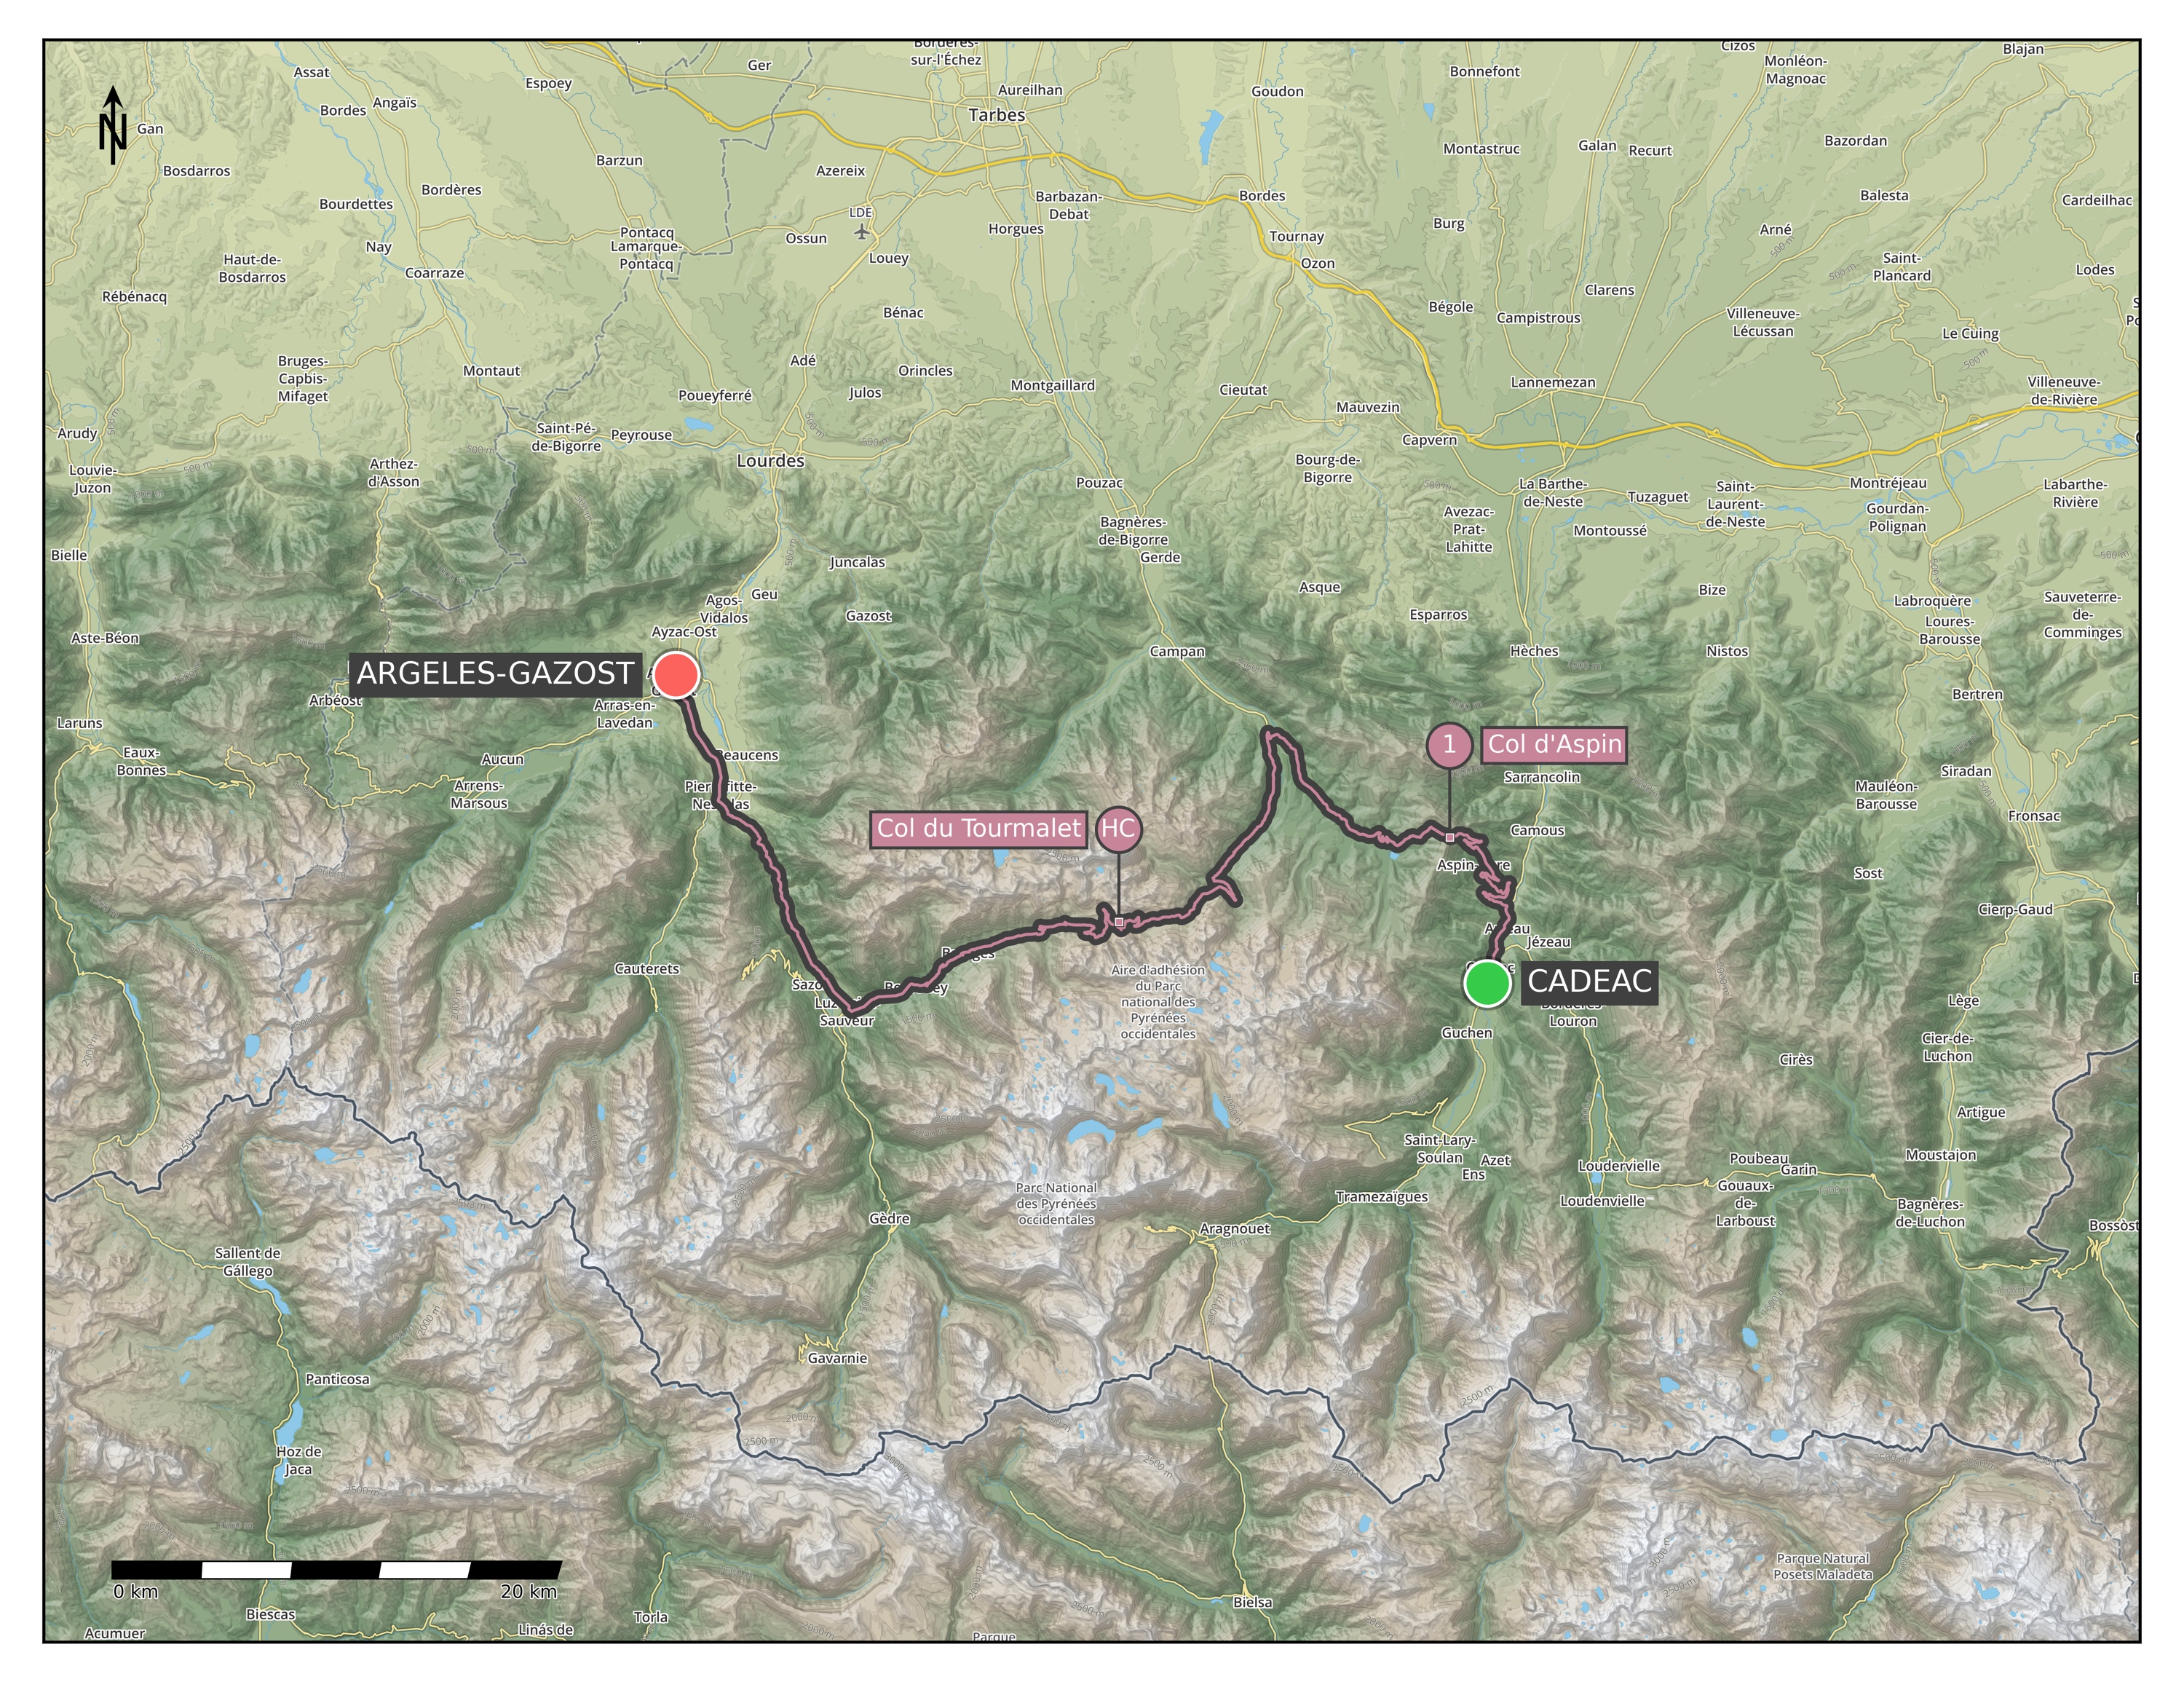
Stage 5) Luz-Saint-Sauveur – Bagnères-de-Luchon ♛: 114 km | 3874 m+ (Map / Profile)
– Col du Tourmalet [2115 m] HC (19.0 km @ 7.4%)
– Hourquette d’Ancizan [1564 m] Cat 2 (16.6 km @ 4.3% – including a short descent)
– Col de Val Louron-Azet [1580 m] Cat 1 (10.7 km @ 7.3%)
– Montée de Peyragudes [1645 m] Cat 1 (9.6 km @ 7.3%)
(- Col de Peyresourde [1569 m] practically in the descent) - June 16:
Rest day: we will probably still bike, something short and flat, to keep the blood flowing and to get the total distance beyond the thousand kilometre mark ;) But the main plan is mostly staying horizontal, and eating as much as possible. - June 17:
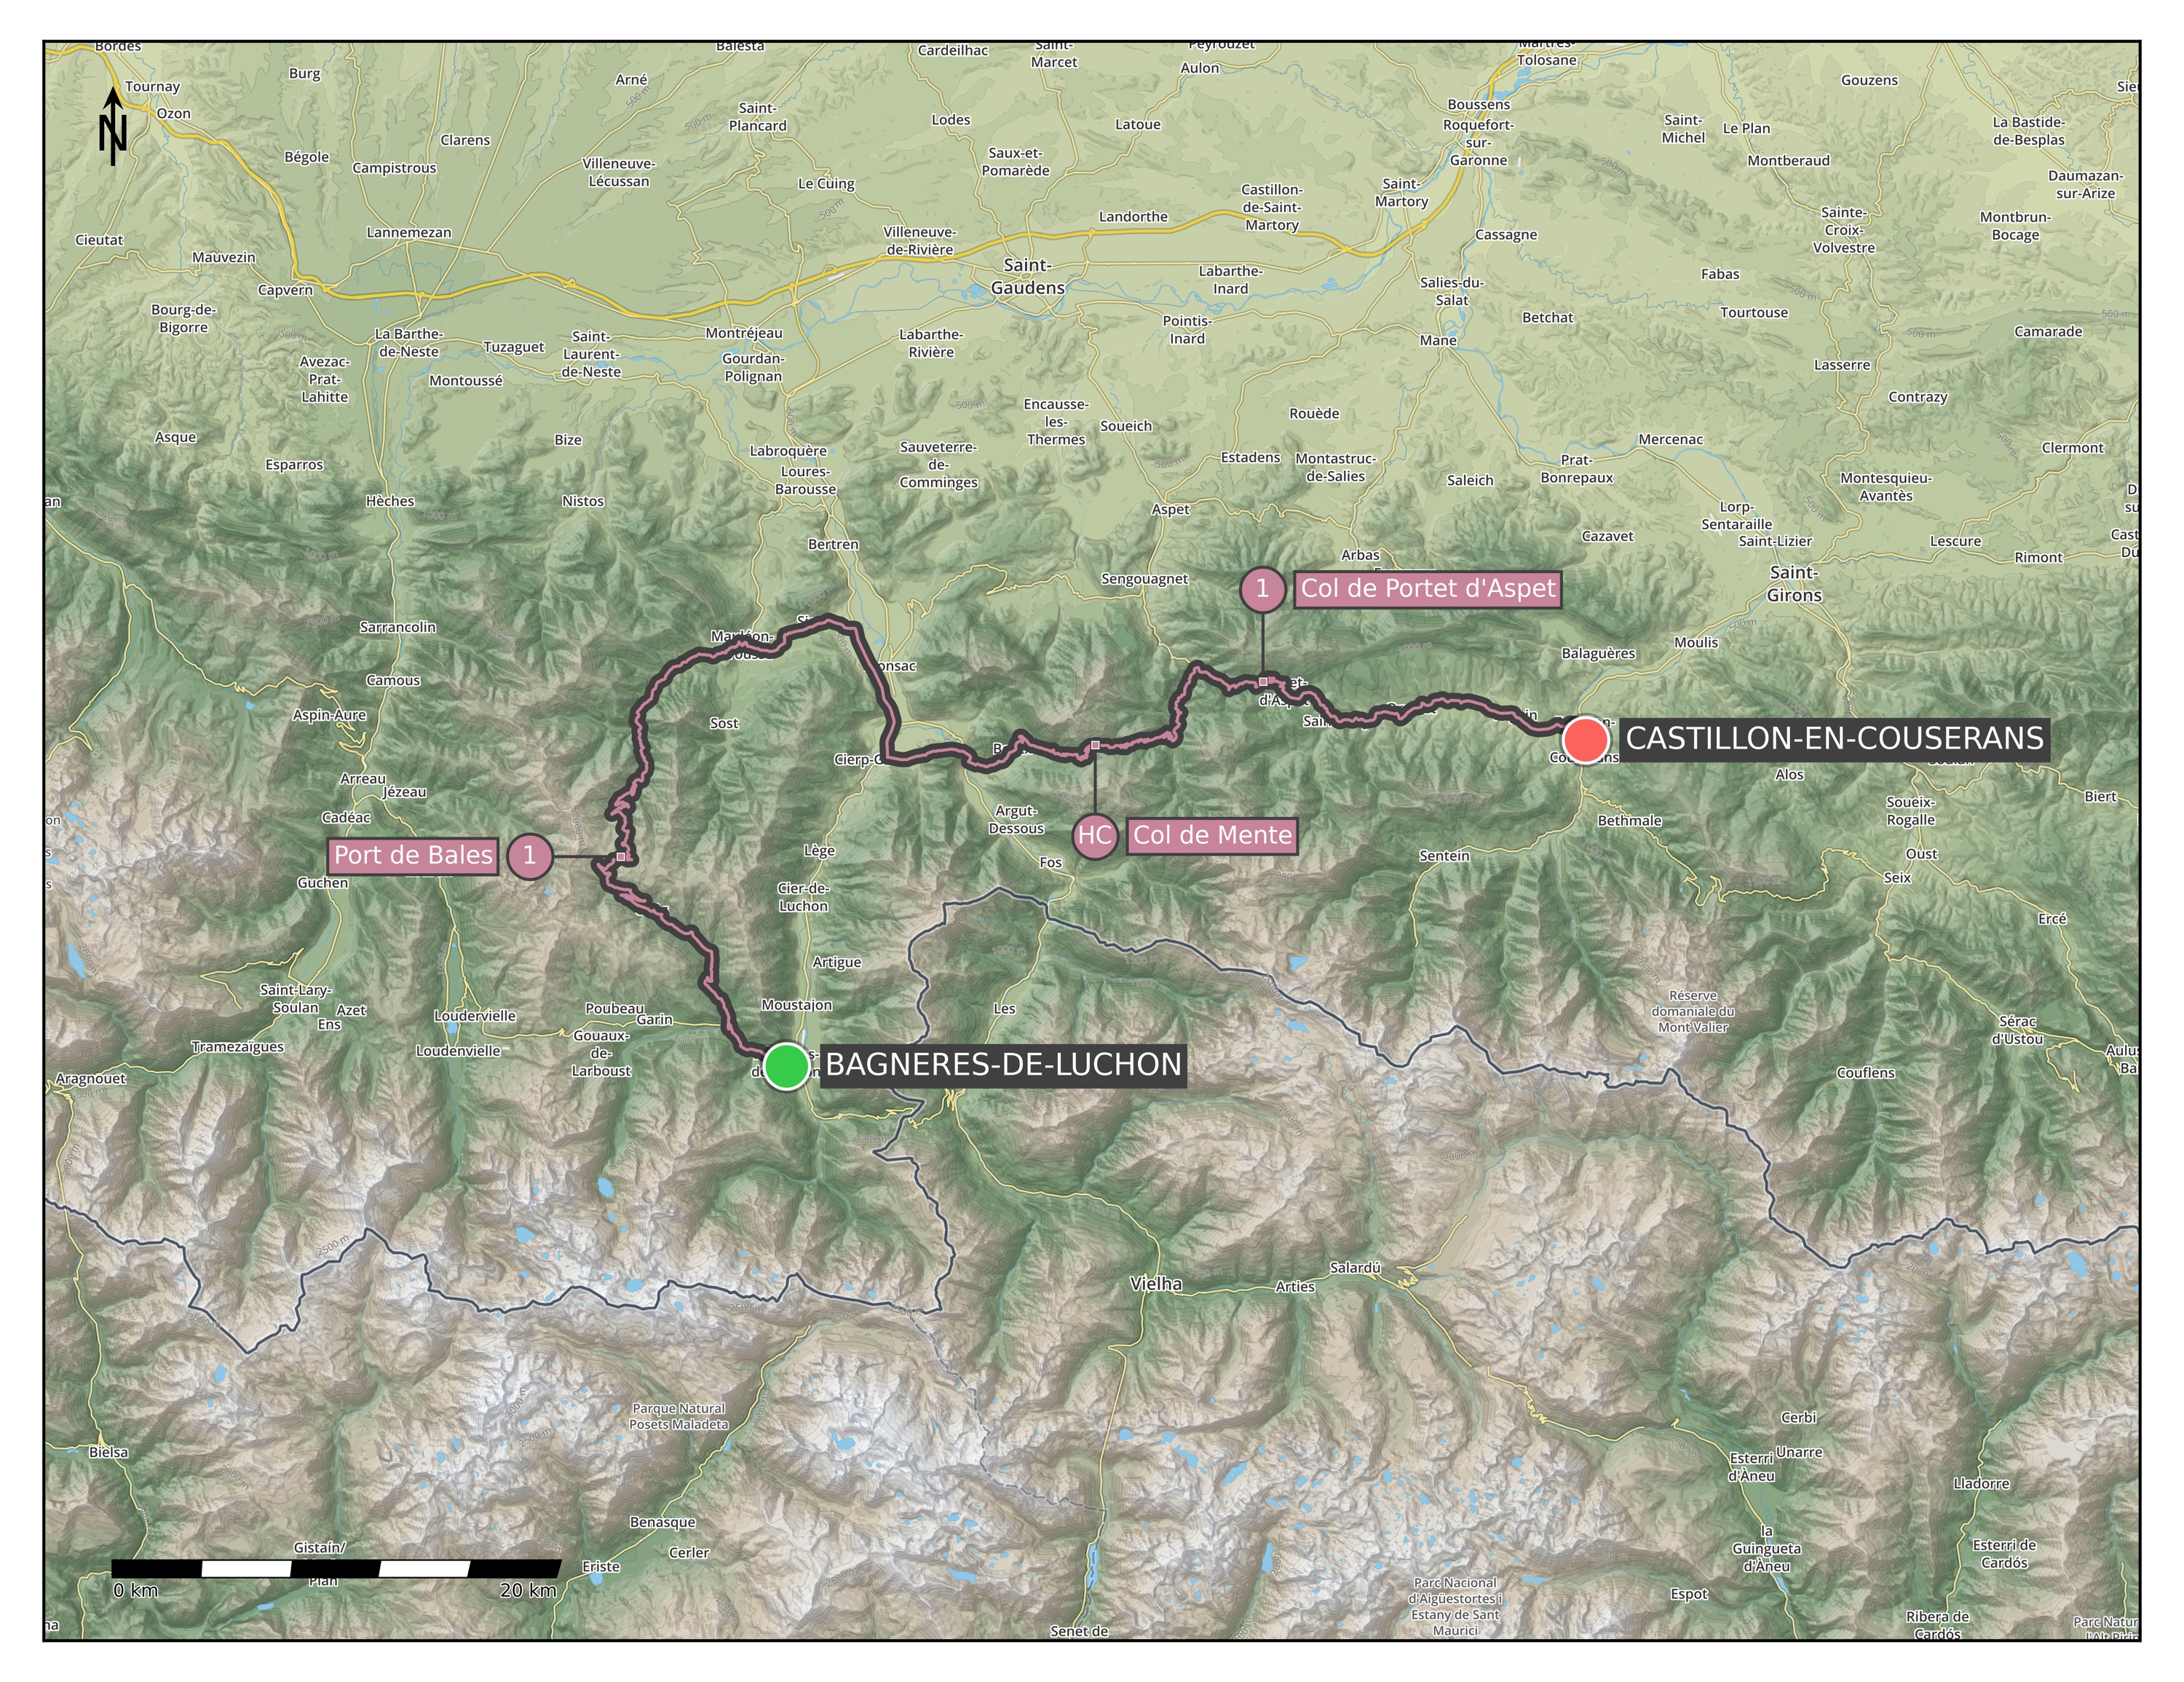
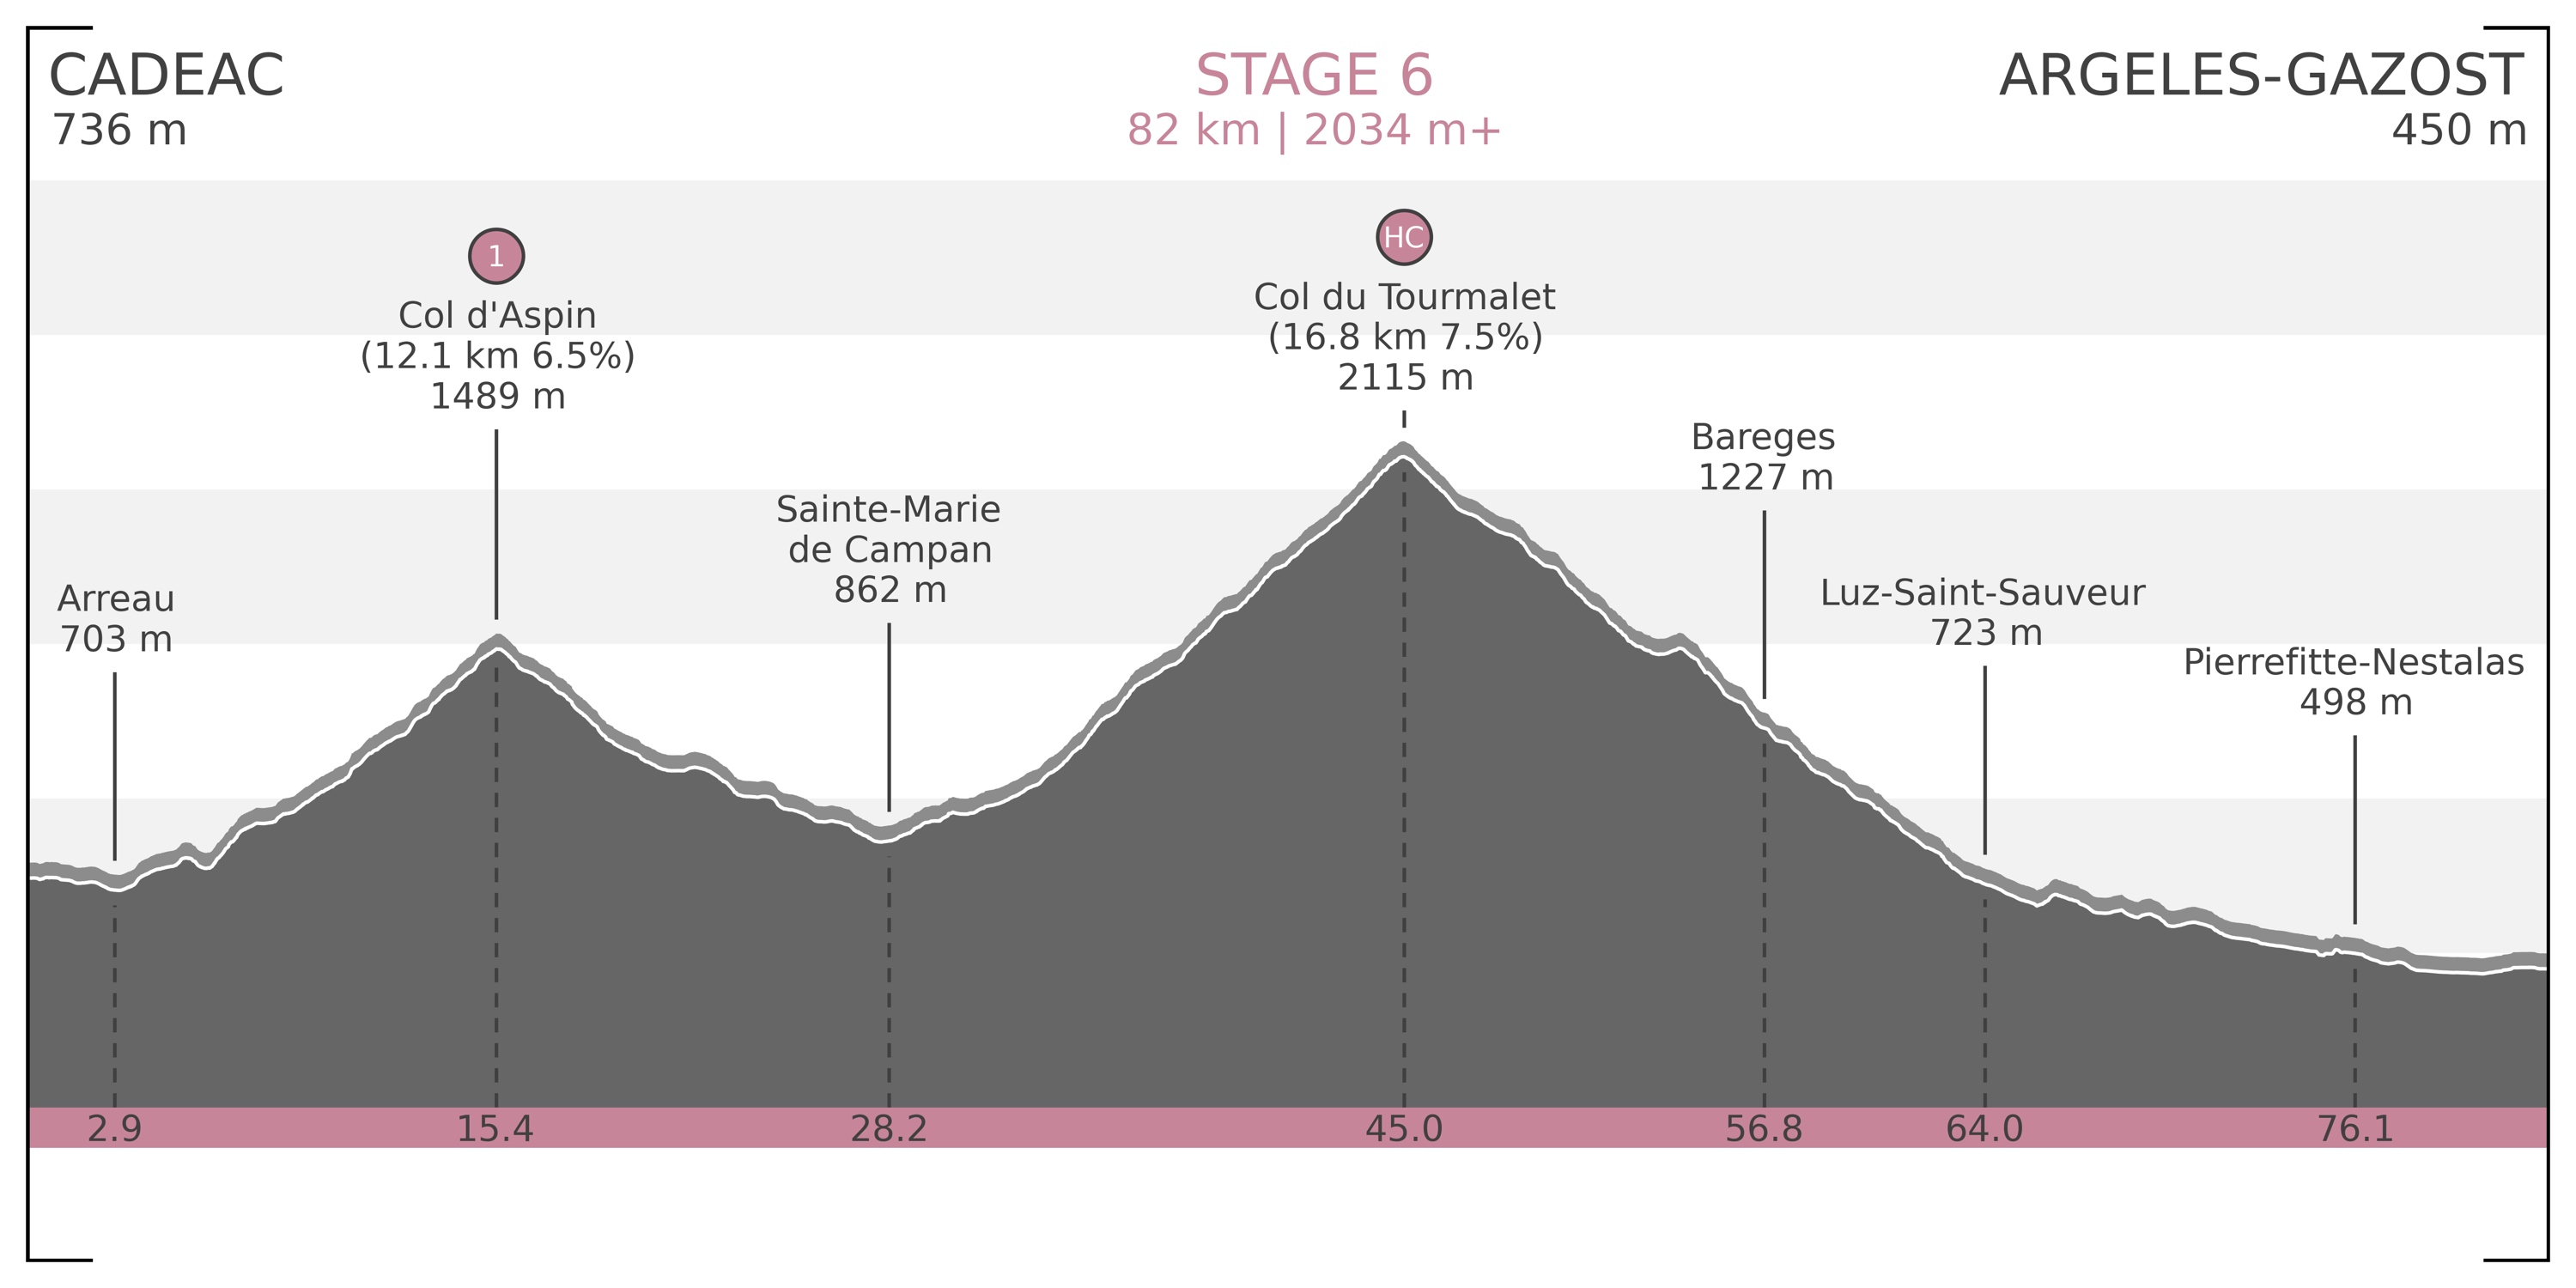
Stage 6) Bagnères-de-Luchon – Castillon-en-Couserans: 100 km | 2775 m+ (Map / Profile)
– Port de Balès [1755 m] Cat 1 (18.8 km @ 5.9%)
– Col de Menté [1349 m] HC (9.3 km @ 9.0%)
– Col de Portet d’Aspet [1069 m] Cat 1 (4.3 km @ 9.5%) - June 18:
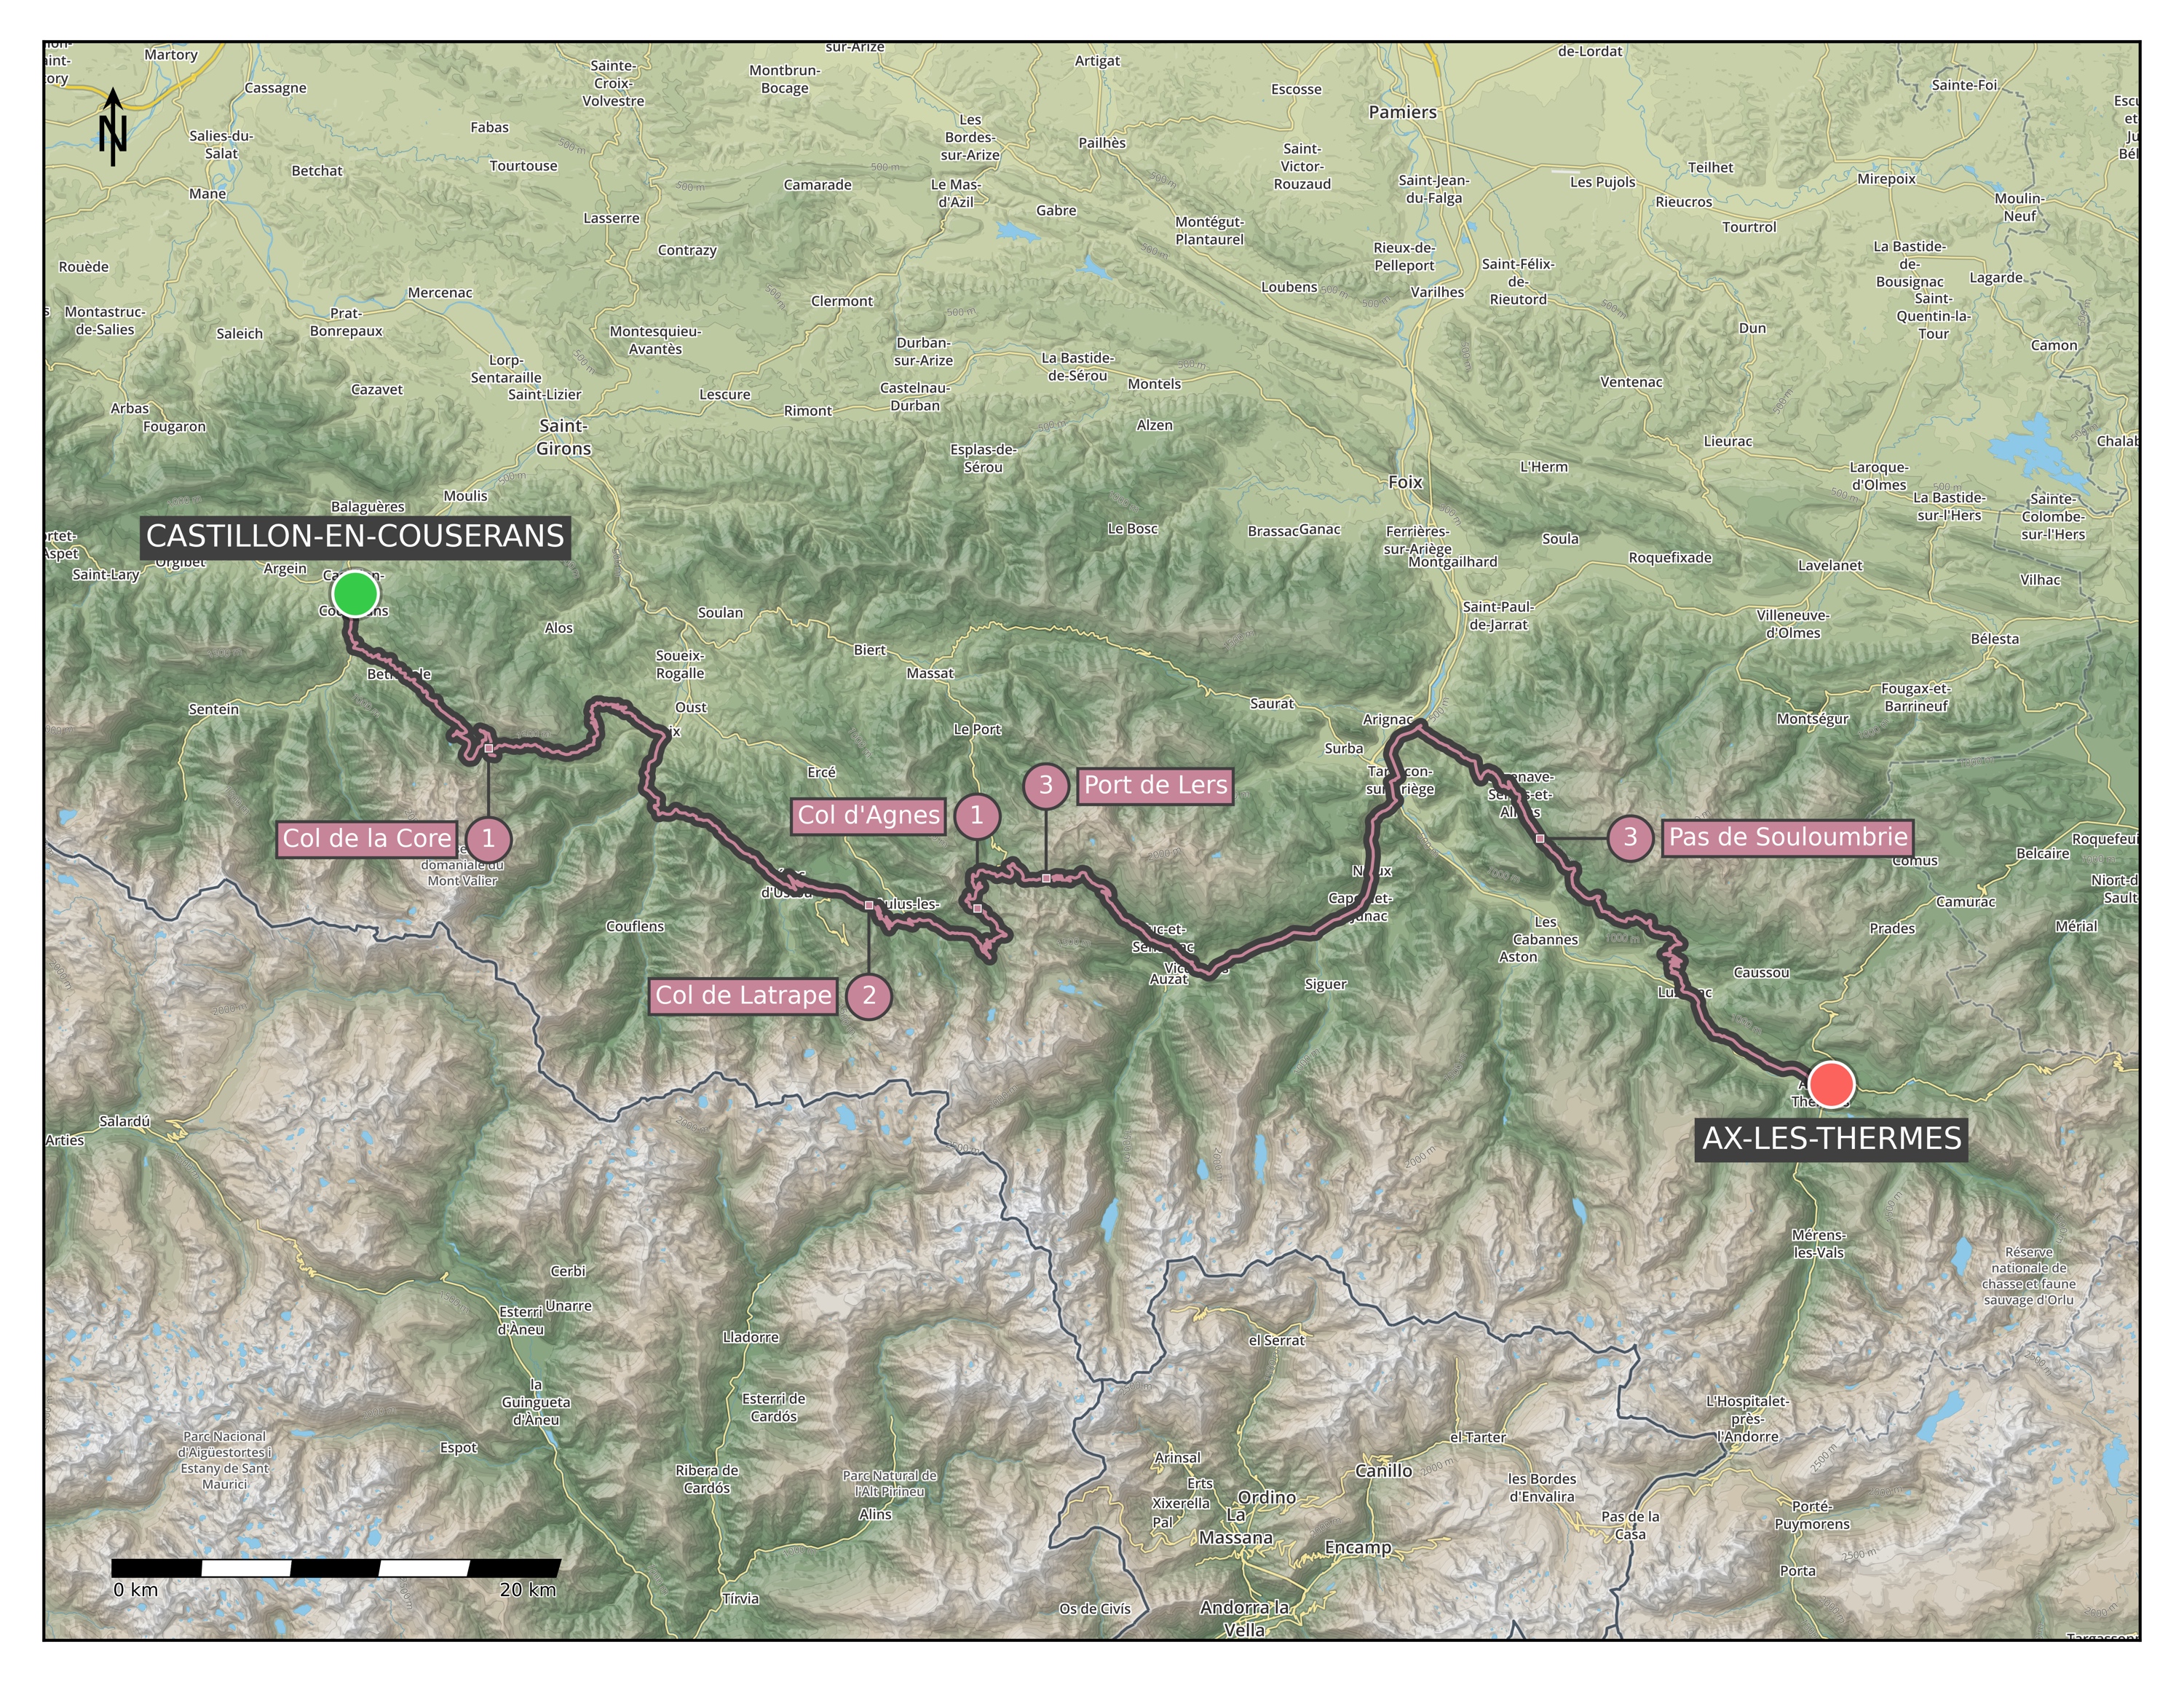
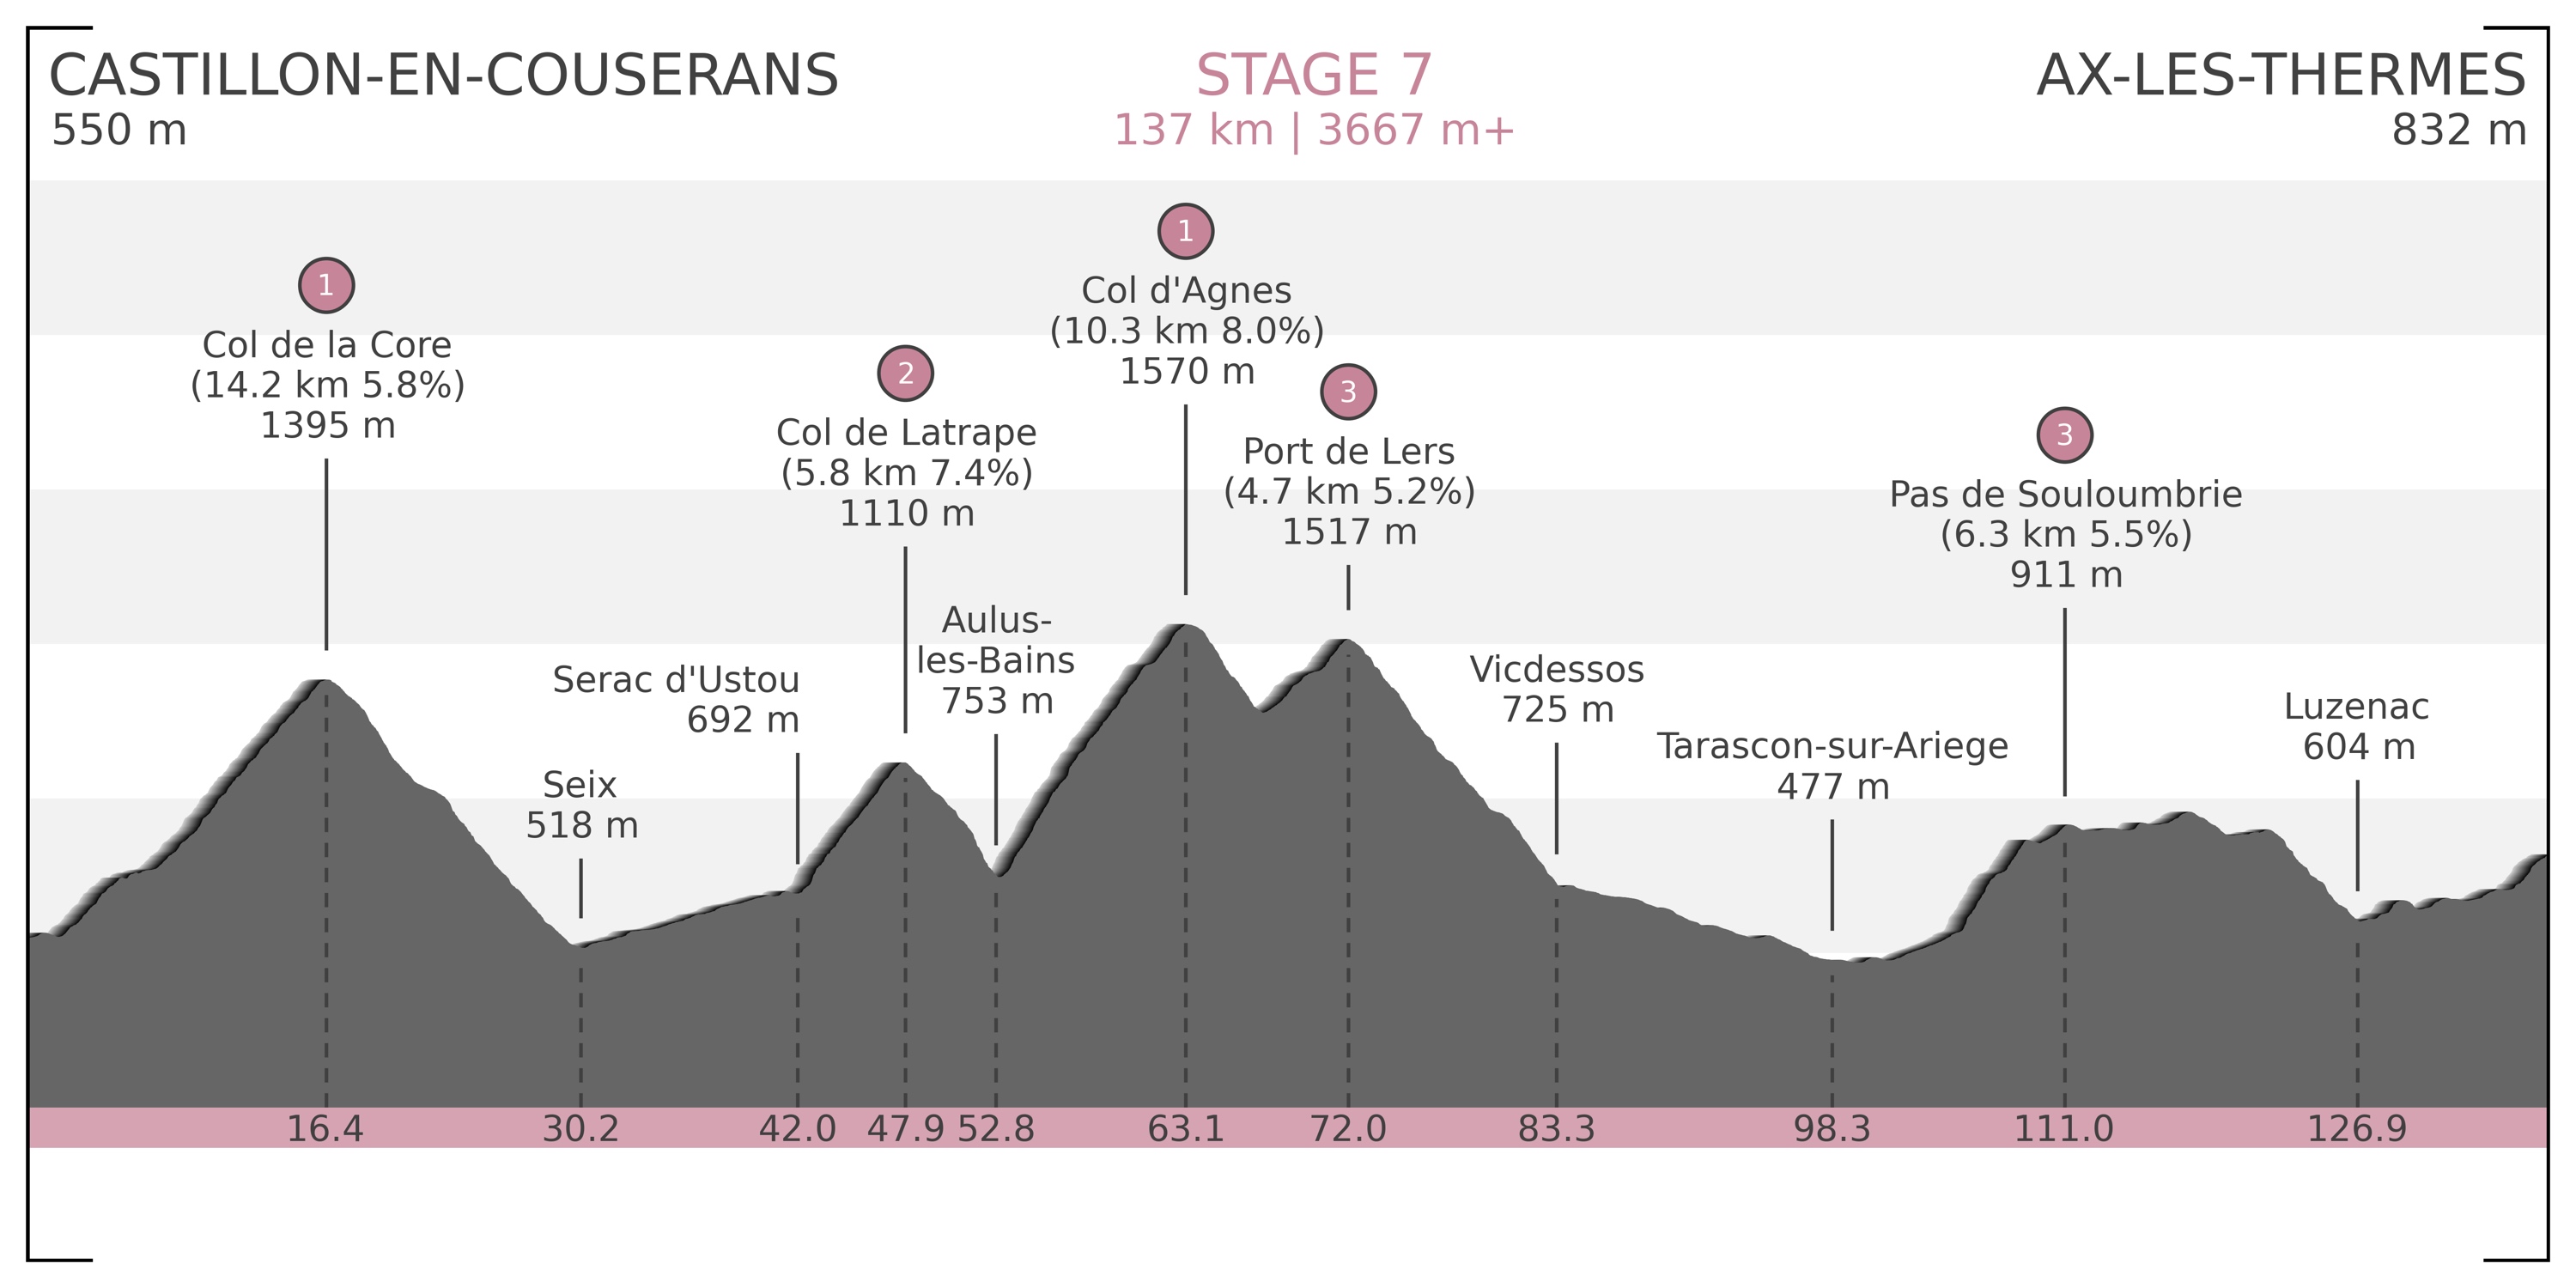
Stage 7) Castillon-en-Couserans – Ax-les-Thermes: 137 km | 3667 m+ (Map / Profile)
– Col de la Core [1395 m] Cat 1 (14.2 km @ 5.8%)
– Col de Latrape [1110 m] Cat 2 (5.8 km @ 7.4%)
– Col d’Agnes [1570 m] Cat 1 (10.3 km @ 8.0%)
– Port de Lers [1517 m] Cat 3 (4.7 km @ 5.2%)
– Pas de Souloumbrie [911 m] Cat 3 (6.3 km @ 5.5%) - June 19:
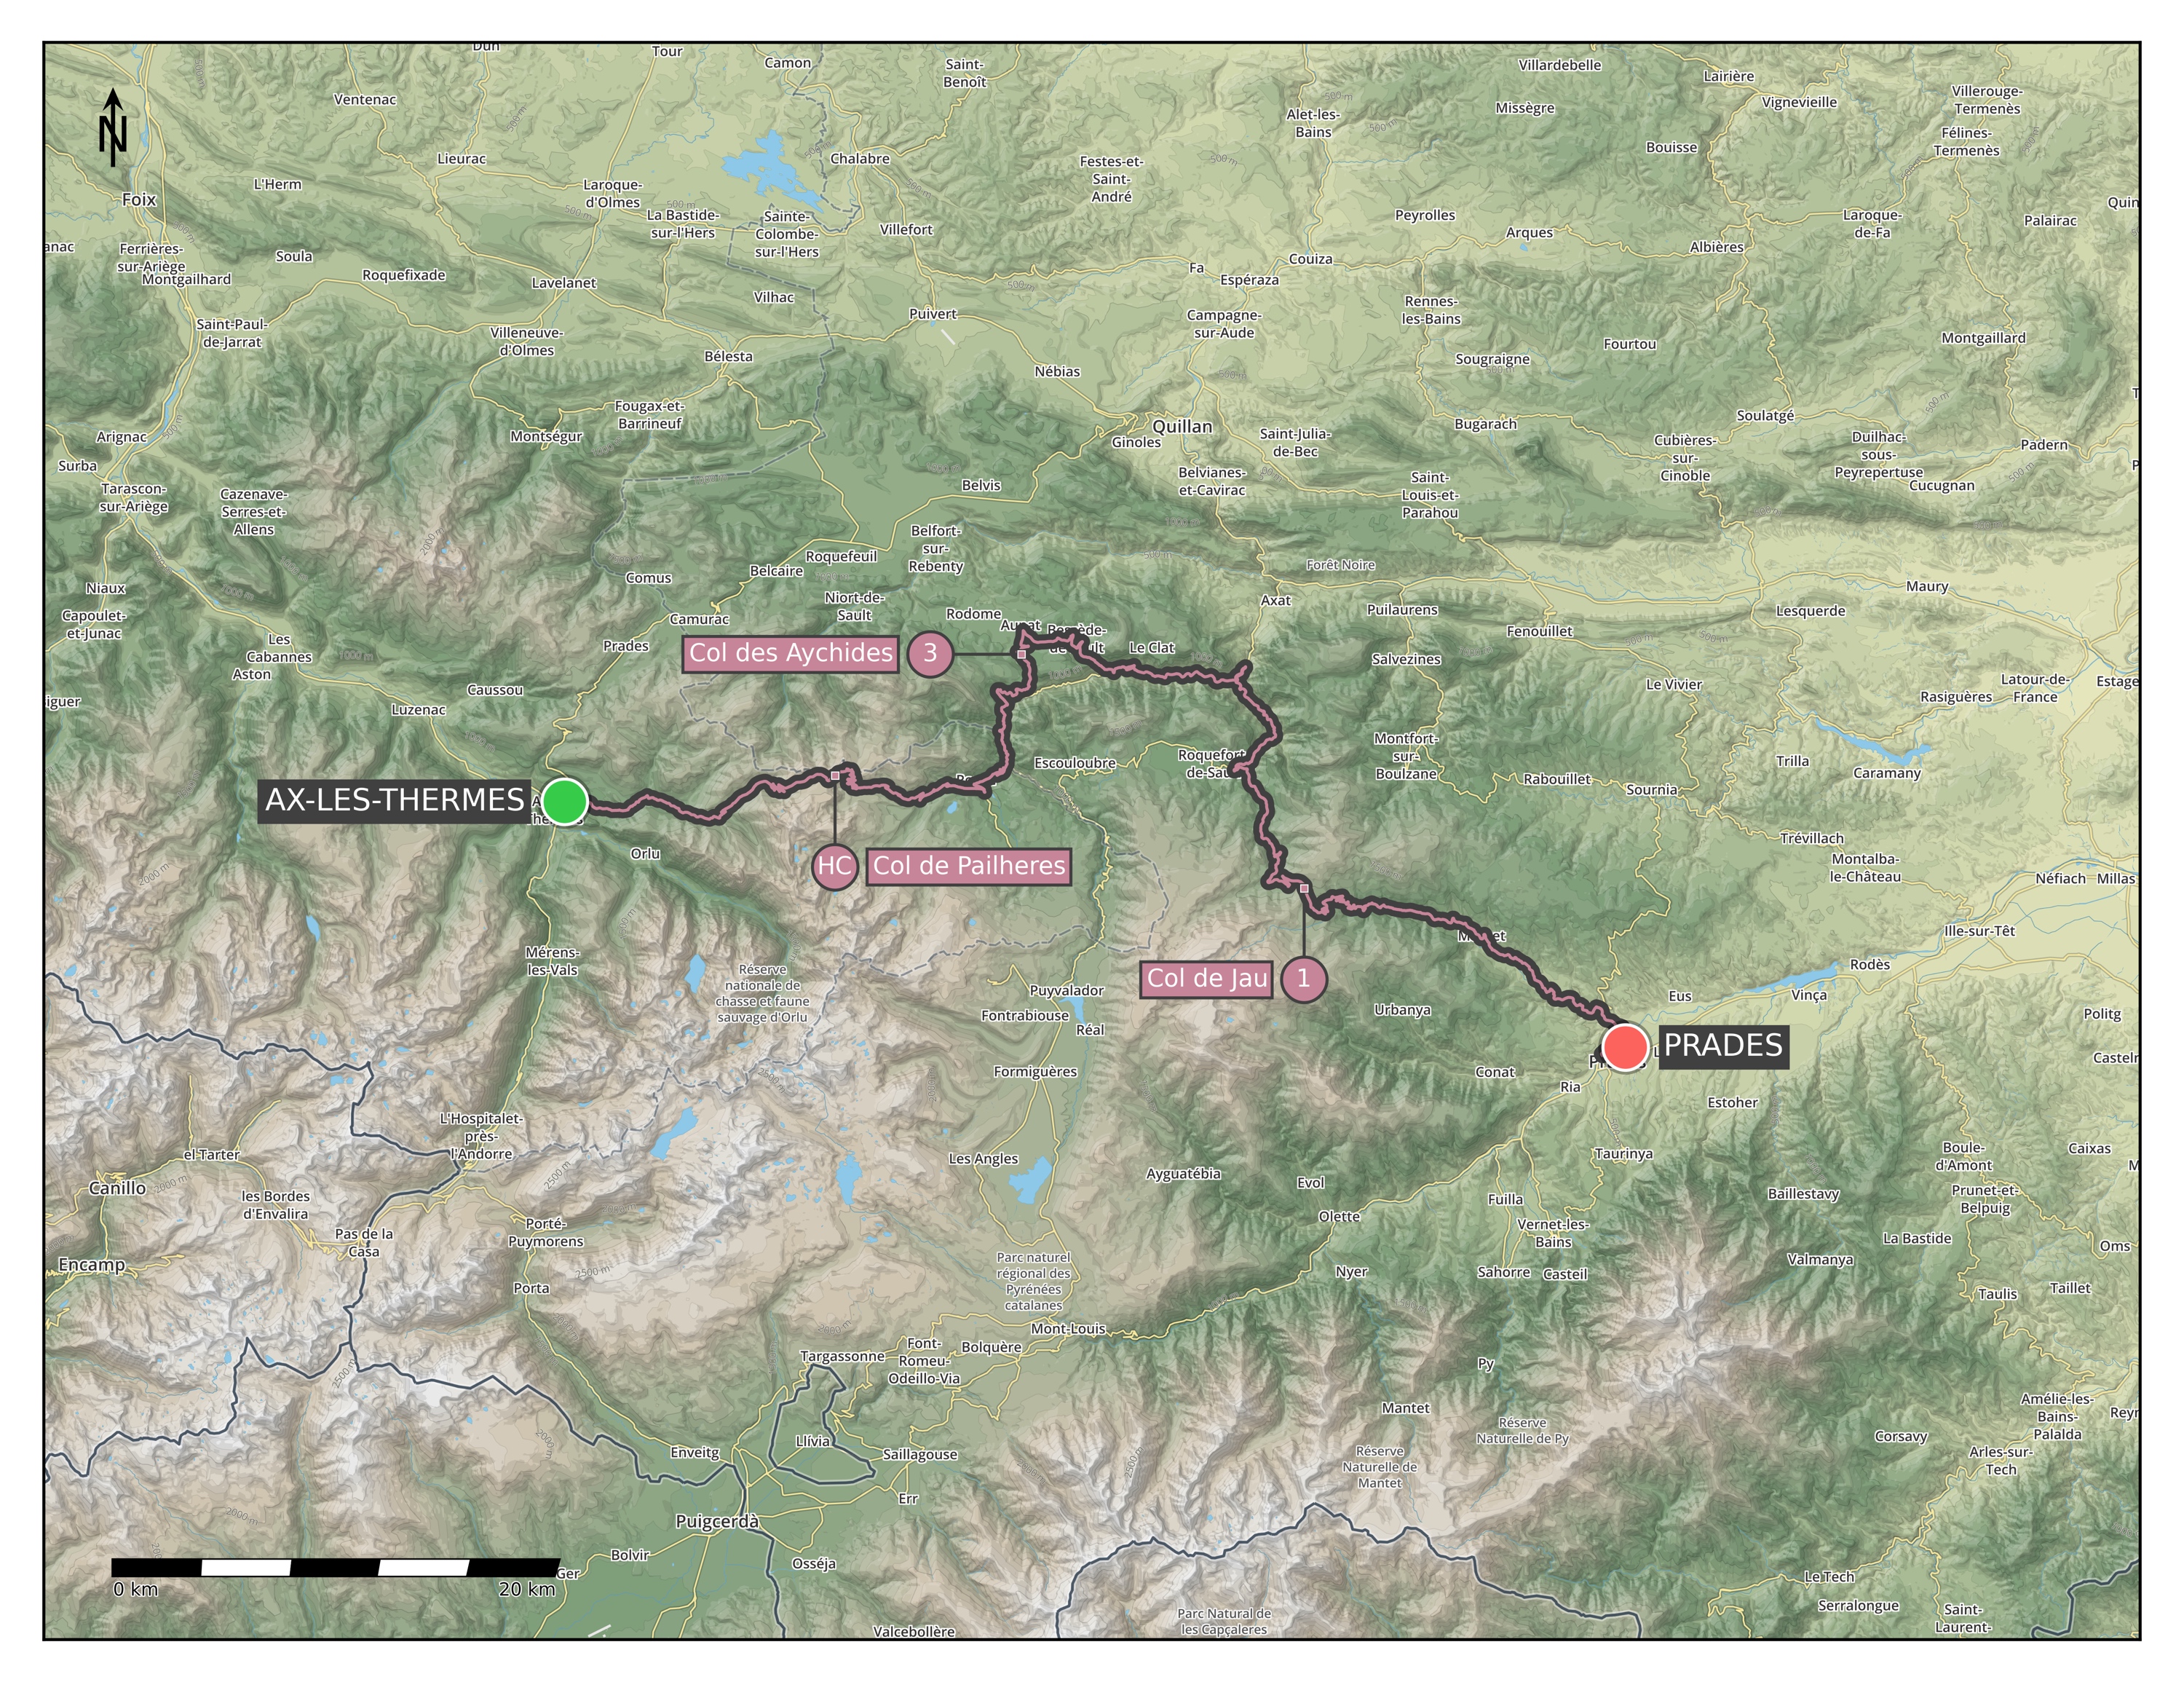
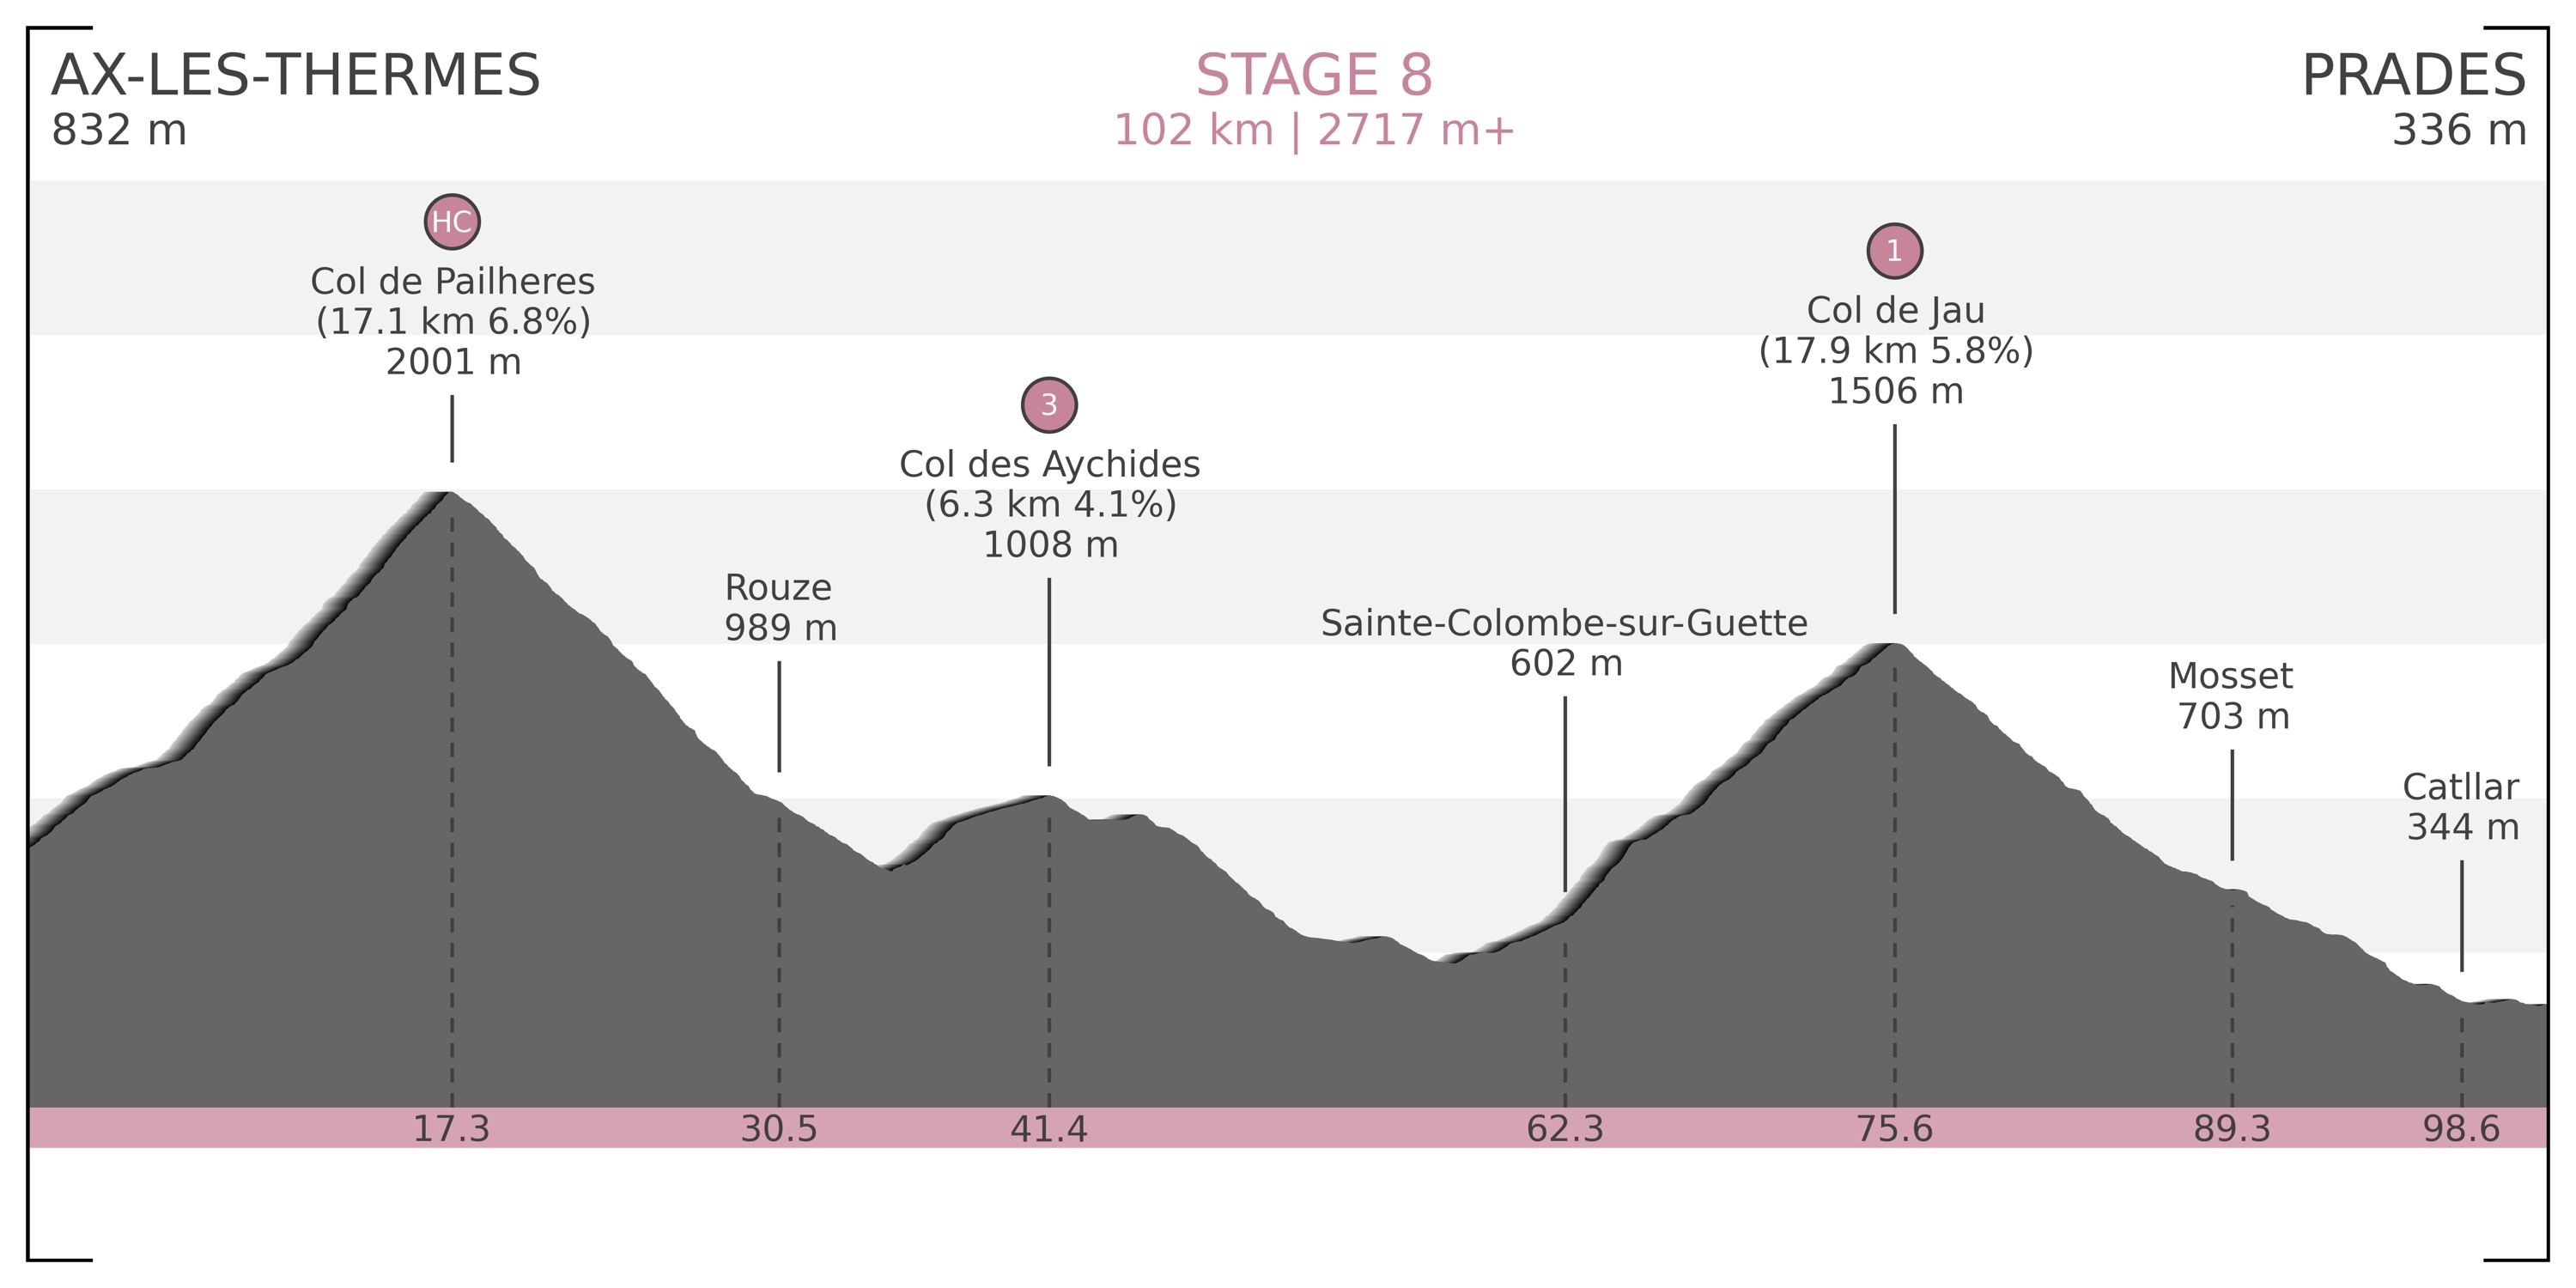
Stage 8) Ax-les-Thermes – Prades: 102 km | 2717 m+ (Map / Profile)
– Col de Pailheres [2001 m] HC (17.1 km @ 6.8%)
– Col des Aychides [1008 m] Cat 3 (6.3 km @ 4.1%)
– Col de Jau [1506 m] Cat 1 (17.9 km @ 5.8%) - June 20:
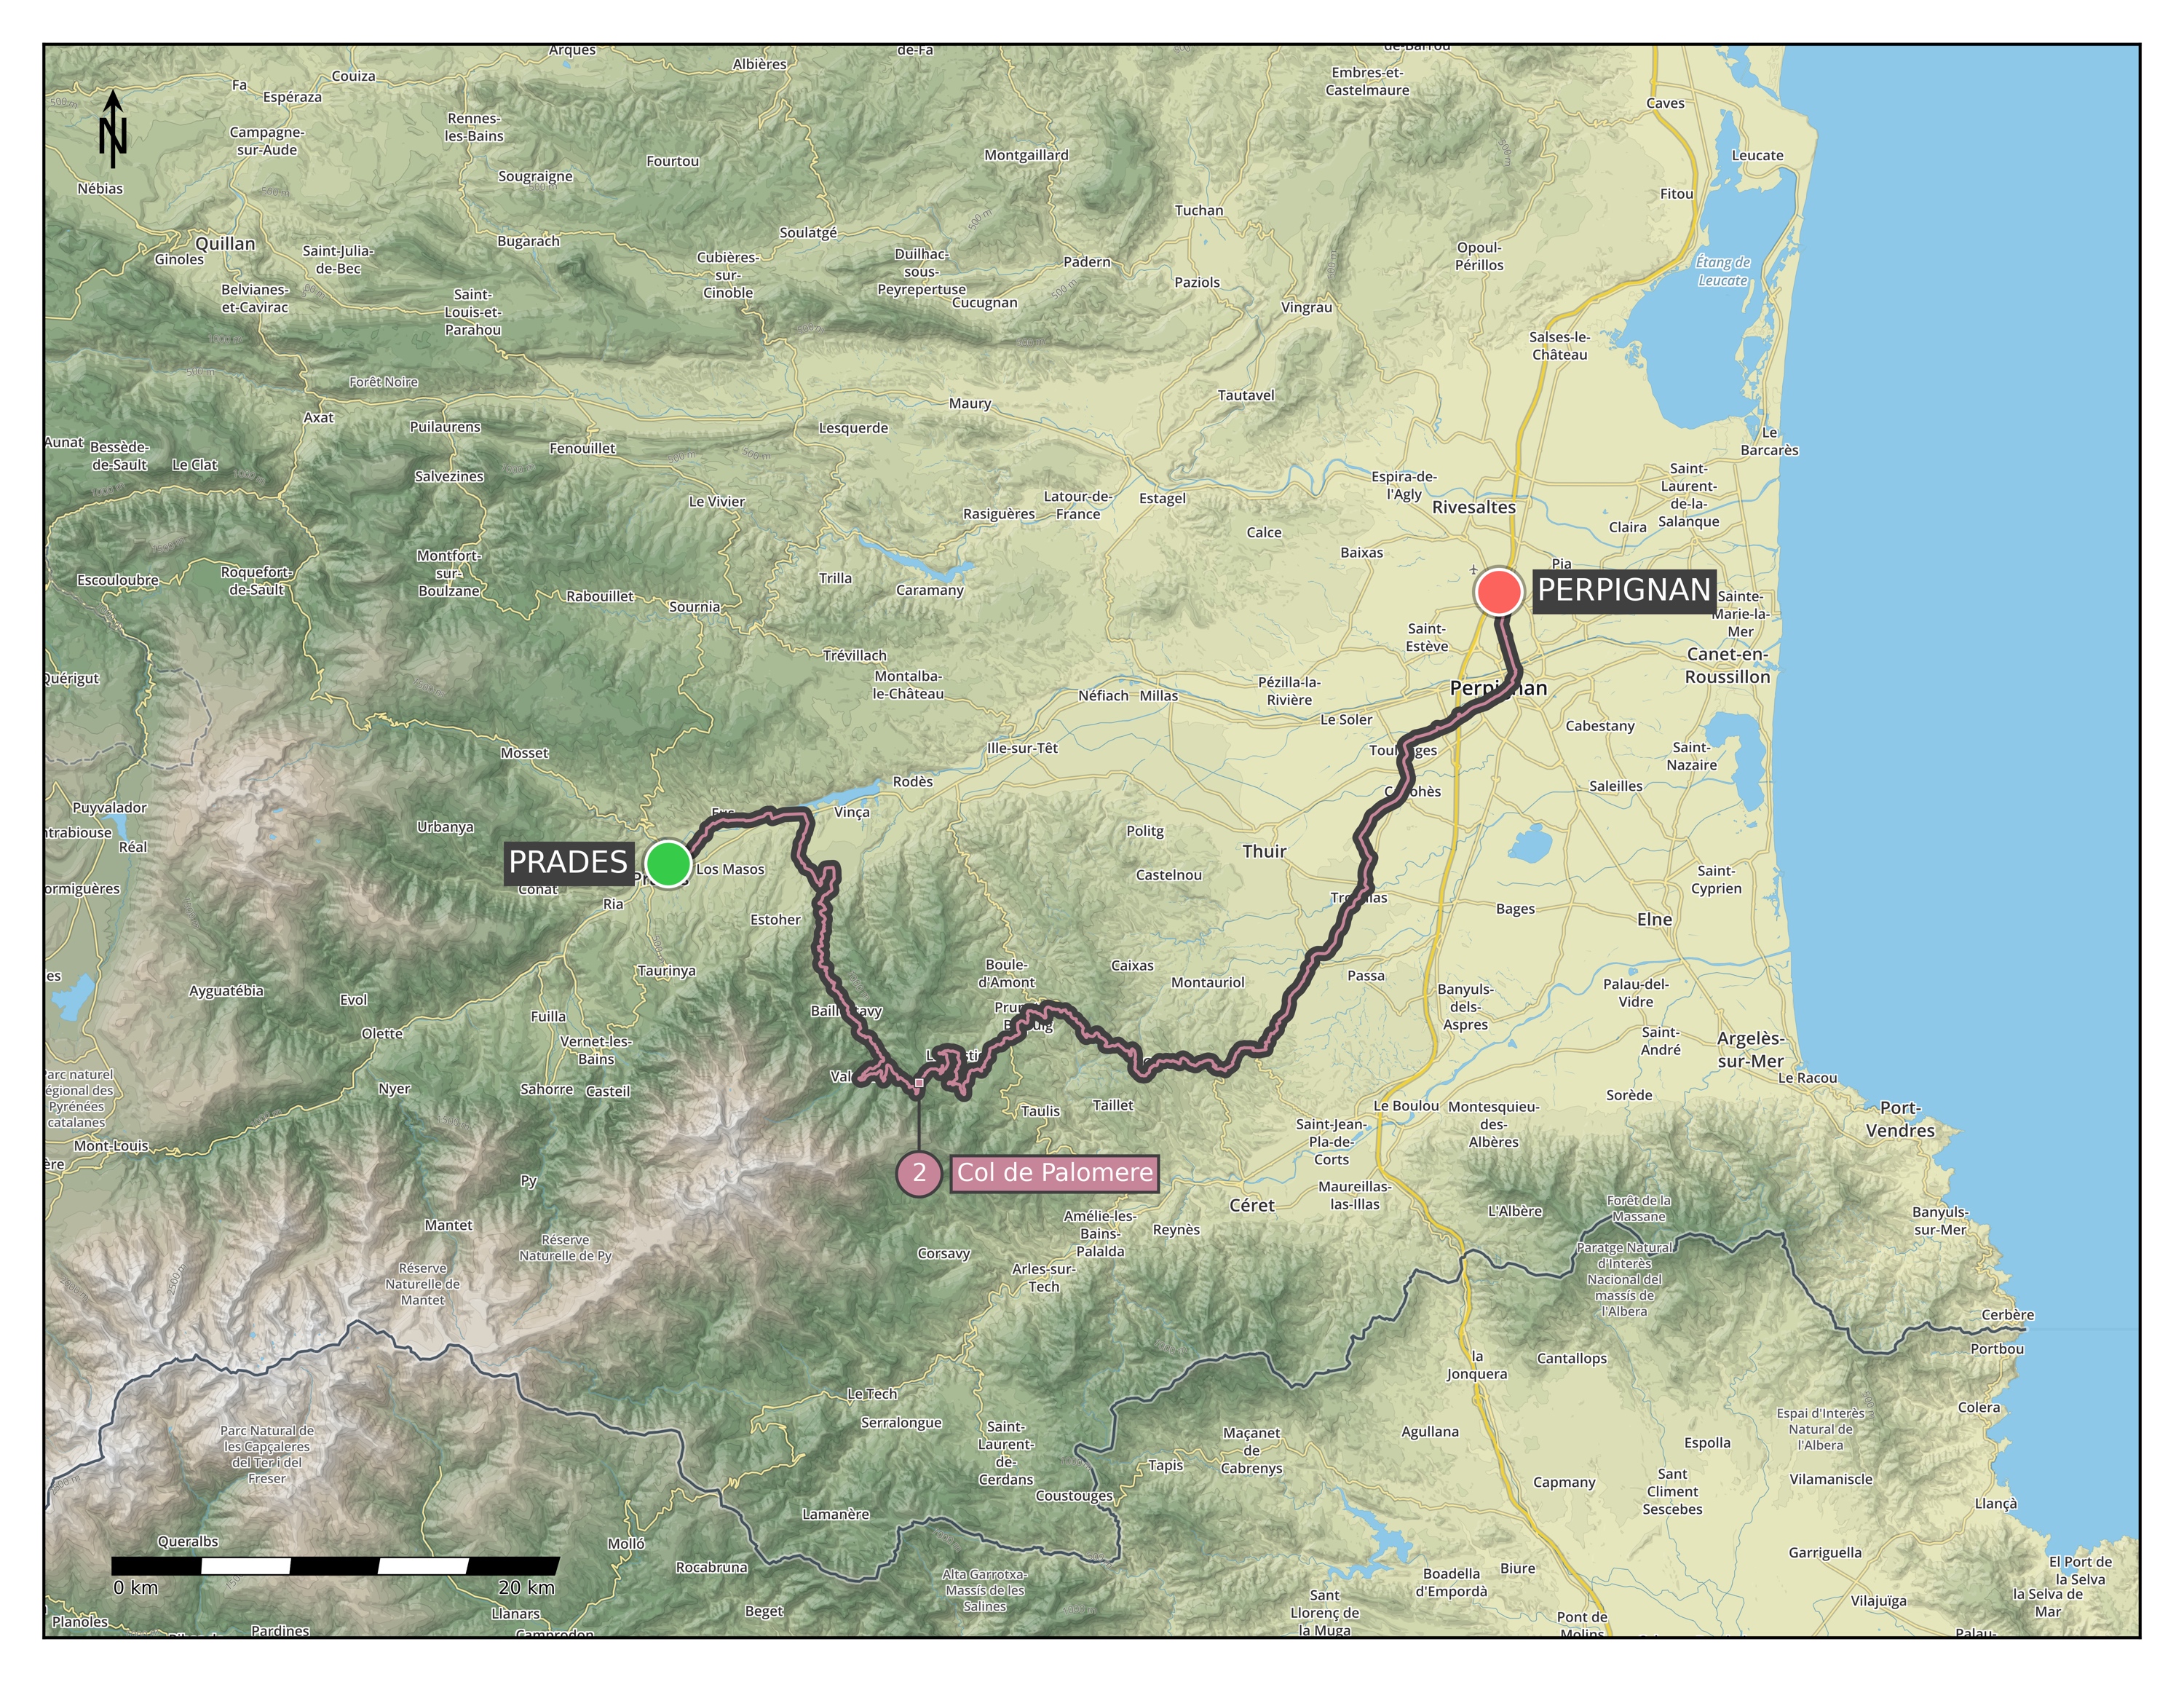
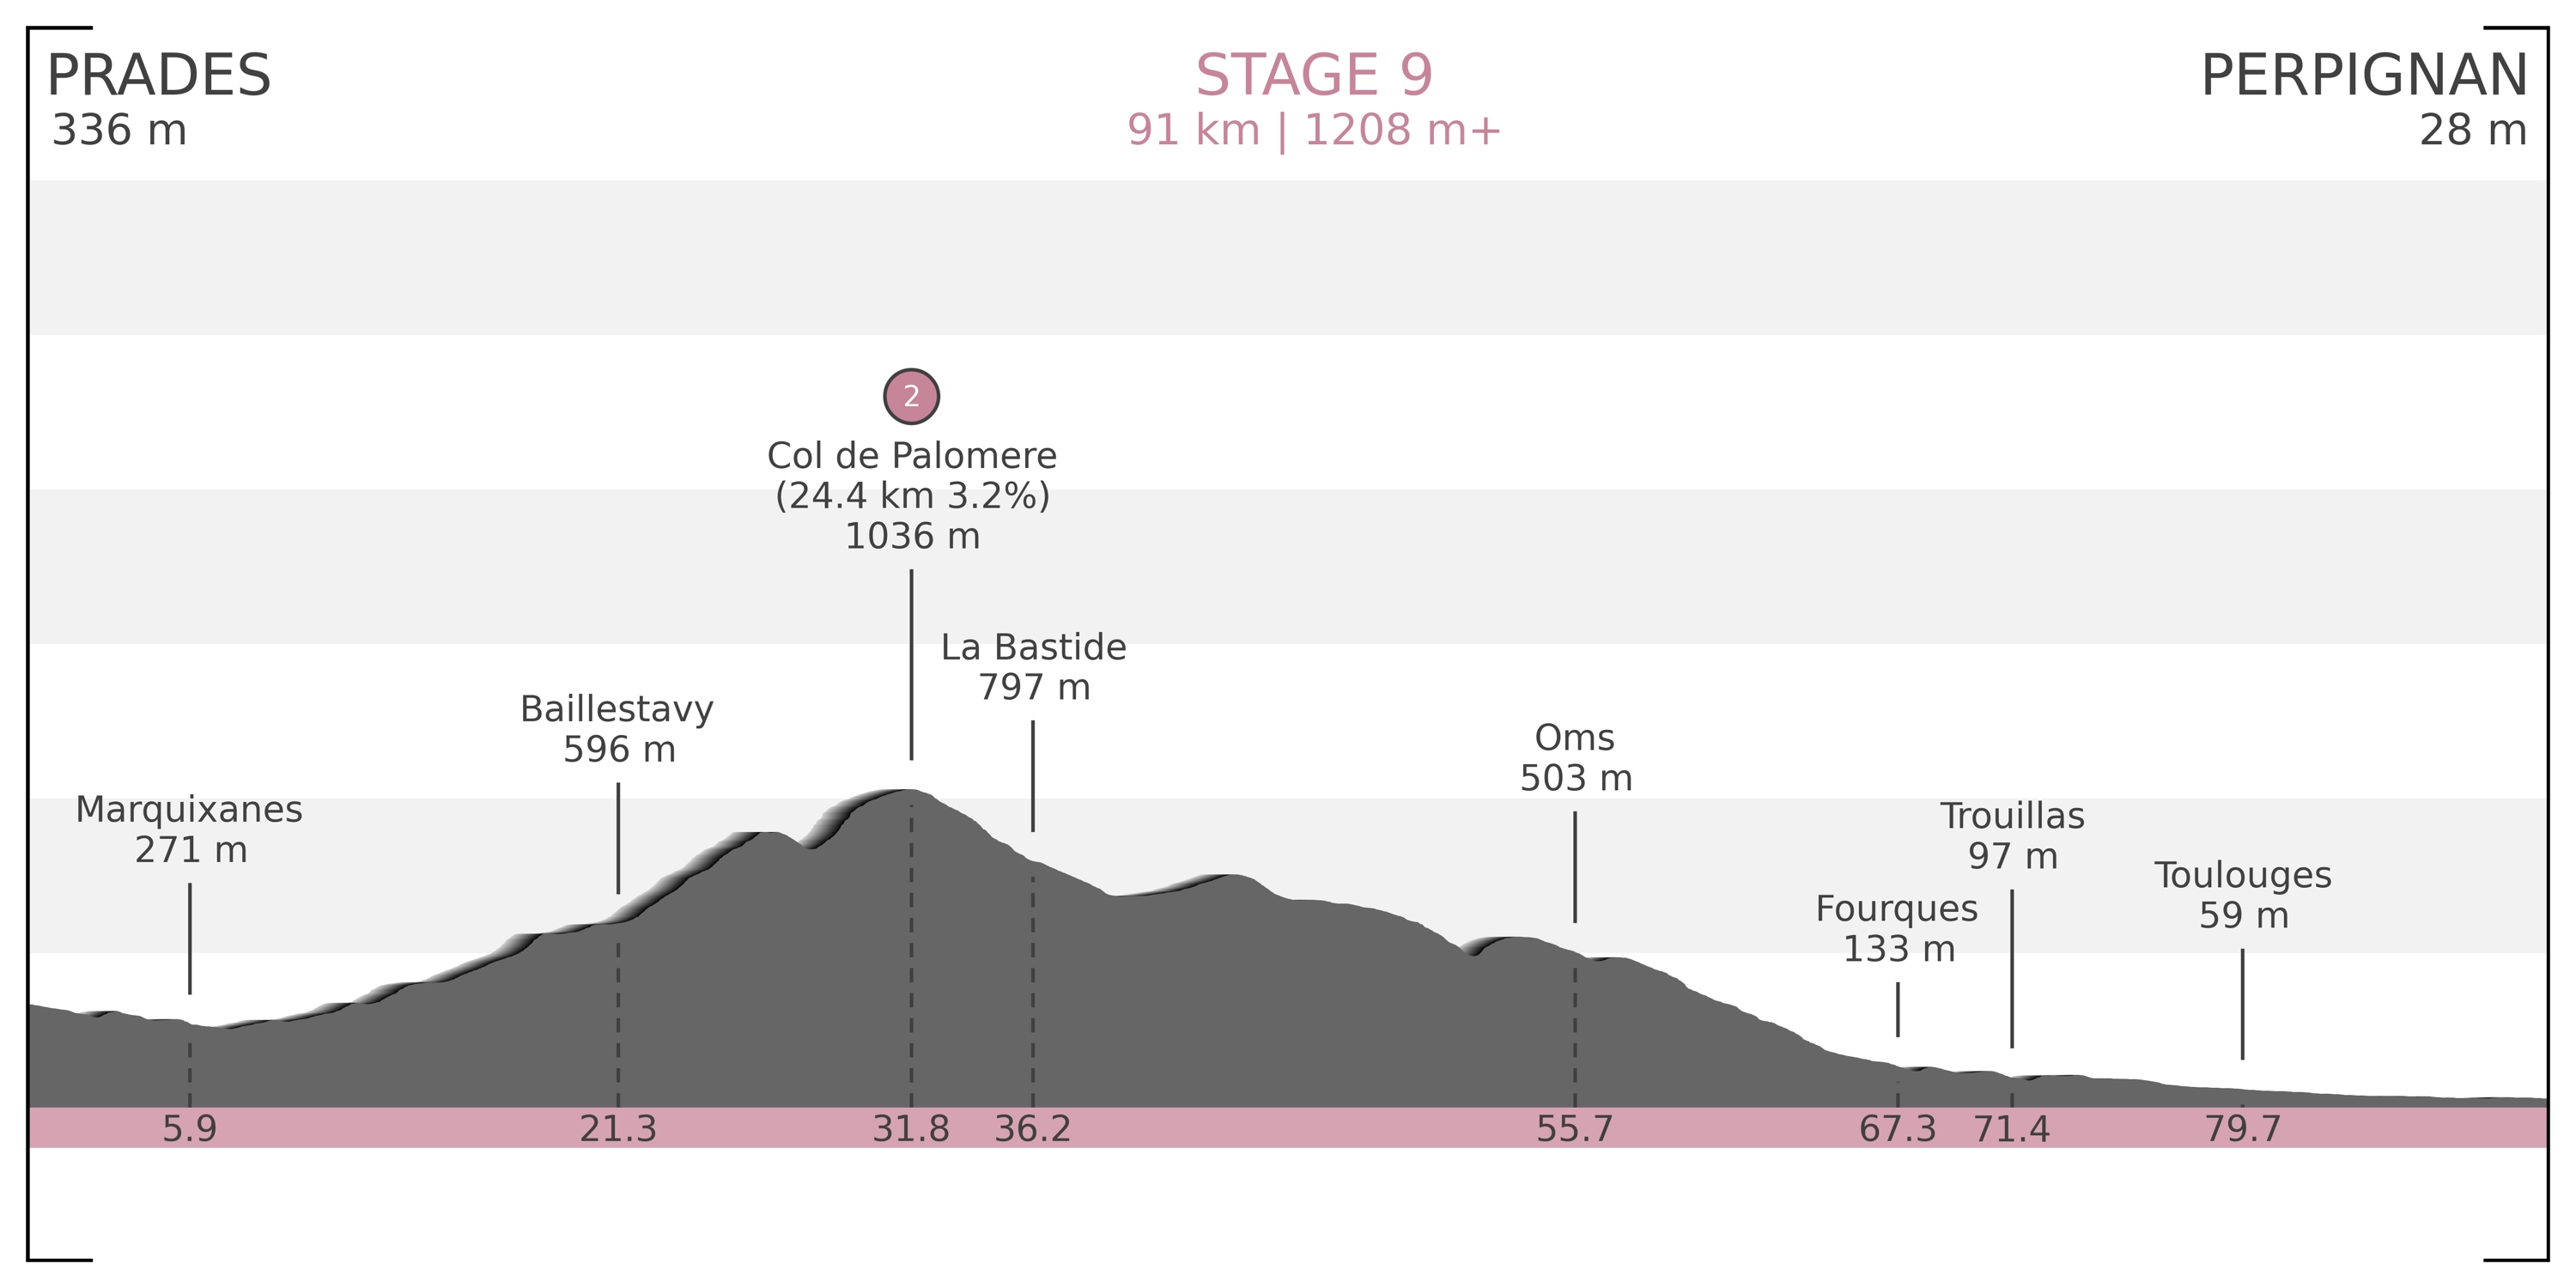
Stage 9) Prades – Perpignan: 91 km | 1208 m+ (Map / Profile)
– Col de Palomère [1036 m] Cat 2 (24.4 km @ 3.2% – including a short descent)
Pick up the rental car in Perpignan and drive to Biarritz, where we stay for the night. - June 21:
Drive home.