Yesterday somewhere along the channel between Mechelen and Leuven, I passed the 20000 km mark on my racing bike. This is the distance I have ridden since I started cycling (as a sport/training – I do not keep track of the kilometres during commuting anyway) on the 20th of February in 2010. By the time I arrived home and finished the day’s ride, I was (virtually) over halfway around the circumference of our home planet. To commemorate this event, here are some statistics from the past years.
Between 20 February 2010 and 15 May 2013 (1180 days, or almost 39 months) I have the following statistics:
- 457 rides (including very short ones up to and down from the Mercator telescope)
- 20042 km (half the Earth’s circumference)
- 711h 17m 06s on the bike (almost 30 days)
- 126933 m of elevation gained (more than 14 times the height of Mt Everest)
- 28.1 km/h average speed (674.4 km/day)
- 159 BPM average heart rate (that is still in Zone 2 for me, so moderate intensity)
- 88 RPM average cadence
- 546431 Calories (or kcal) burned (almost 220 Guideline Daily Amounts for men)
Longest/furthest/etc.:
- Longest ride: 8h 45m 42s
- Furthest ride: 219.76 km
- Most calories burned on one ride: 5976 kcal
- Most elevation gained: 5071 m
- Biggest climb: Roque de los Muchachos (East side), 41.8 km @ 5.7% from 9 m to 2410 m
- Highest solo average speed on a flat course: 35.8 km/h (on 48 km)
- Highest speed (excluding indoor rides): 81.9 km/h (descending on Tenerife)
- Highest average heart rate: 184 BPM (for almost 1.5 hours)
- Highest heart rate: 200 BPM (climbing the Smeysberg)
Statistics per year (from Garmin Connect):
See how my cadence got higher, my average speed grew, while I managed to lower my average heart rate over time? That’s very good! It means that my body got used to cycling :)
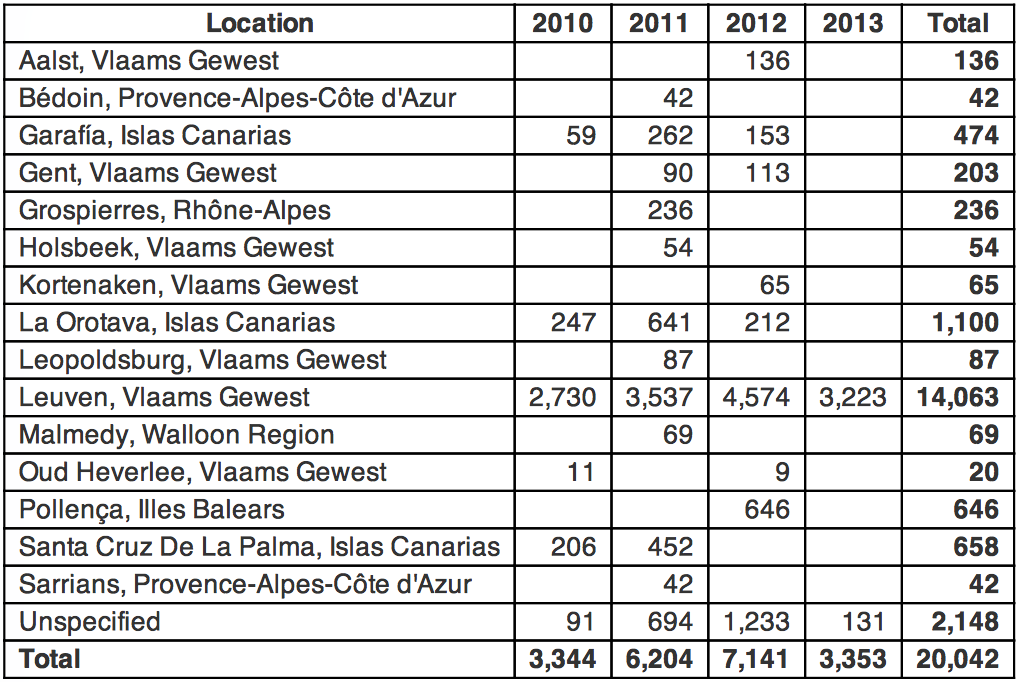
Total distance by starting location and year (stats from here, “Unspecified” stands for indoor trainer rides):
Cool to see how much I actually rode (2231 km, more than 11% of the total) on the Canary Islands :) Now here are a few pies showing the yearly distributions with a bit broader regions:
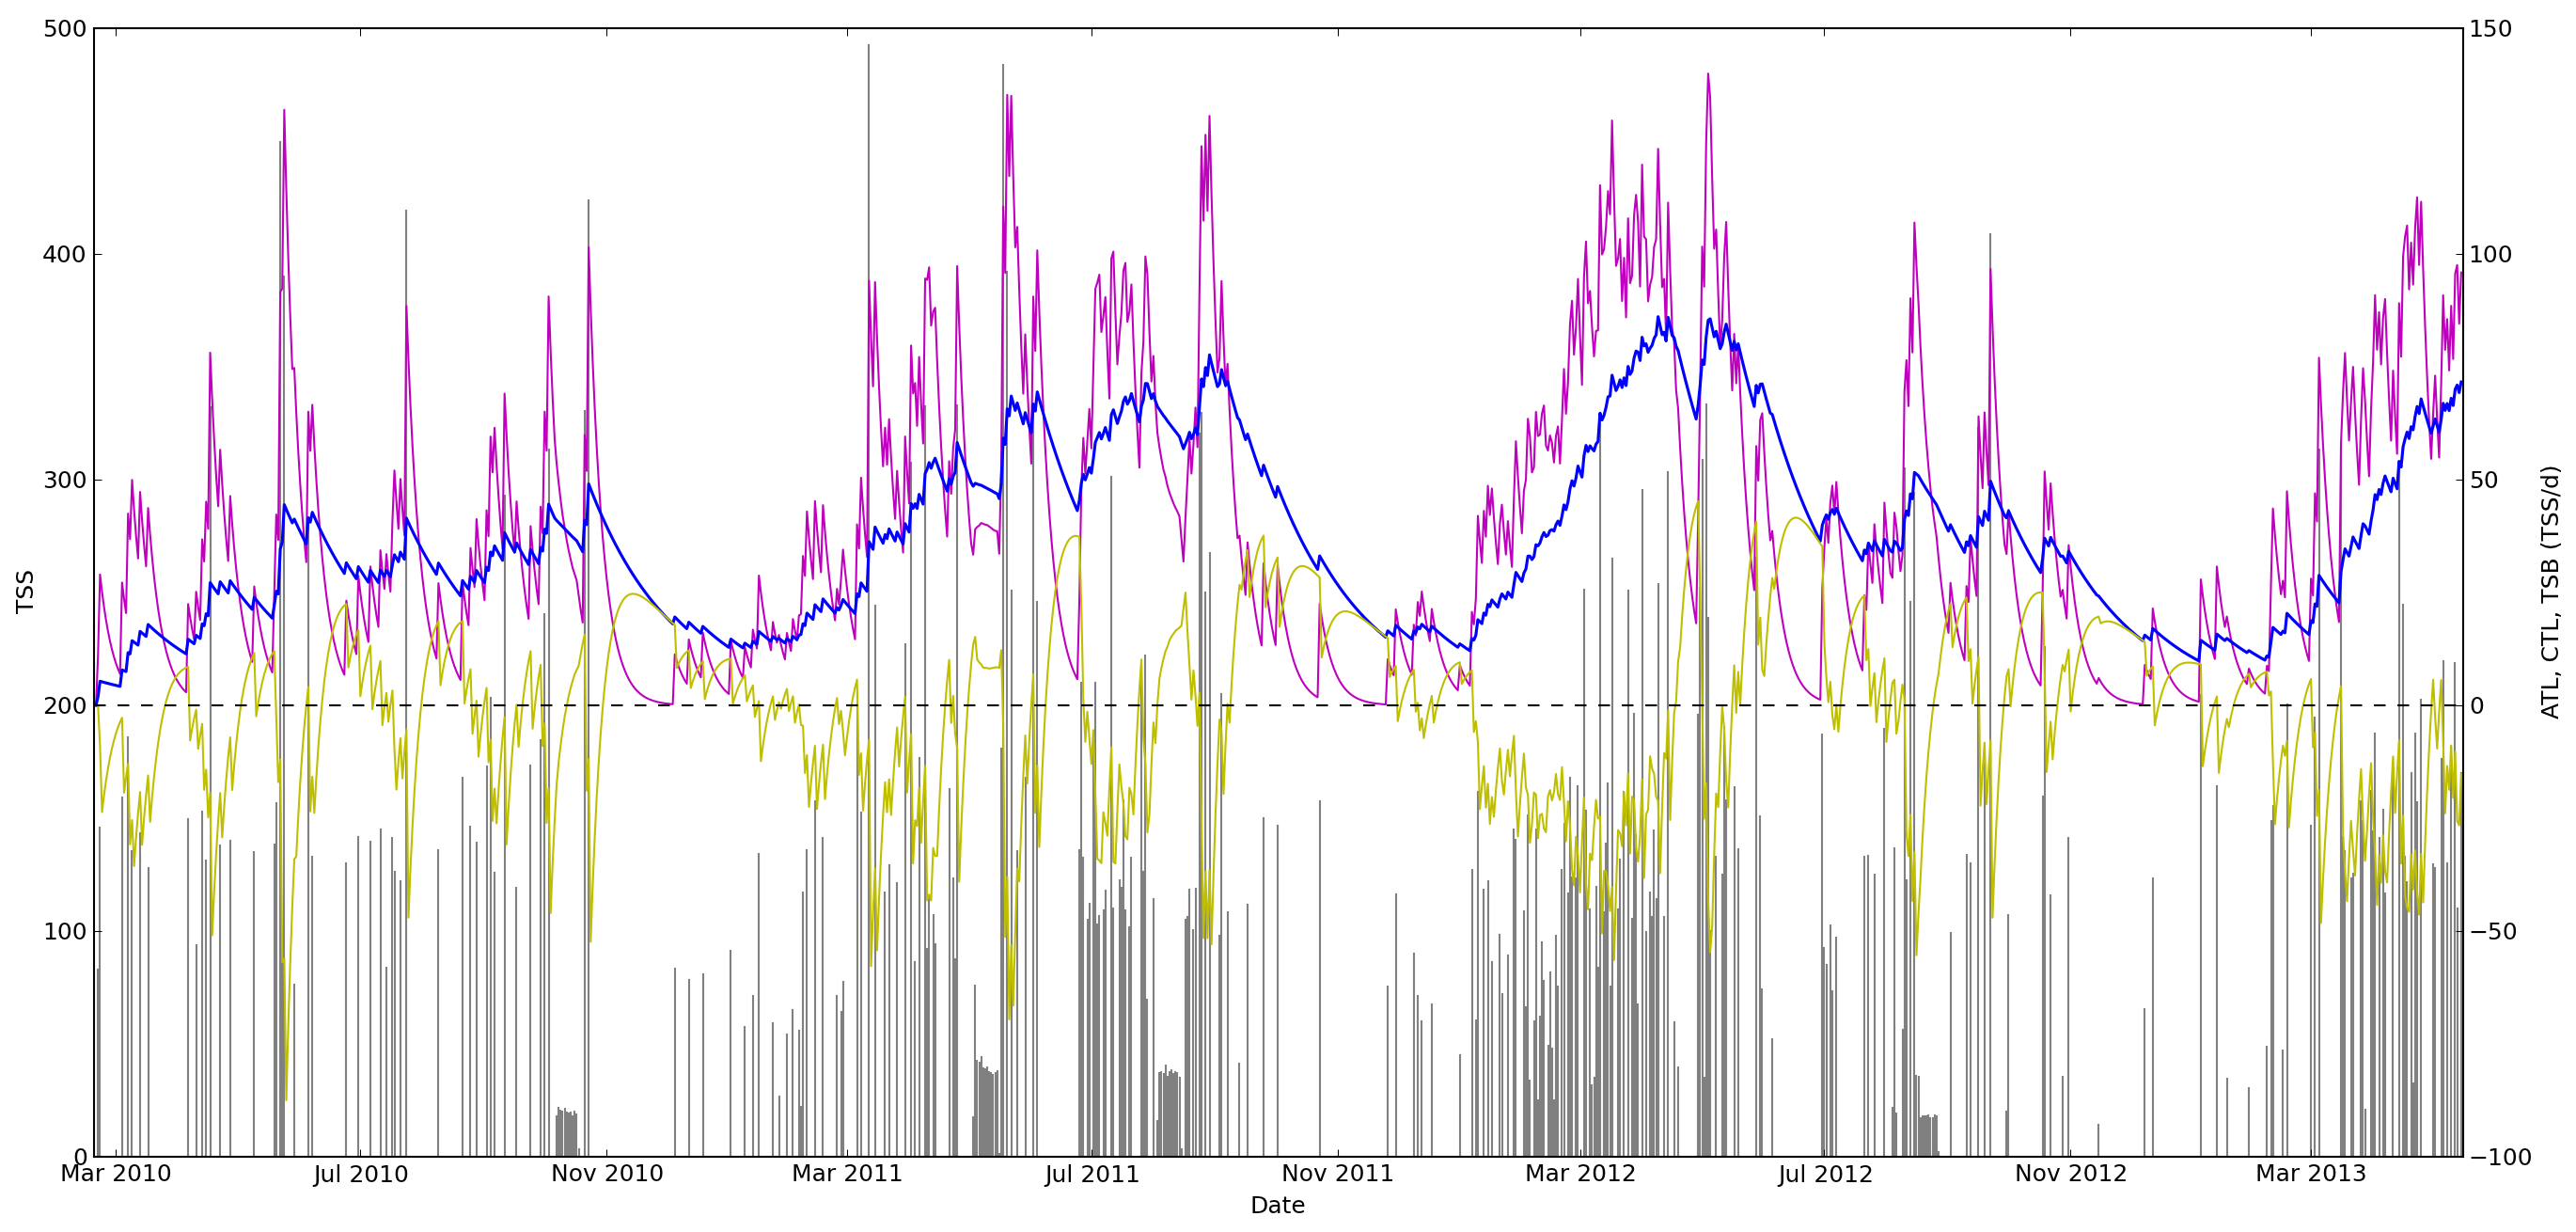
The next graph shows how my form changed over time (read this post to understand it):
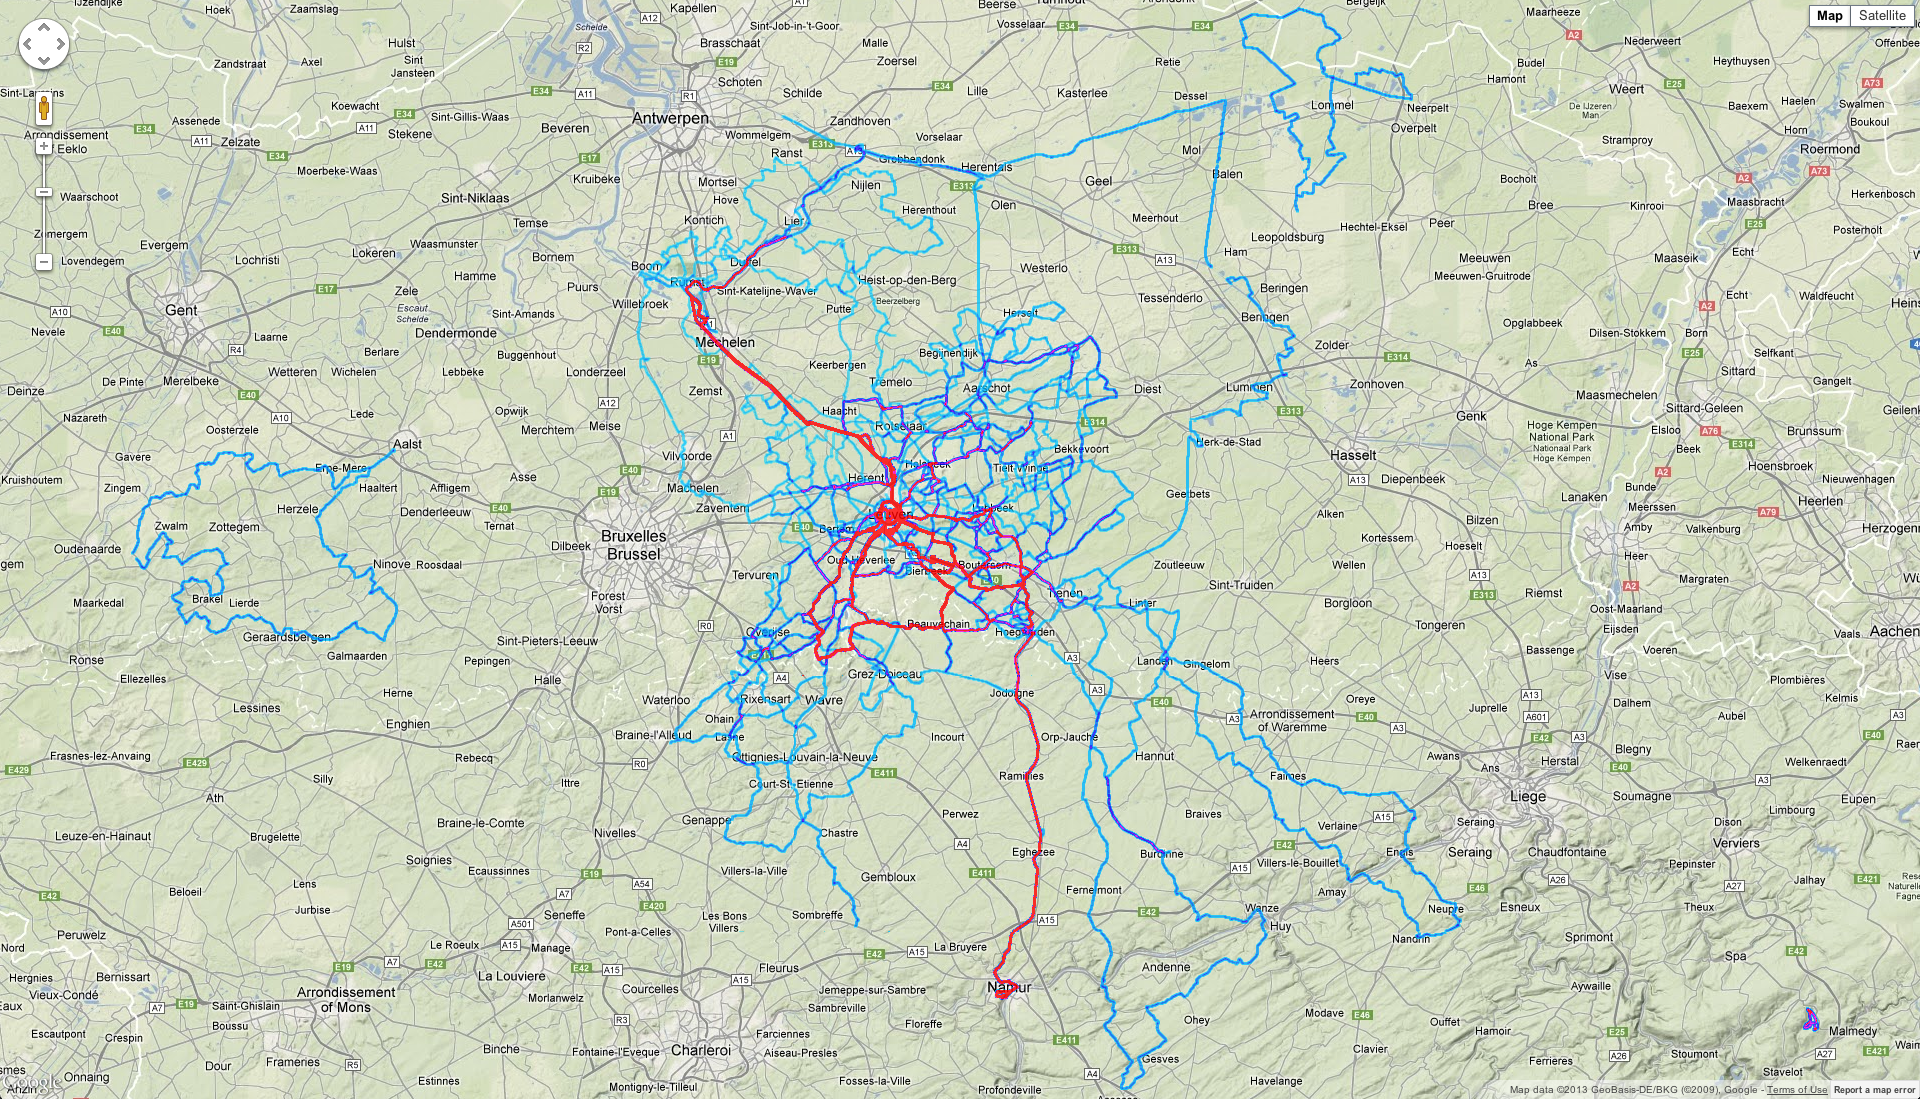
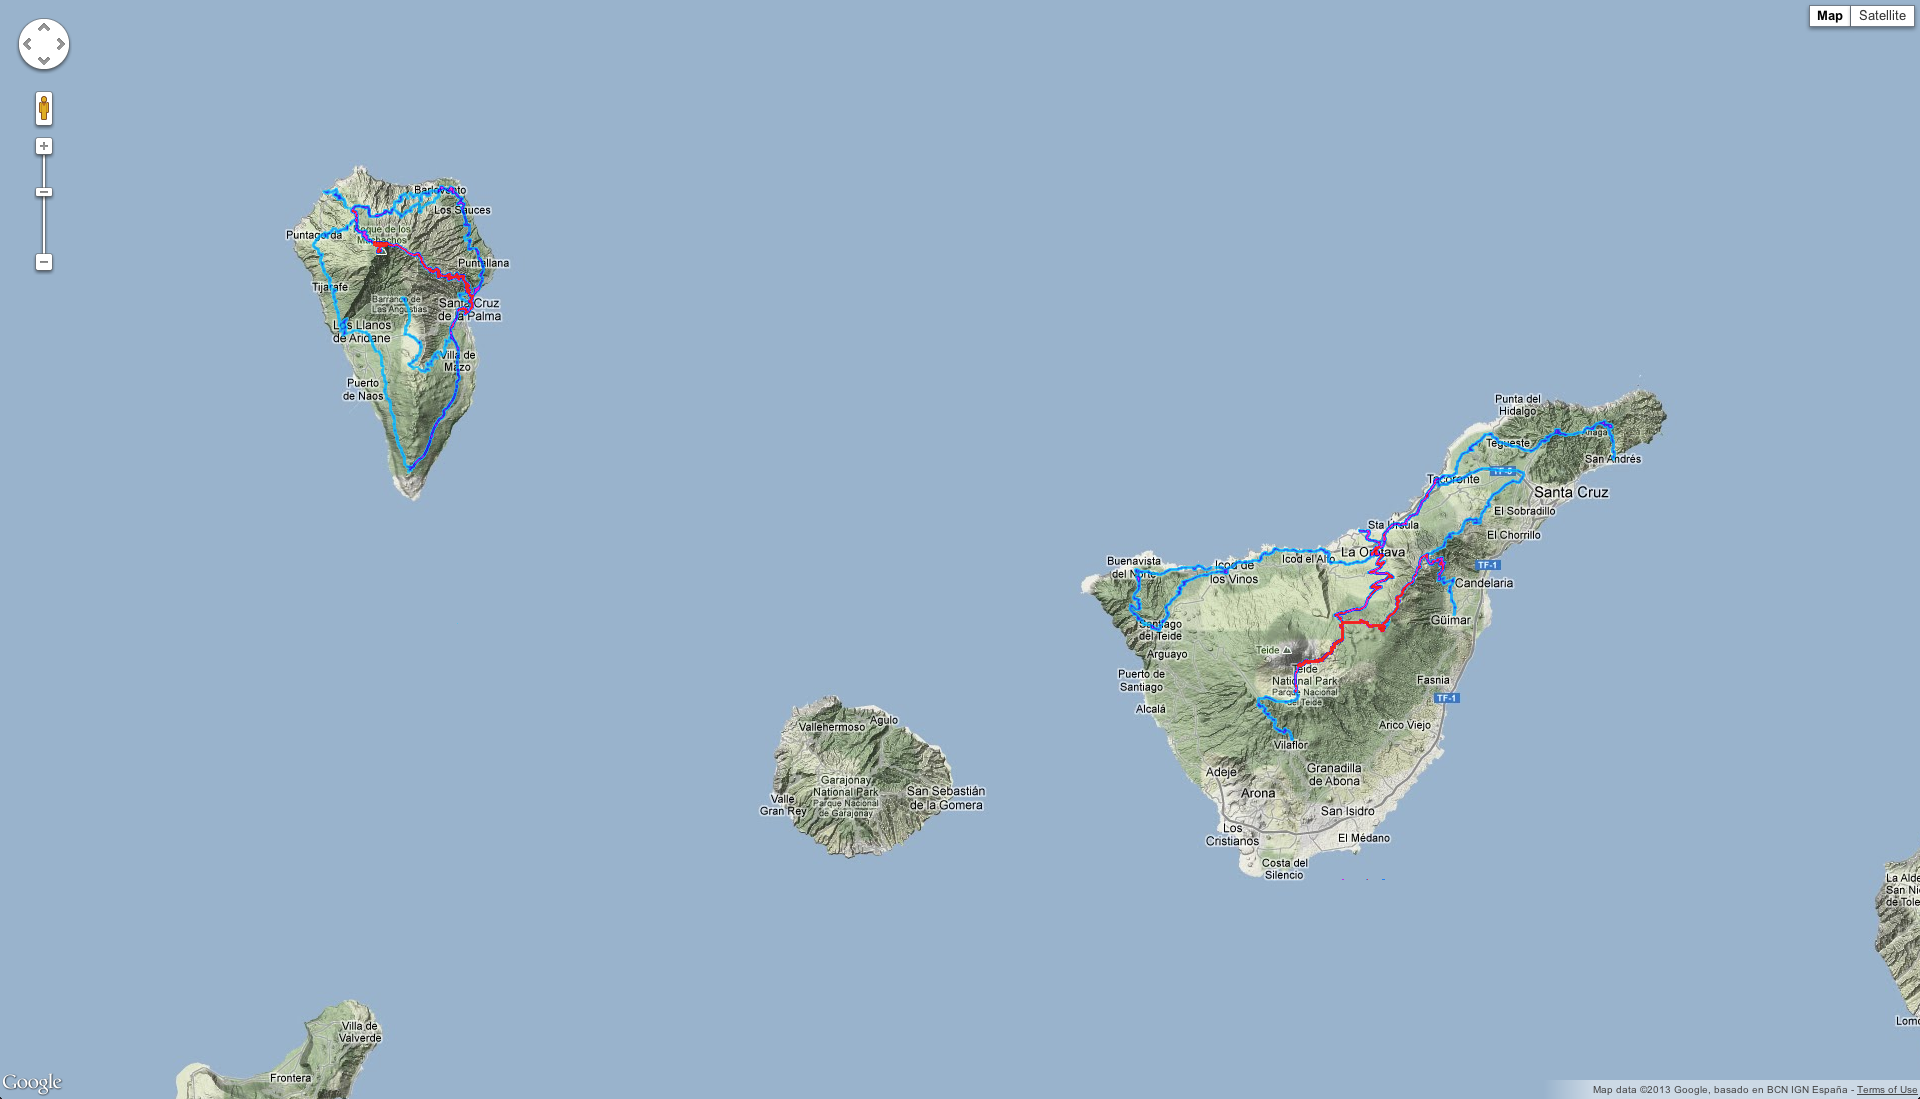
And at the end, here are two maps (using this service) of all the rides I have done in Belgium, and on the Canary Islands (the redder the line the more I rode that road). Better viewed when clicked :)


Már-már kezdem azt hinni, hogy ebből is tudnál doktori értekezést írni. Elképeszt ez az alaposság.