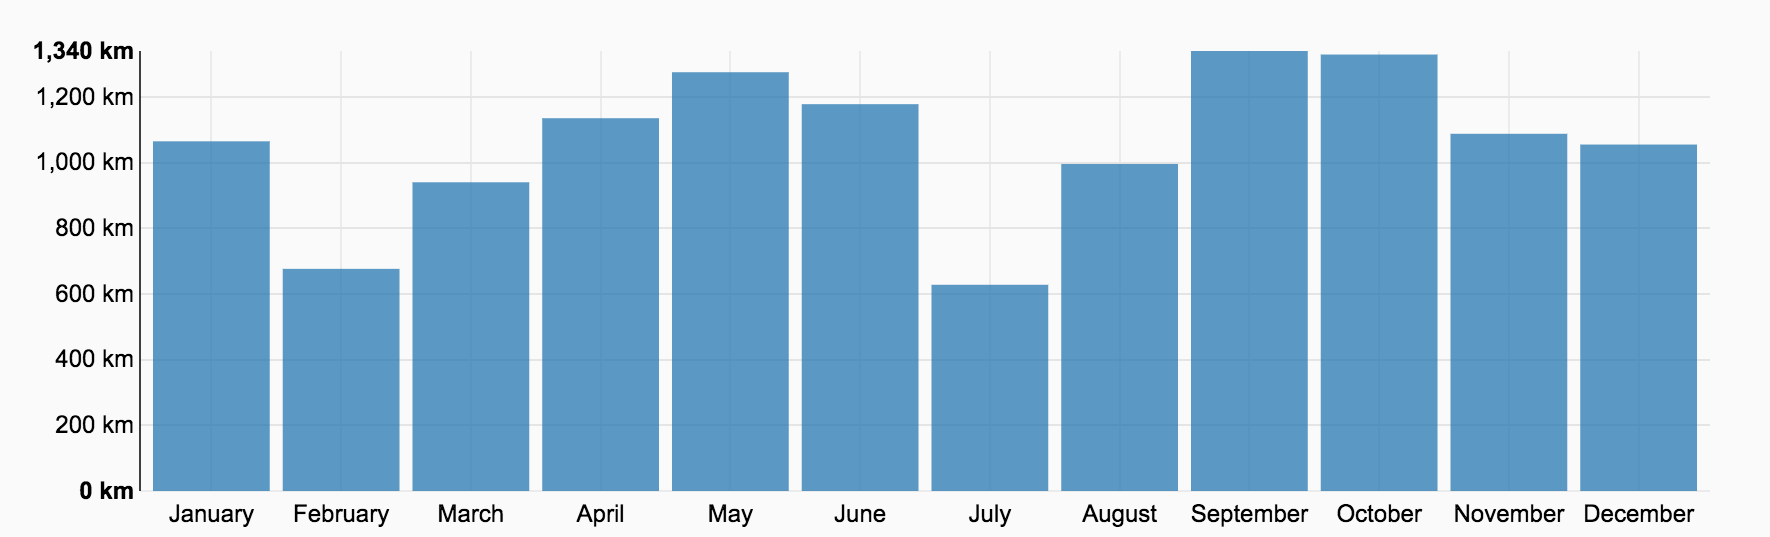
2018 was the fourth year in a row that I managed to bike more than 10000 kilometres, but this was the first time that I finished the season with more than an average of 1000 km per month (my best months were September and October with 1340 km and 1329 km, while my worst were July and February with 628 km and 676 km). Therefore my best cycling-year ever is now 2018 with 12704 km (with a not even small margin of 1374 km – 10.8% – over 2017). For the first time ever I broke the 100000 meter elevation gain limit too.
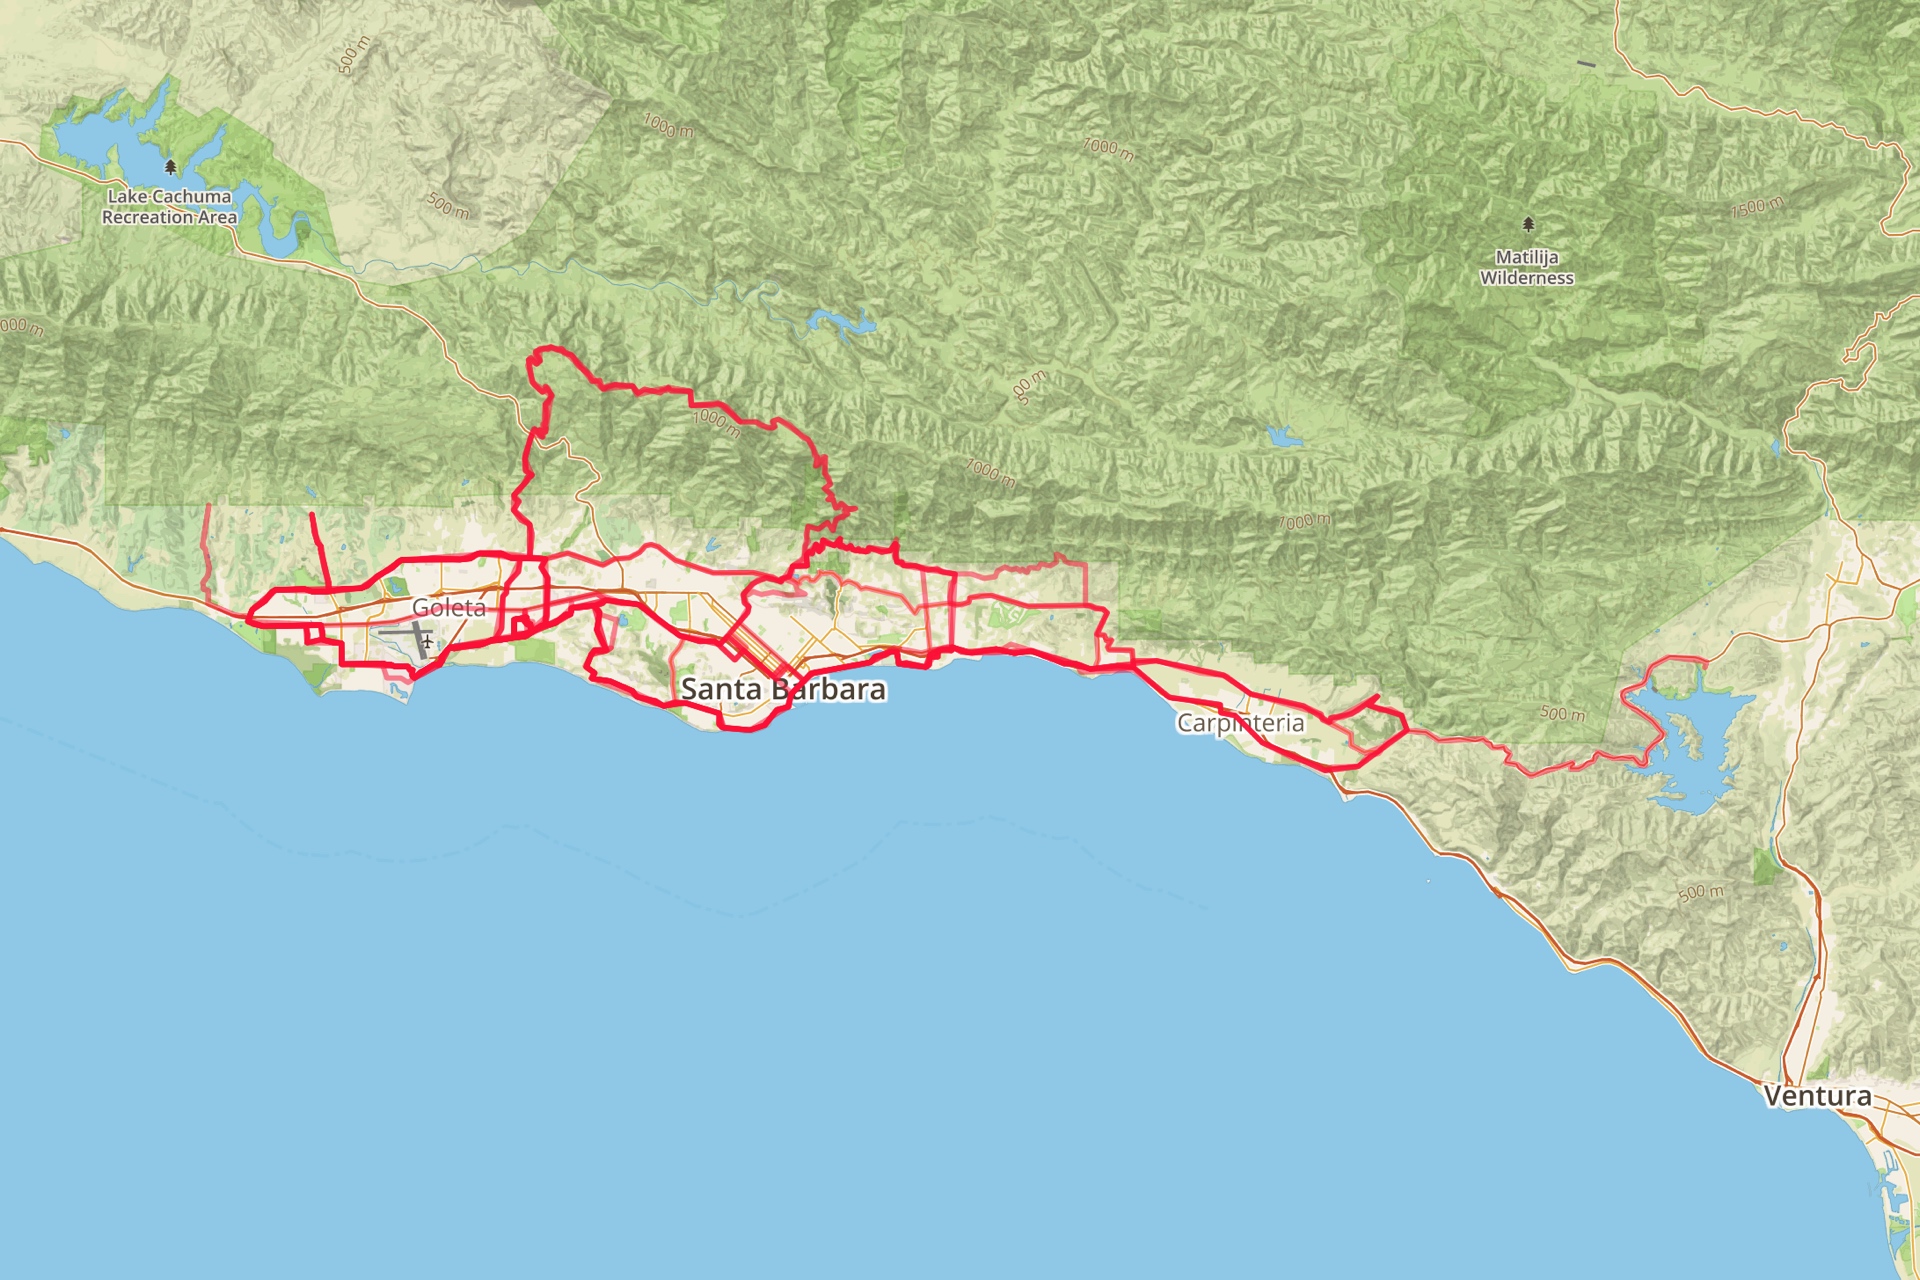
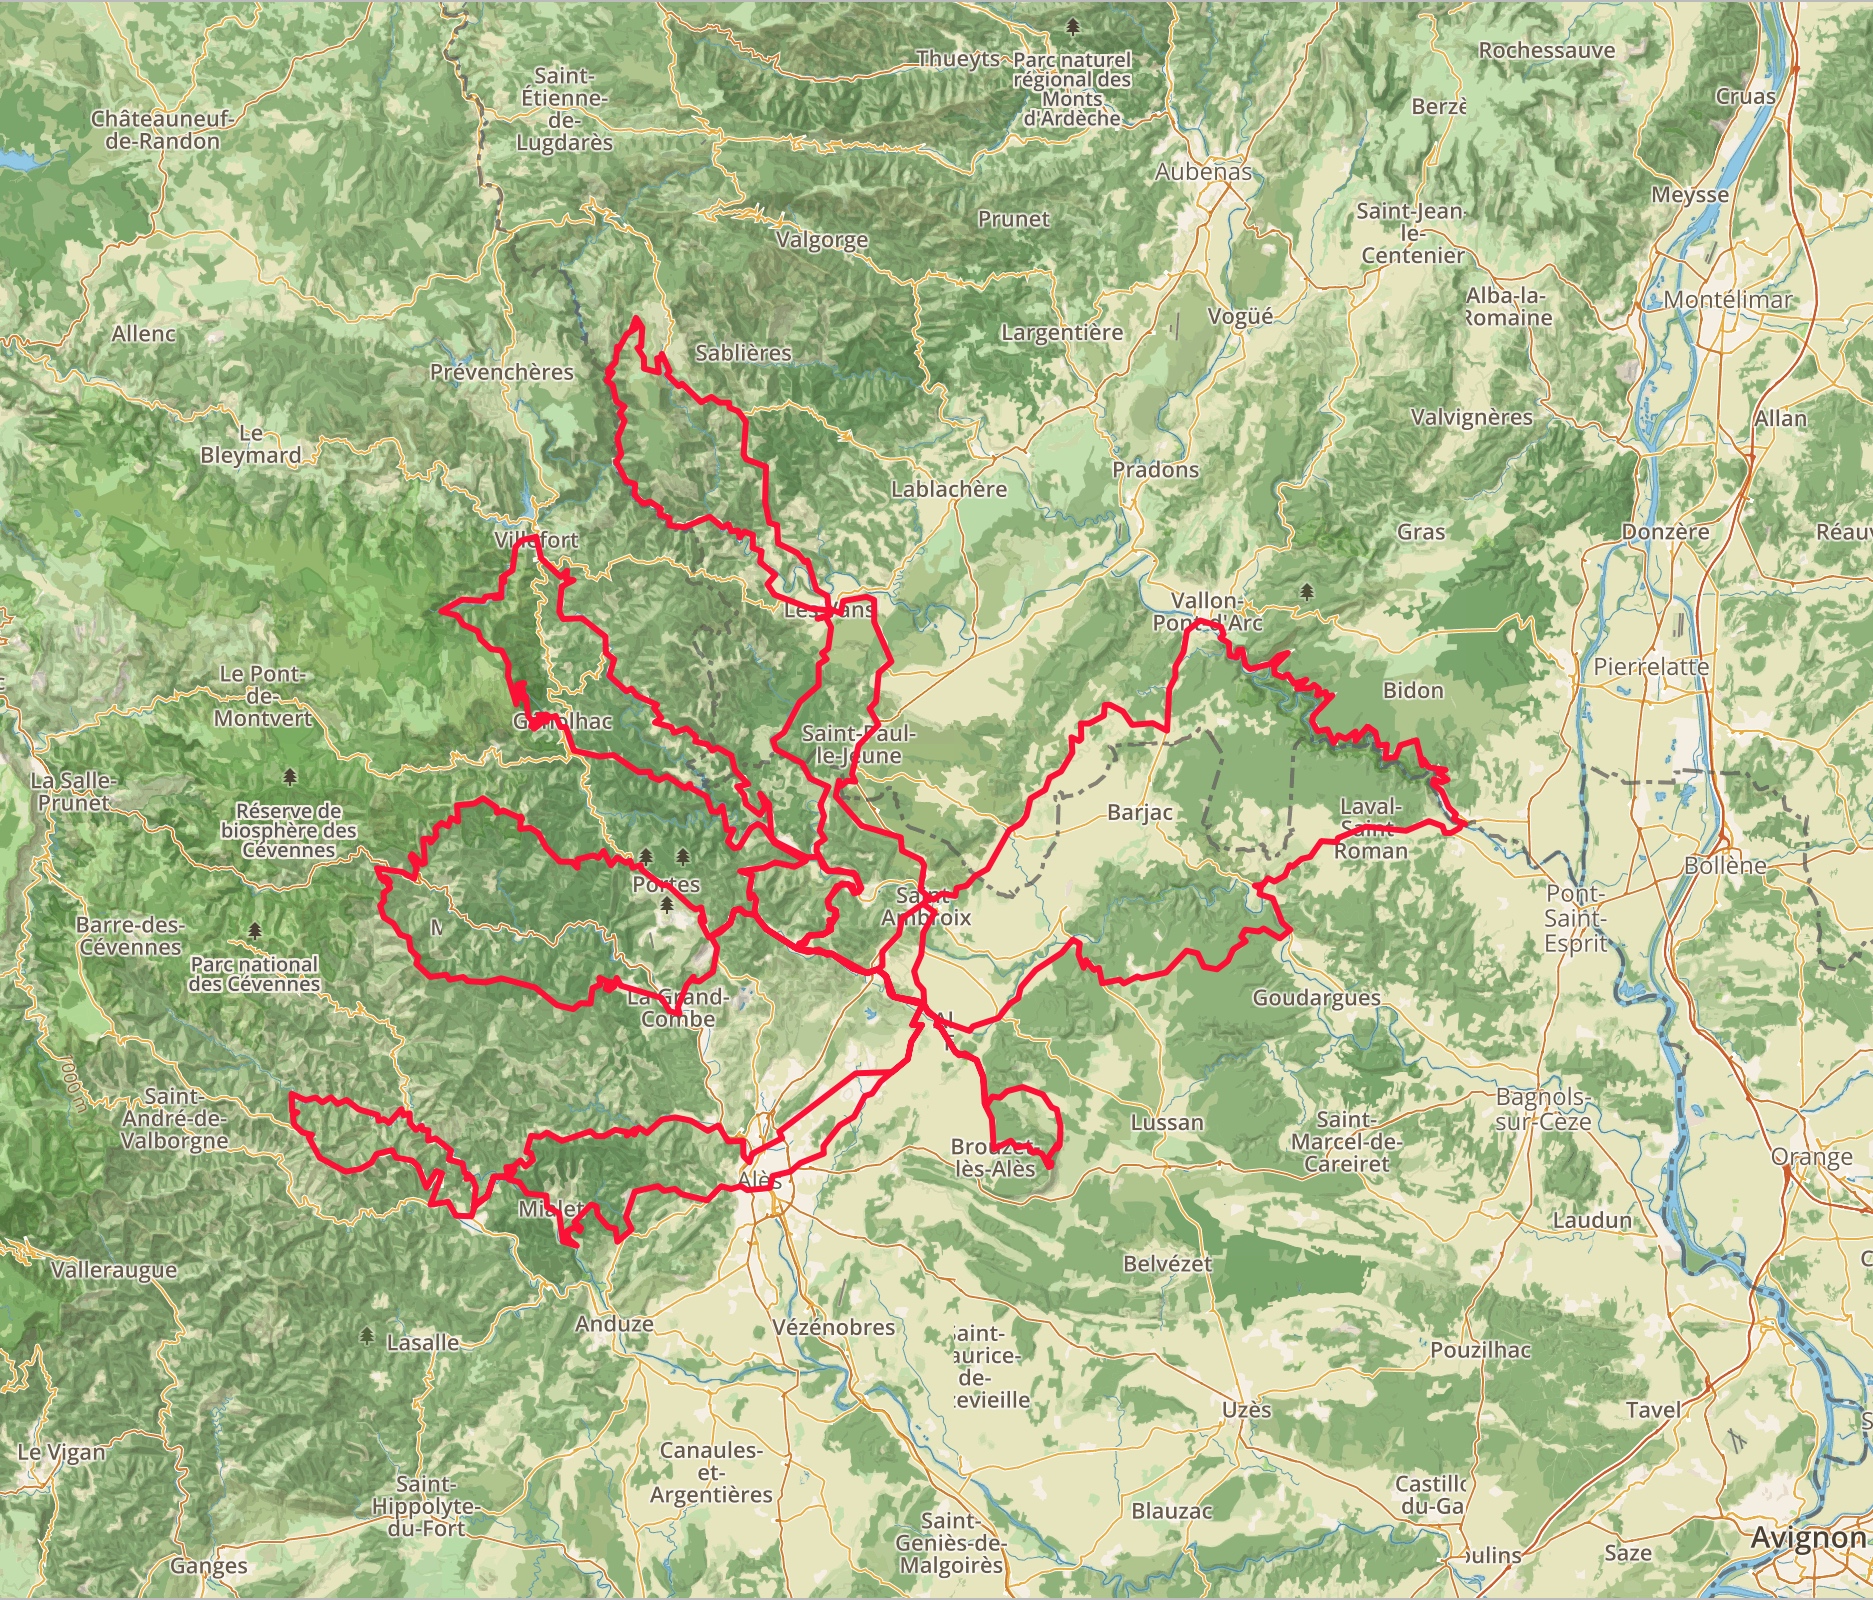
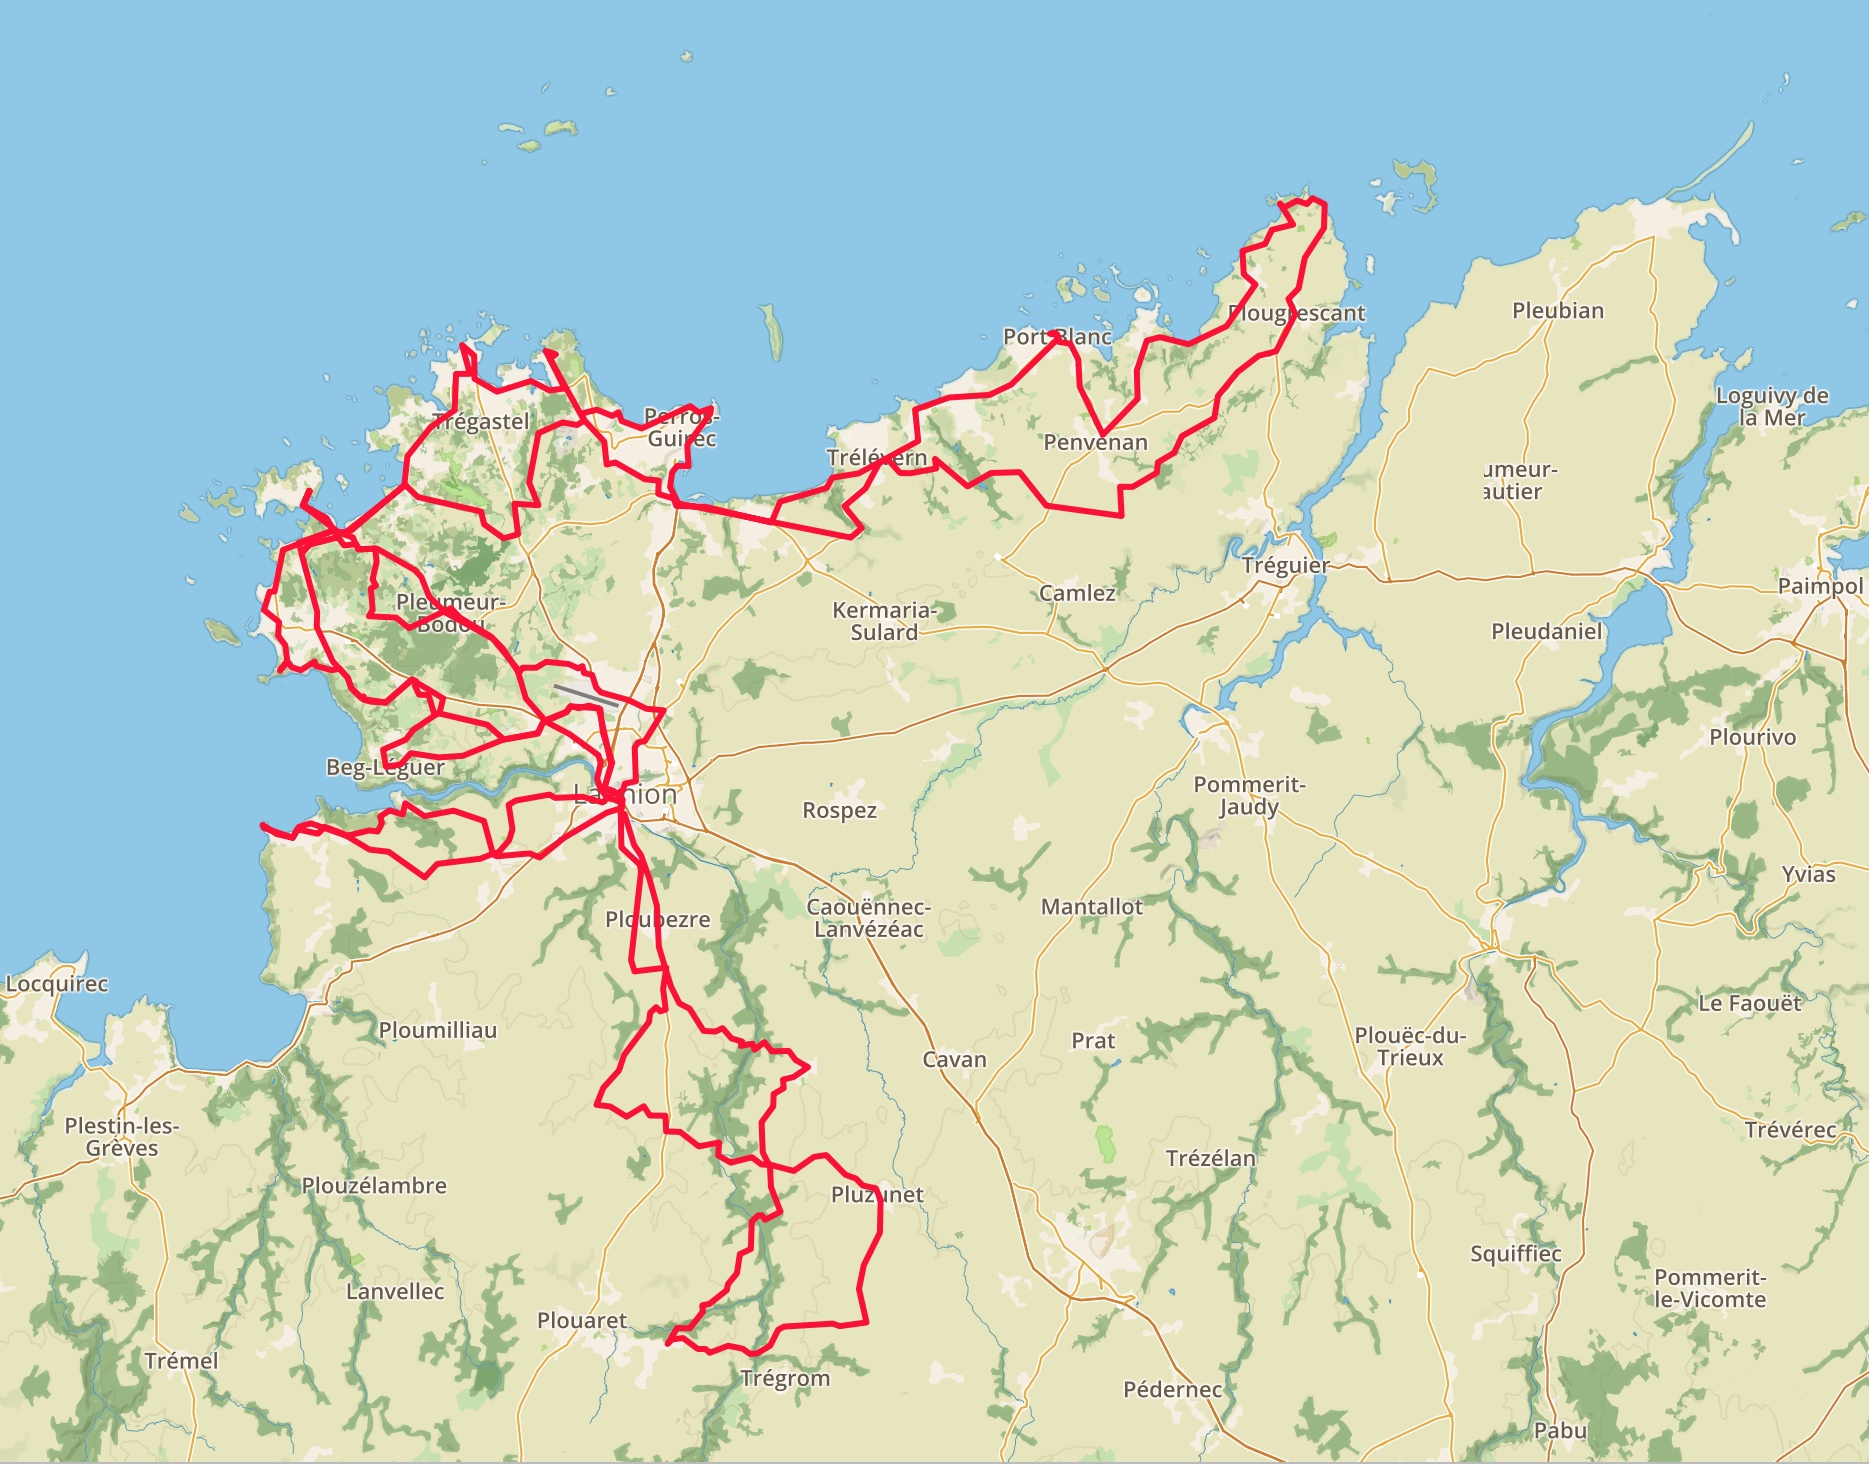
As usual I had no real plans for the year, but I still managed to make it somewhat special. First of all, I had quite a few nice rides in the Ardennes (and the Eifel, once even Clio joined me for a while along the Vennbahn), maybe not as many as I wanted, but still much more than the previous years. I hope to continue this trend in 2019 too, because I know the roads around Leuven way too well (and as I get older more experienced I seem to tolerate the crap infrastructure and the intolerant drivers of Flanders less and less). Furthermore, I had a really enjoyable (except maybe for that crazy thunderstorm with hail) cycling holiday in France with a small group of friends, and I also took the bike along to Bretagne where I made three nice morning rides (to make up for all those pancakes which we ate with Clio). Thanks to these non-local rides, I have ridden more on previously unseen roads than ever before. My biggest achievement this year was biking to the highest point of Belgium and the highest point of the Netherlands alone, which is now my longest solo ride with 306 km and 3057 m elevation gain (and by duration also my longest ride – including group rides too – with 11 hours and 32 minutes). Finally, my latest achievement is completing the Rapha Festive 500 in five consecutive days (I did it in 6 non-consecutive days back in 2015), being amongst the first thousand people who have crossed the threshold :)
The raw numbers for my cycling – without the daily commutes of course – in 2017:
Total distance: 12704 km
Total elevation gain: 101385 m
Total time: 460 h 31 m
Activity count: 192 (over 155 days*, just like in 2017)
Average speed: 27.6 km/h
Average heart rate: I stopped wearing a HR strap, I only look at power now.
Average cadence: 87.5 rpm (but I have no sensor on my cross bike)
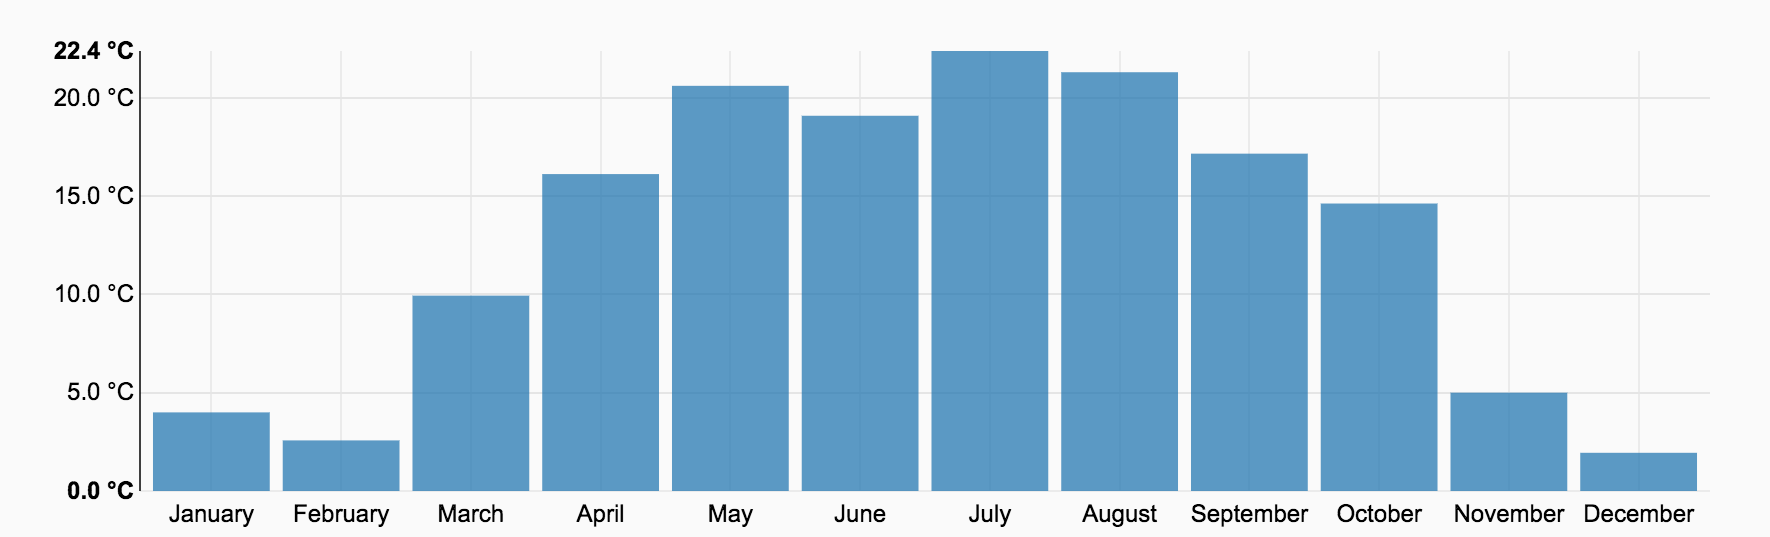
Average temperature: 13.2°C (coldest: December with 1.9°C, hottest: July with 22.4°C)
Total calories burned on the bike: 302730 cal
*Starting from the last days of July there were a lot of days when I did my training rides immediately before and/or after work, and on those days I rode my race bike also to work to save time, therefore creating days with two activities (of which one was most of the time less than 5 kilometres).
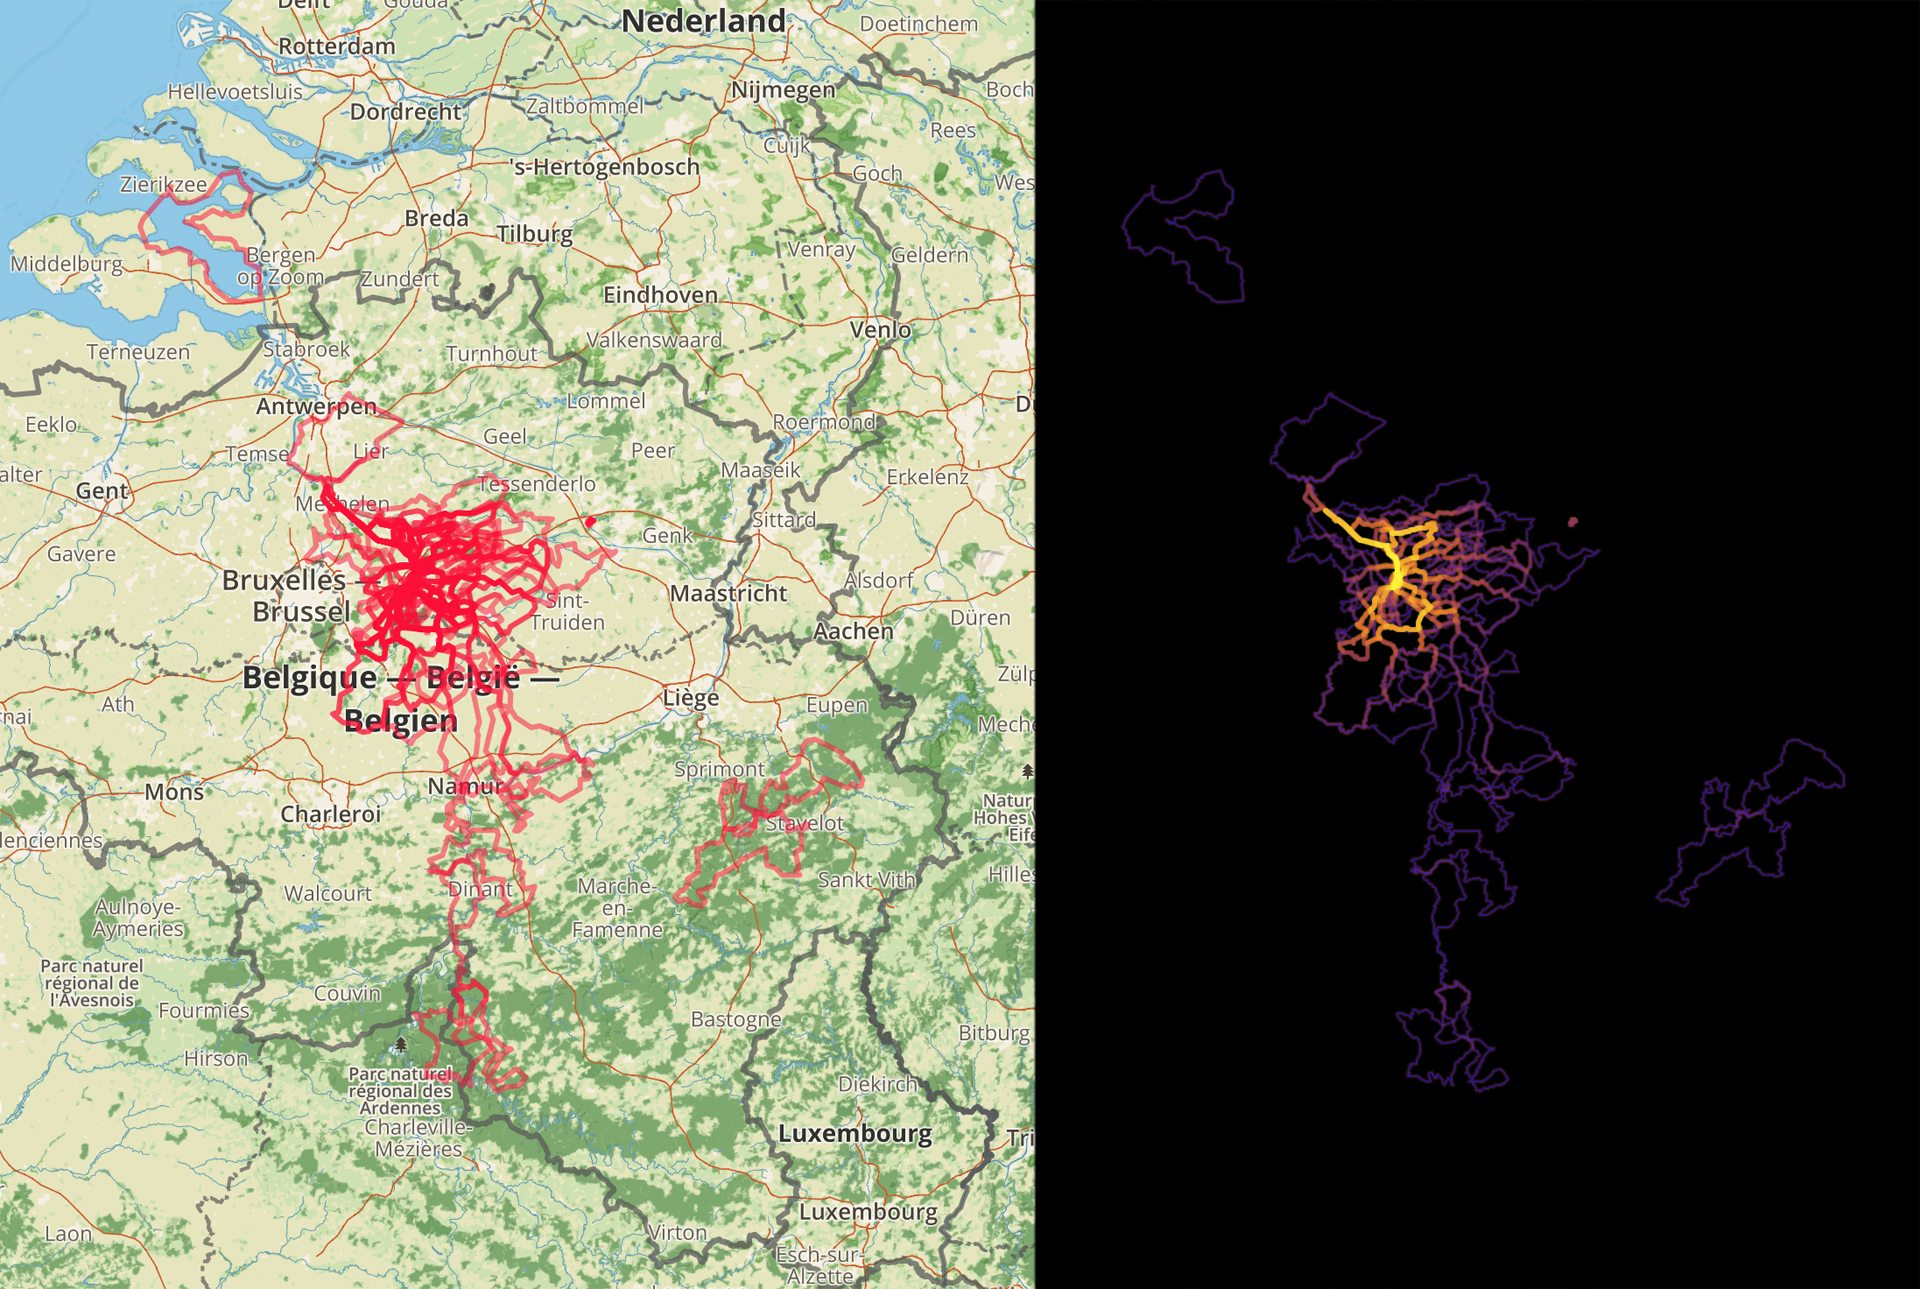
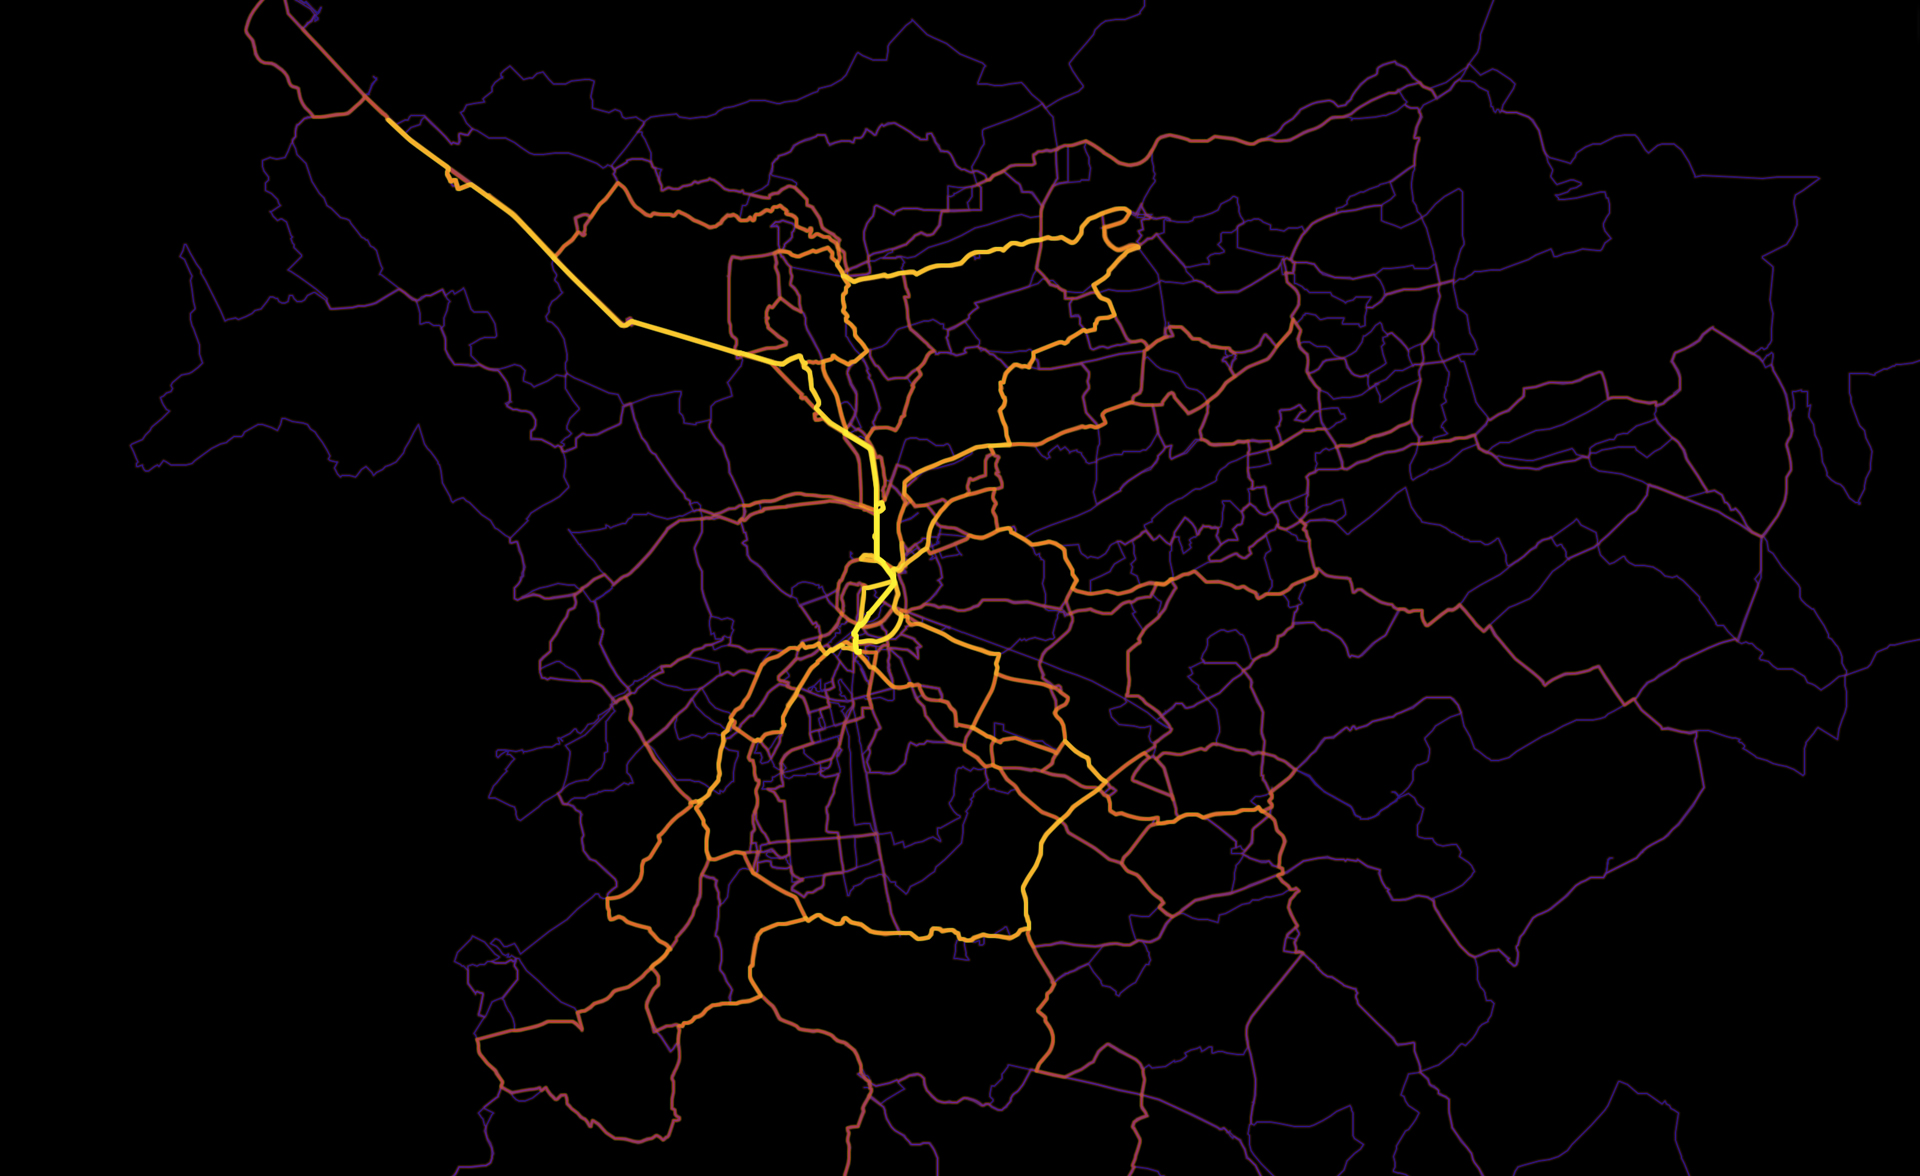
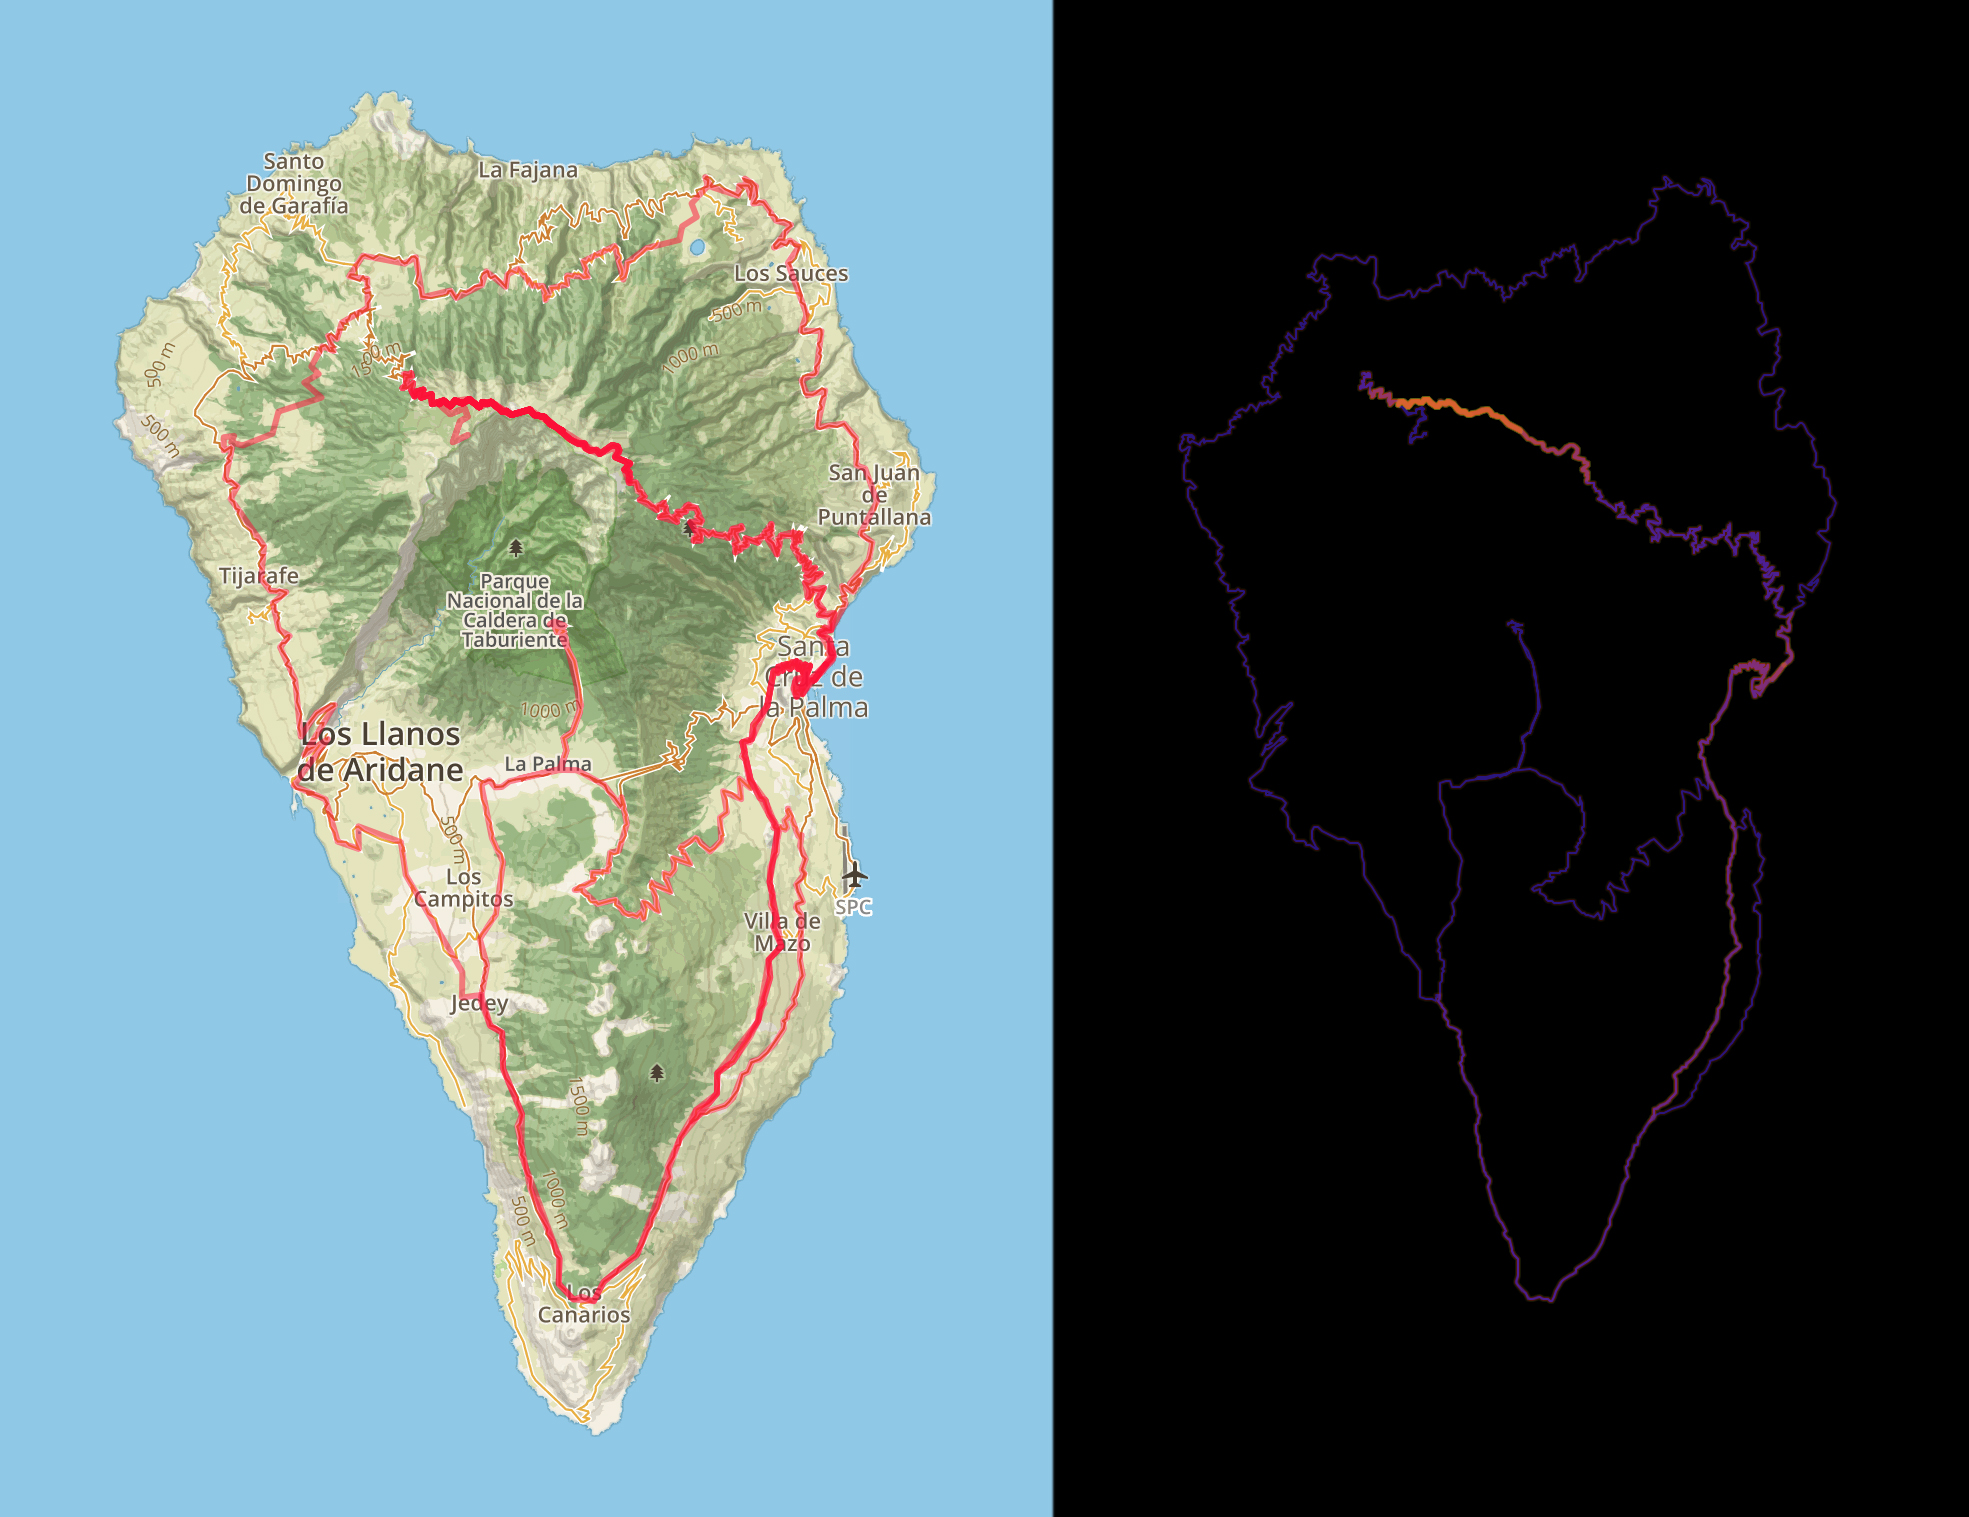
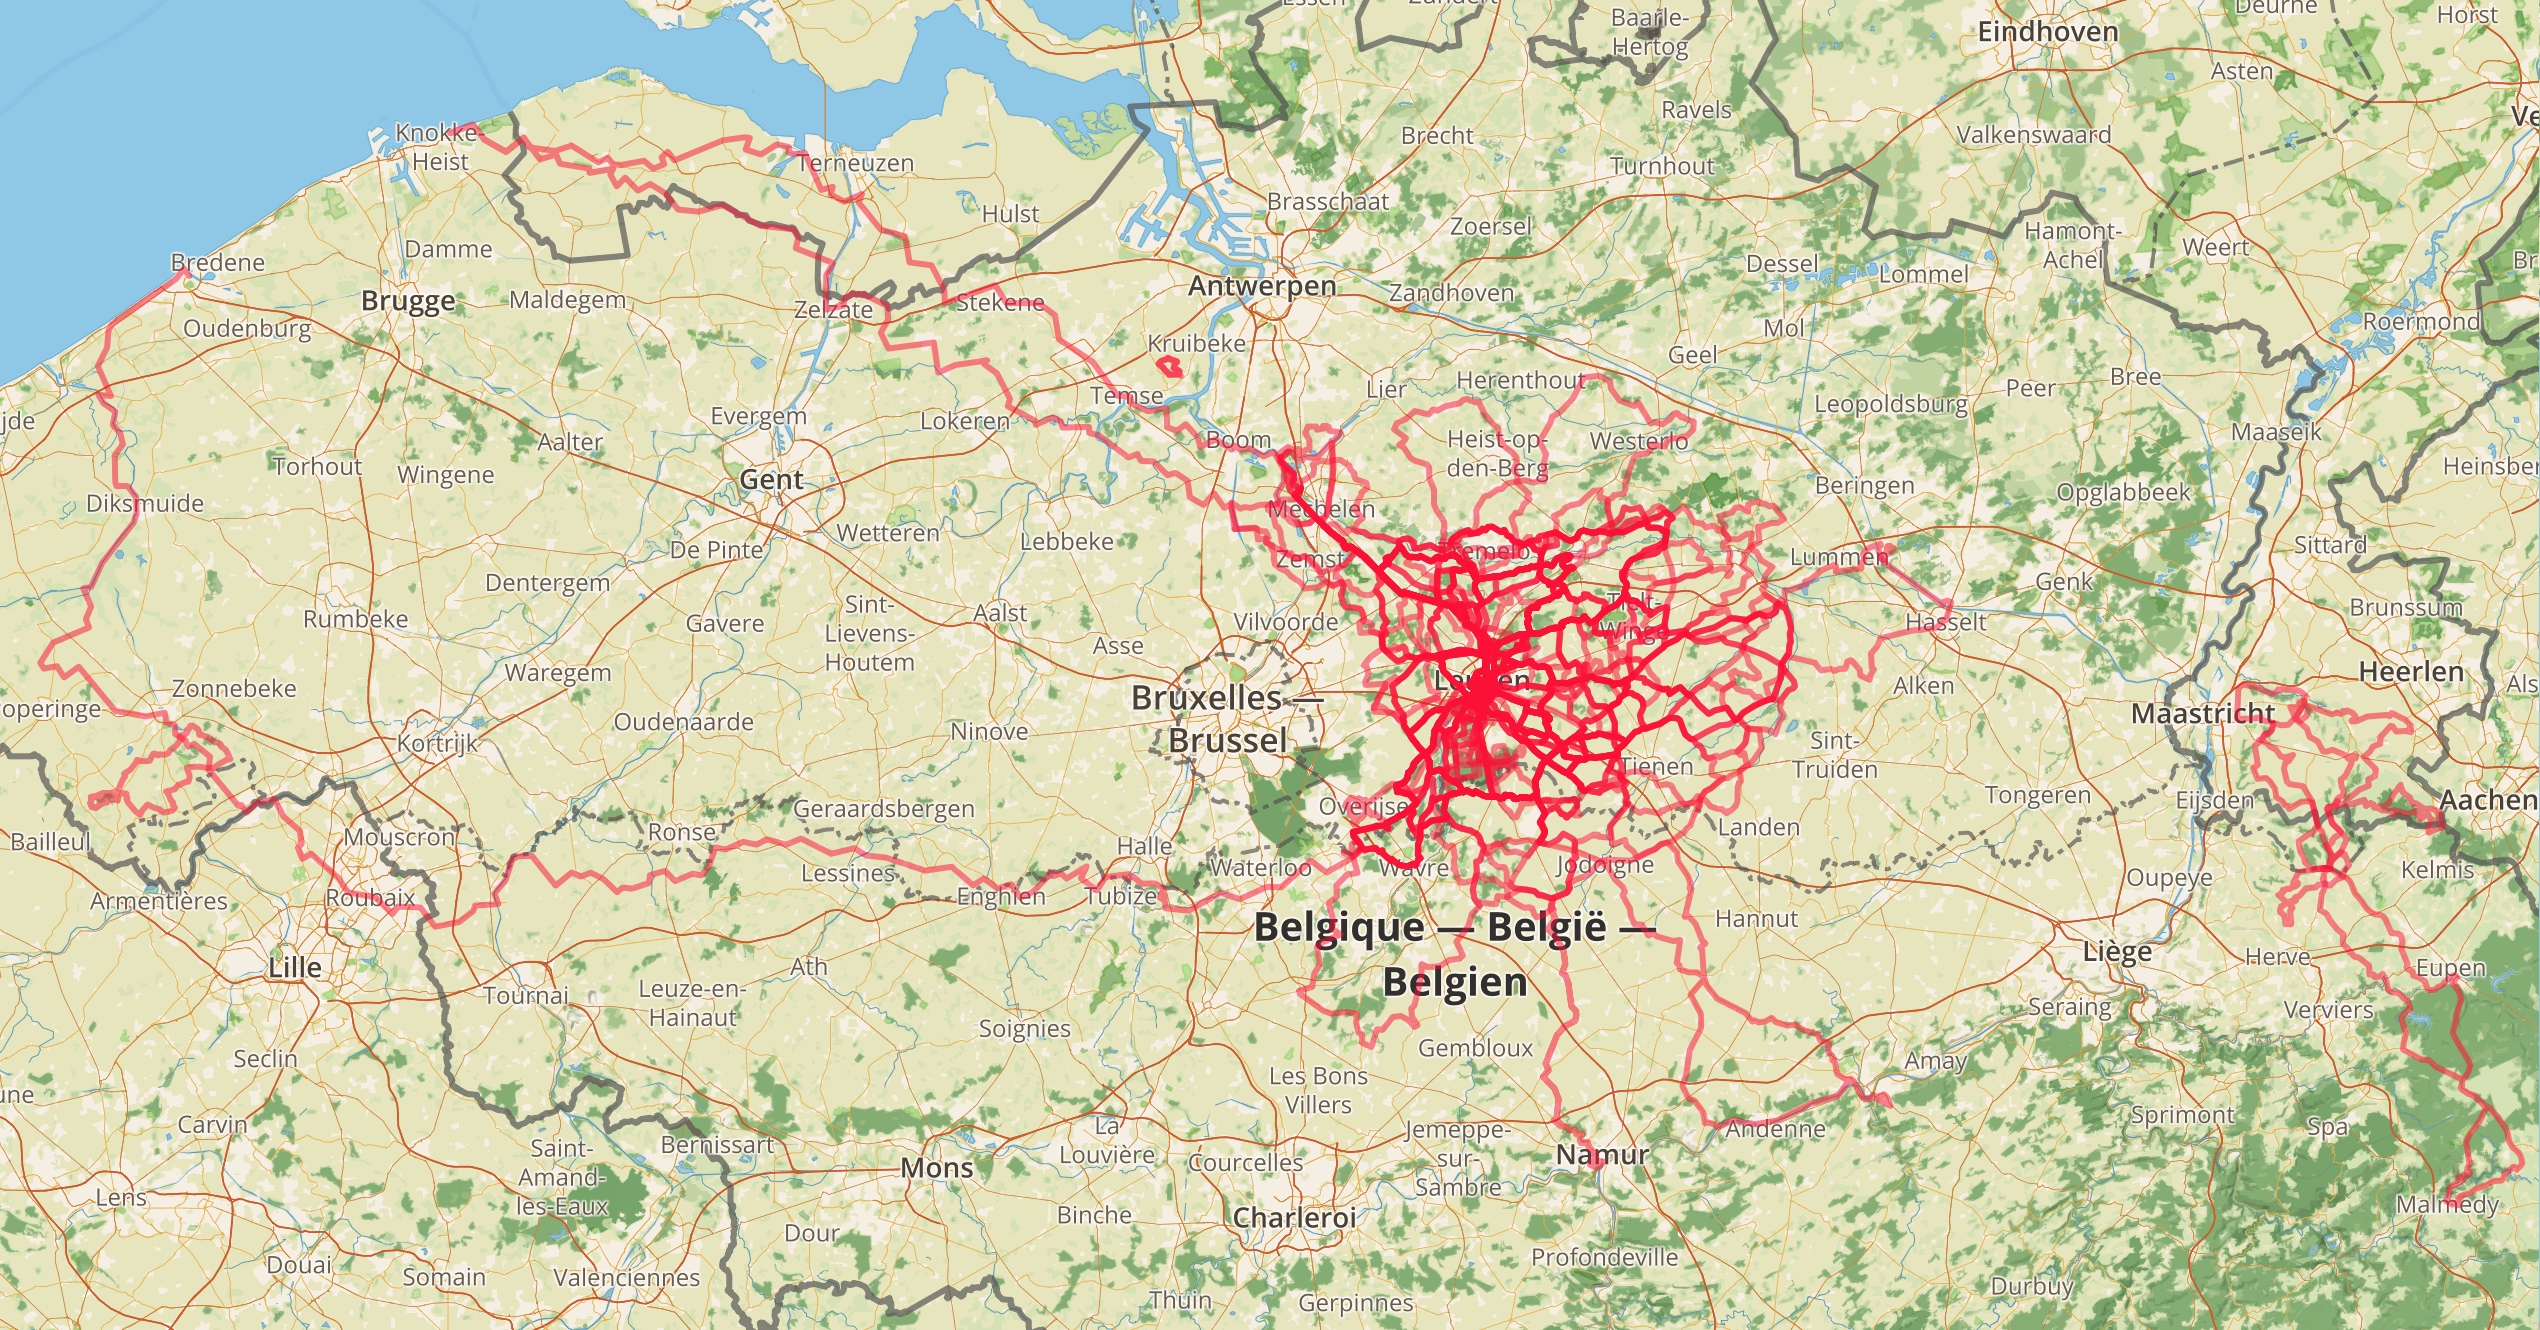
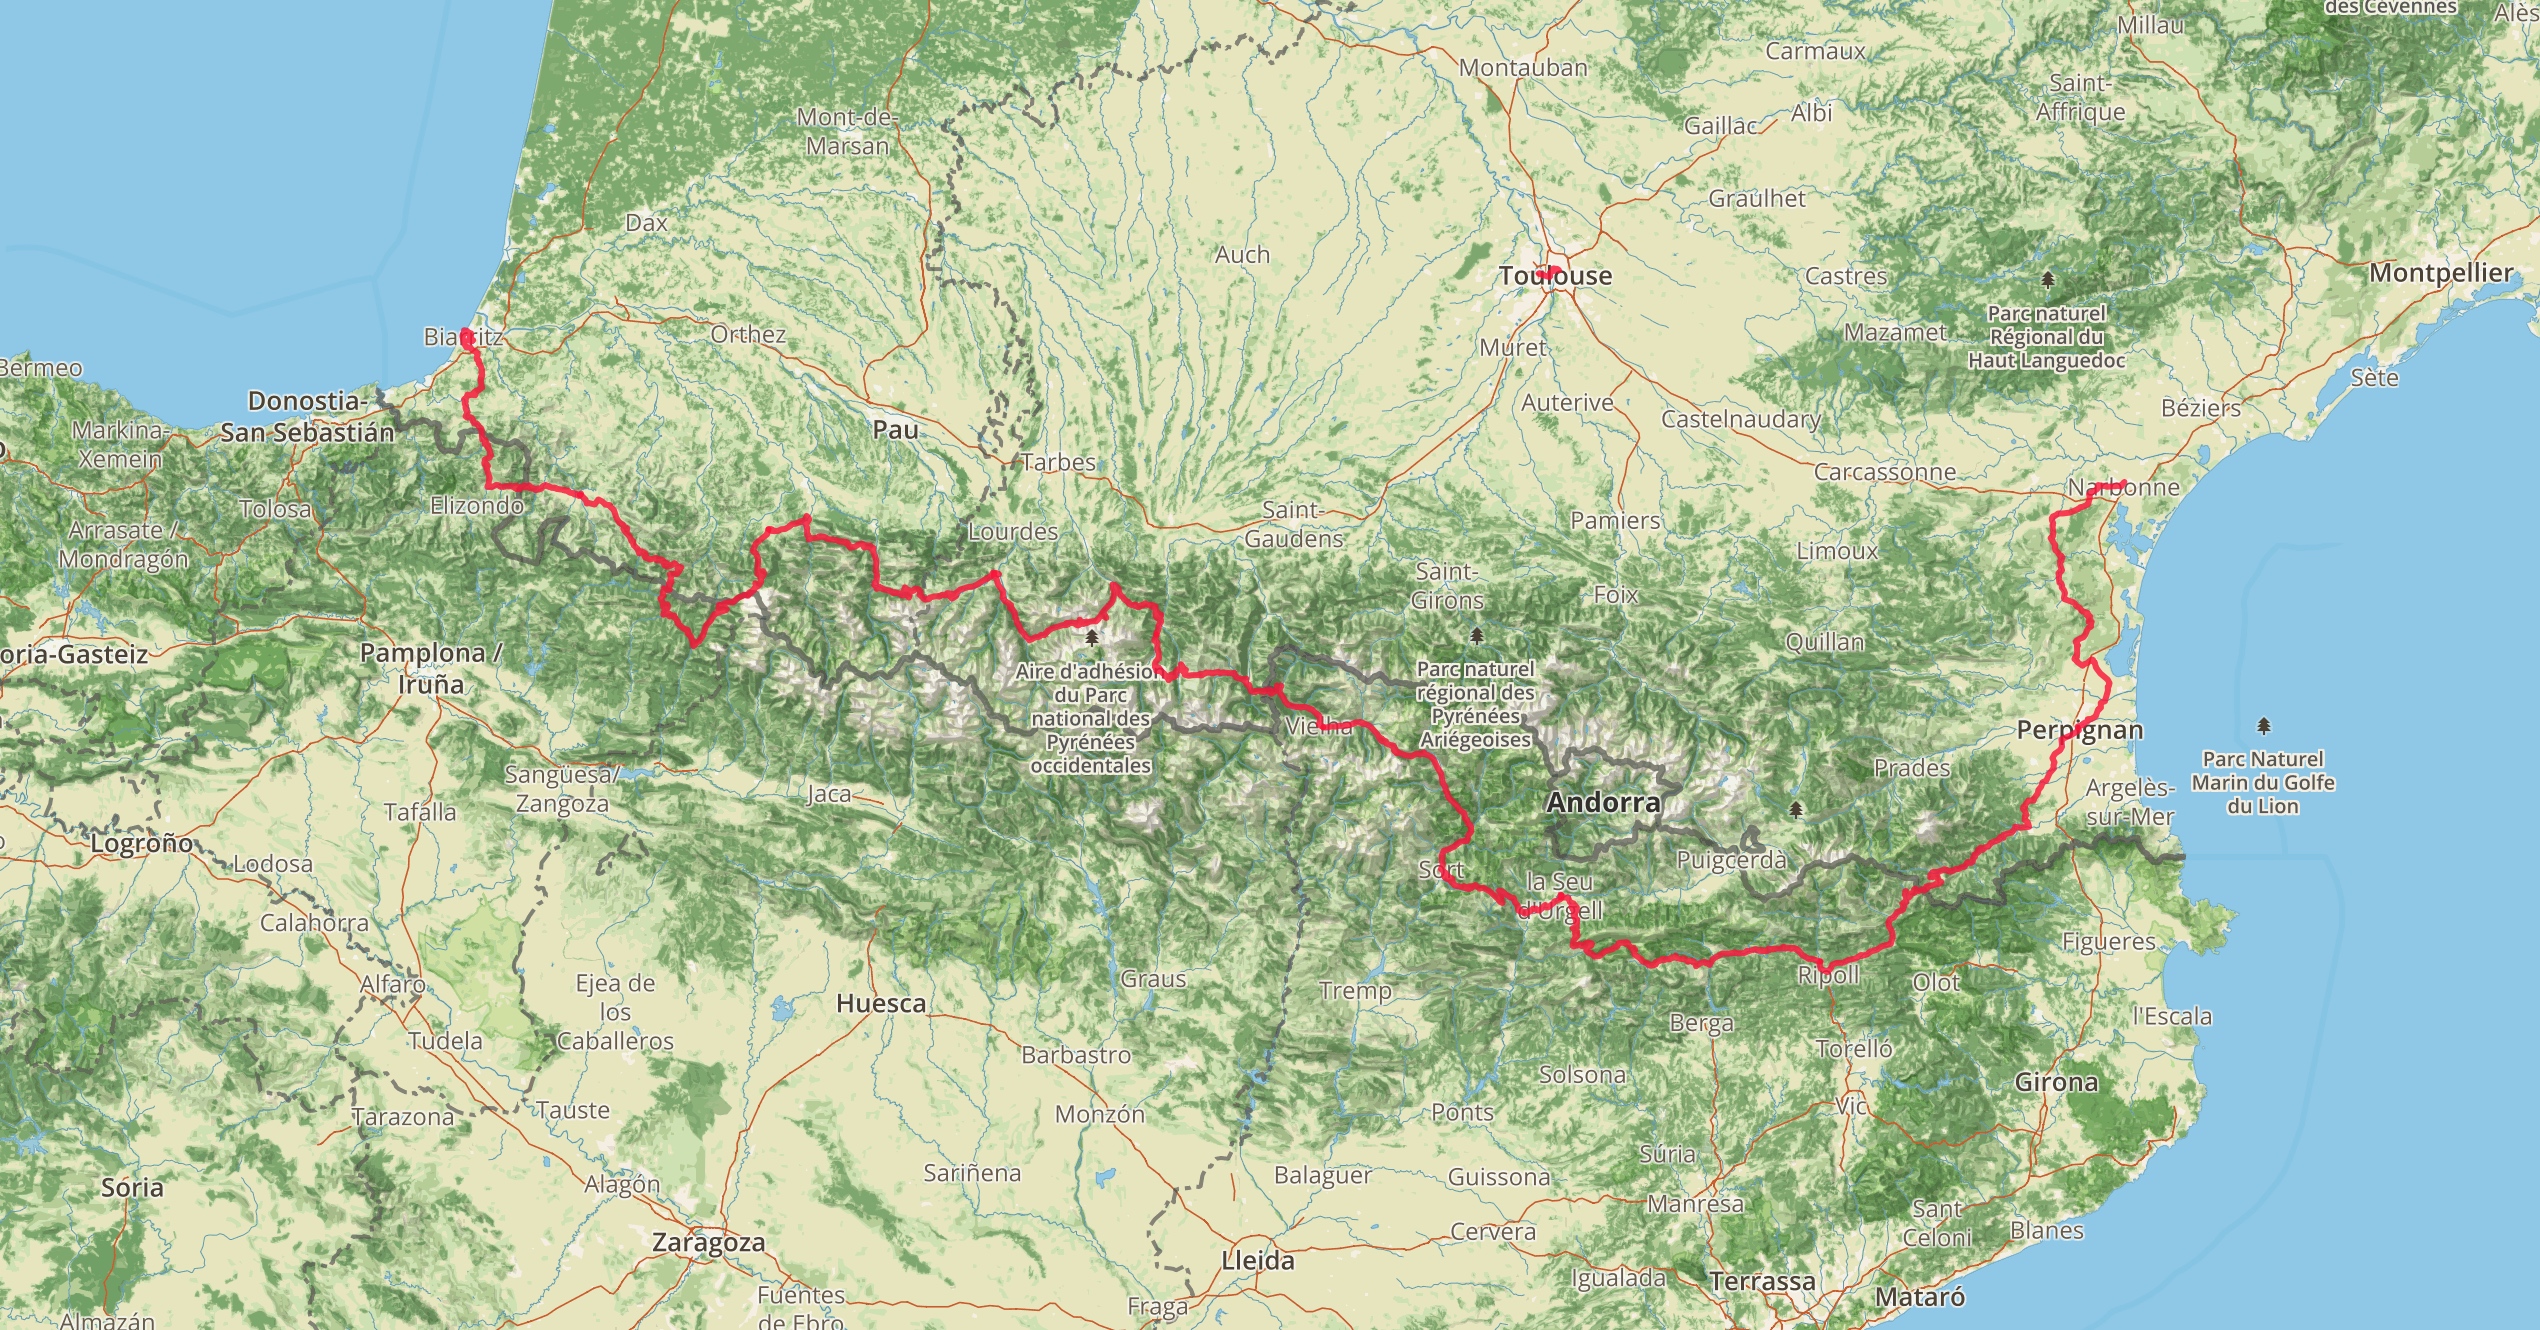
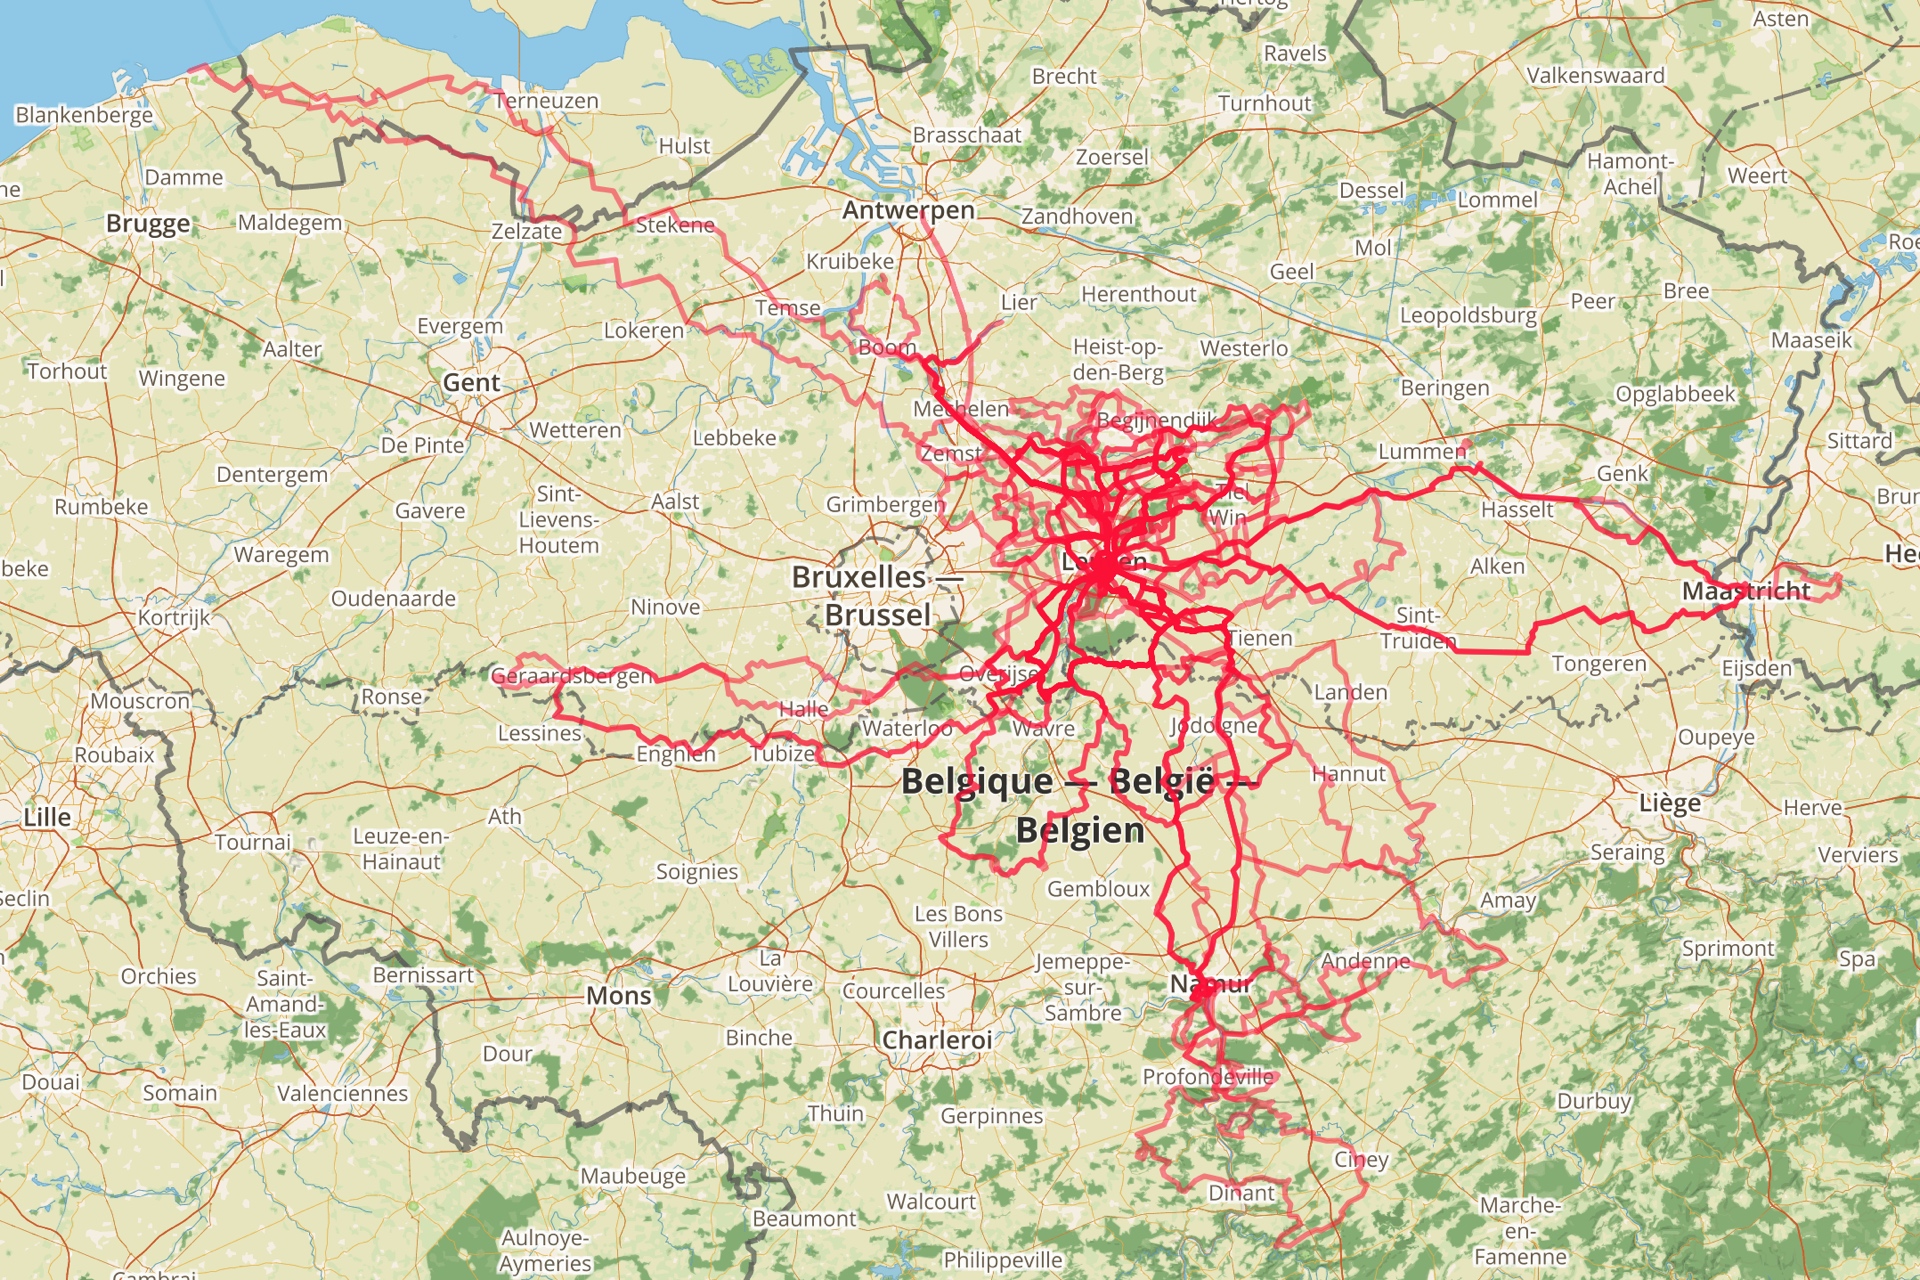
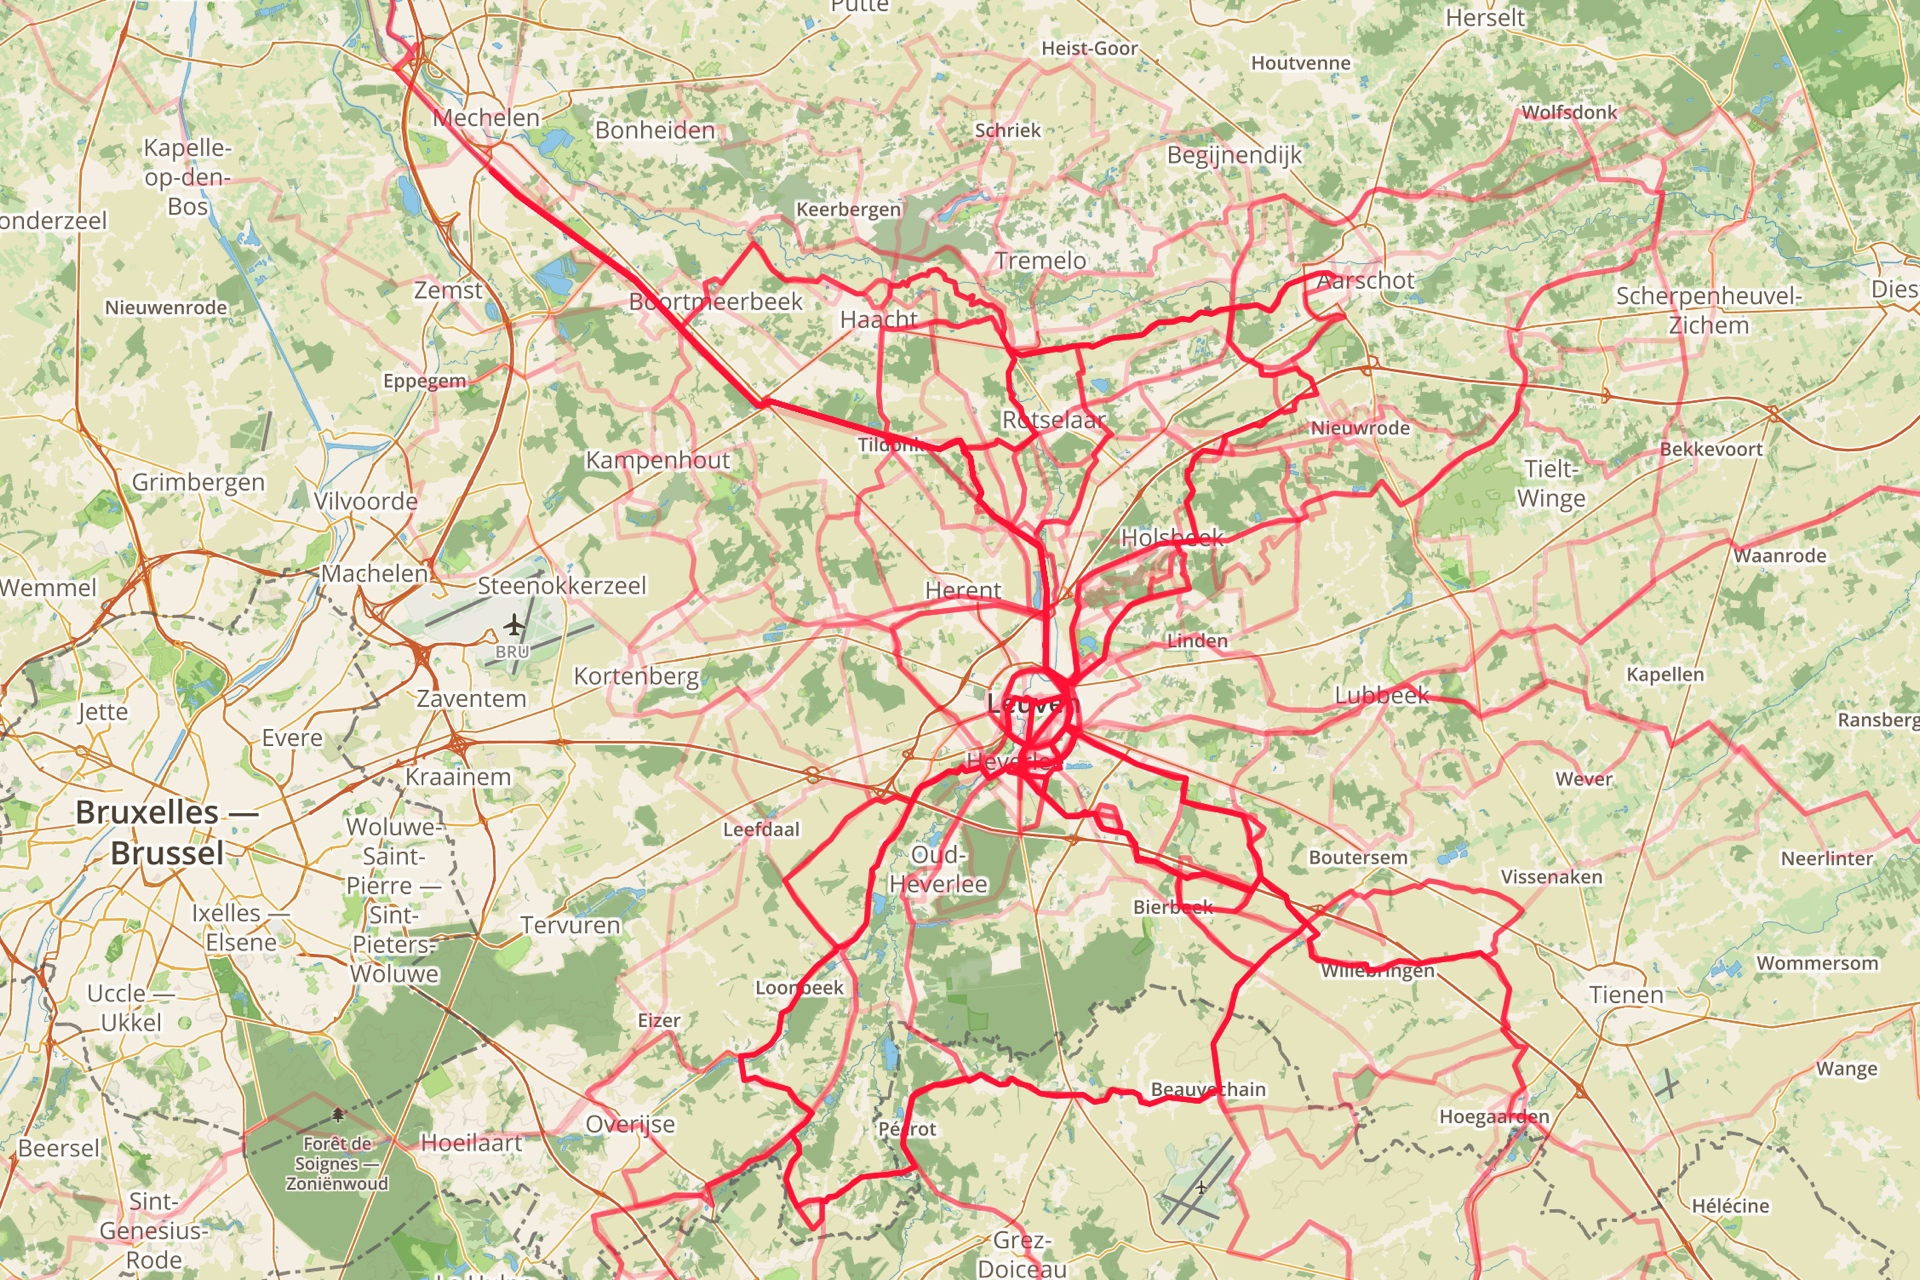
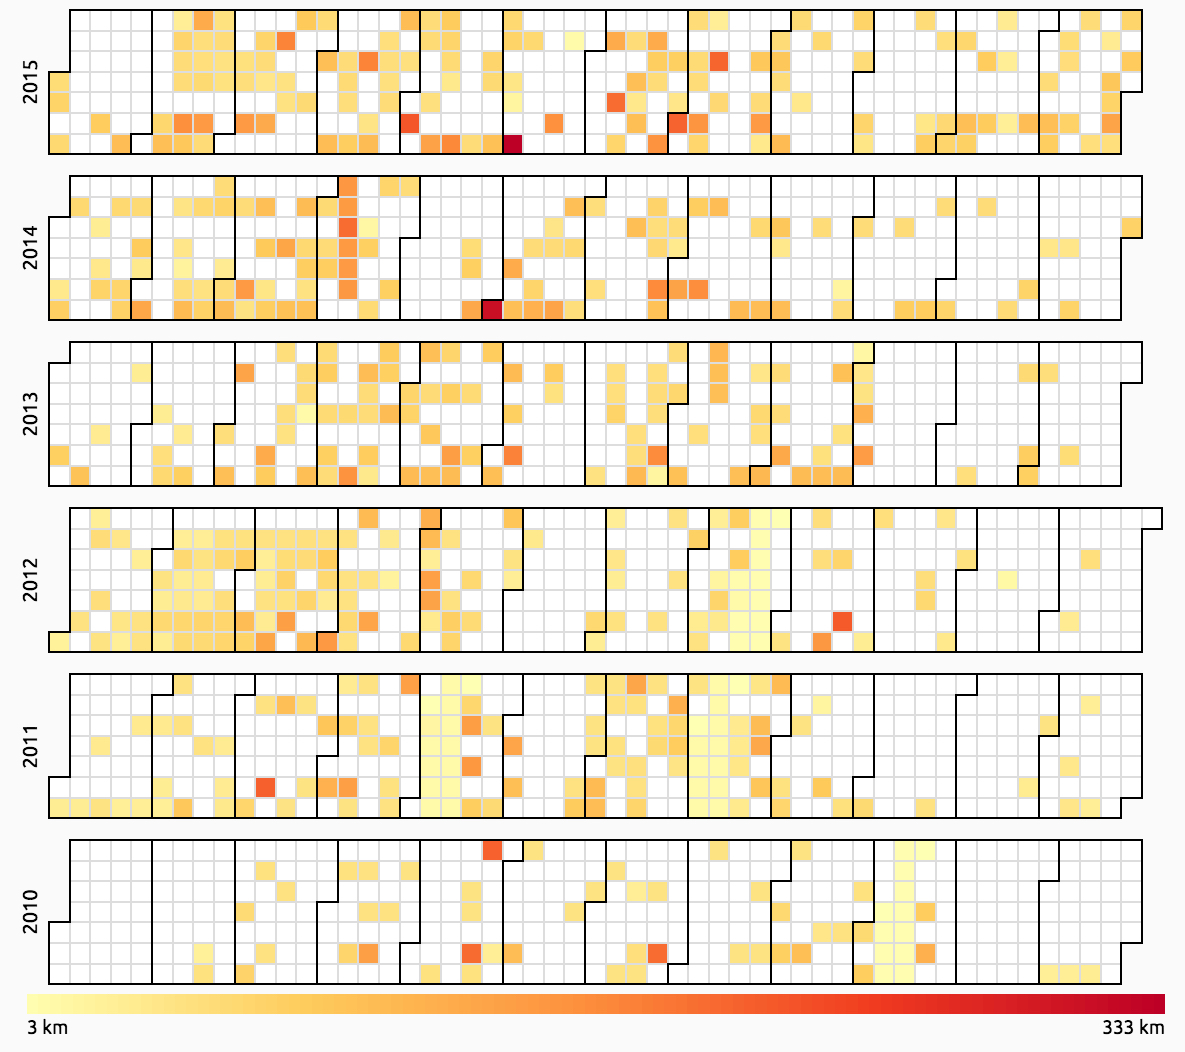
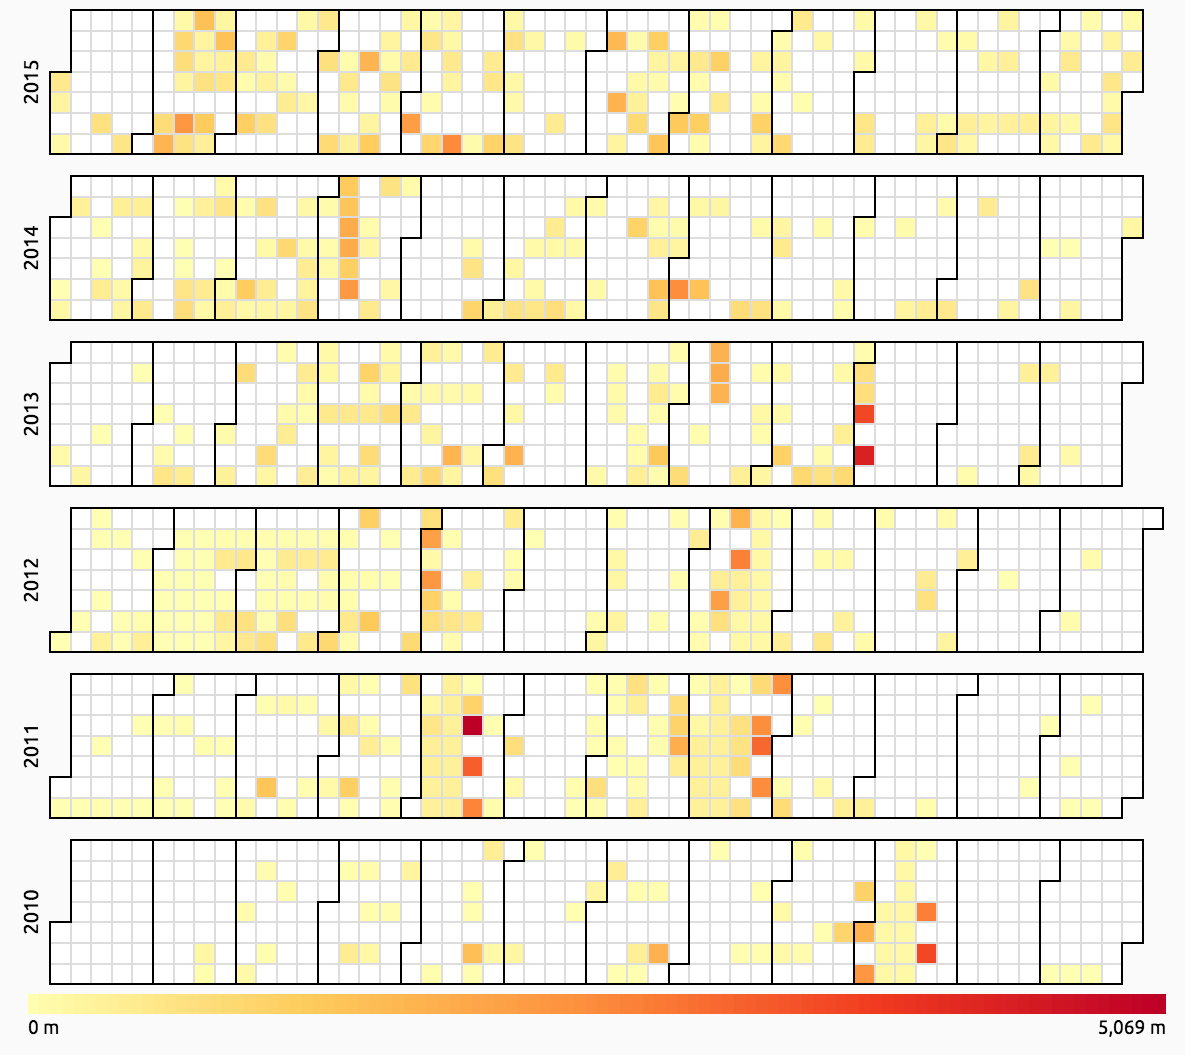
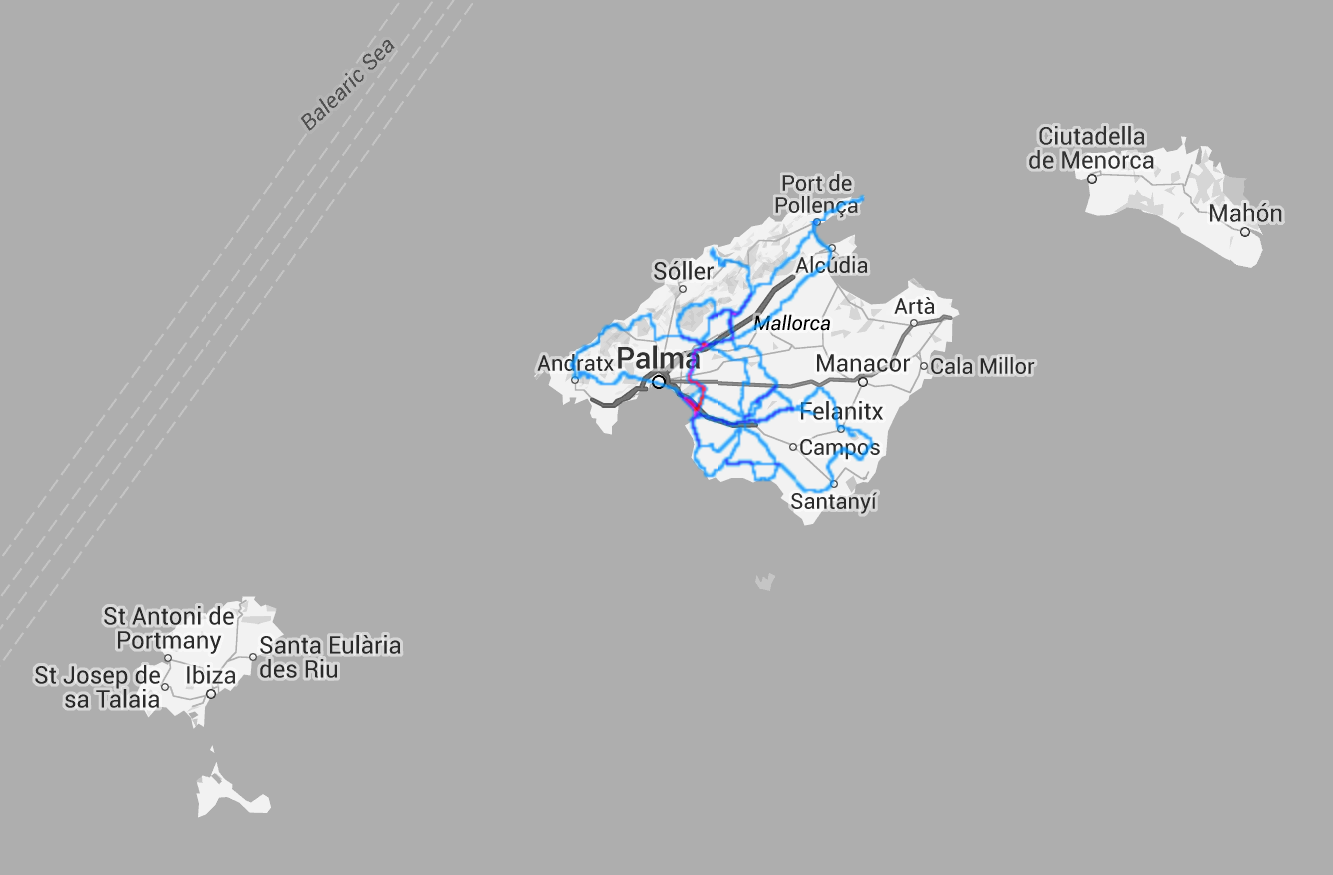
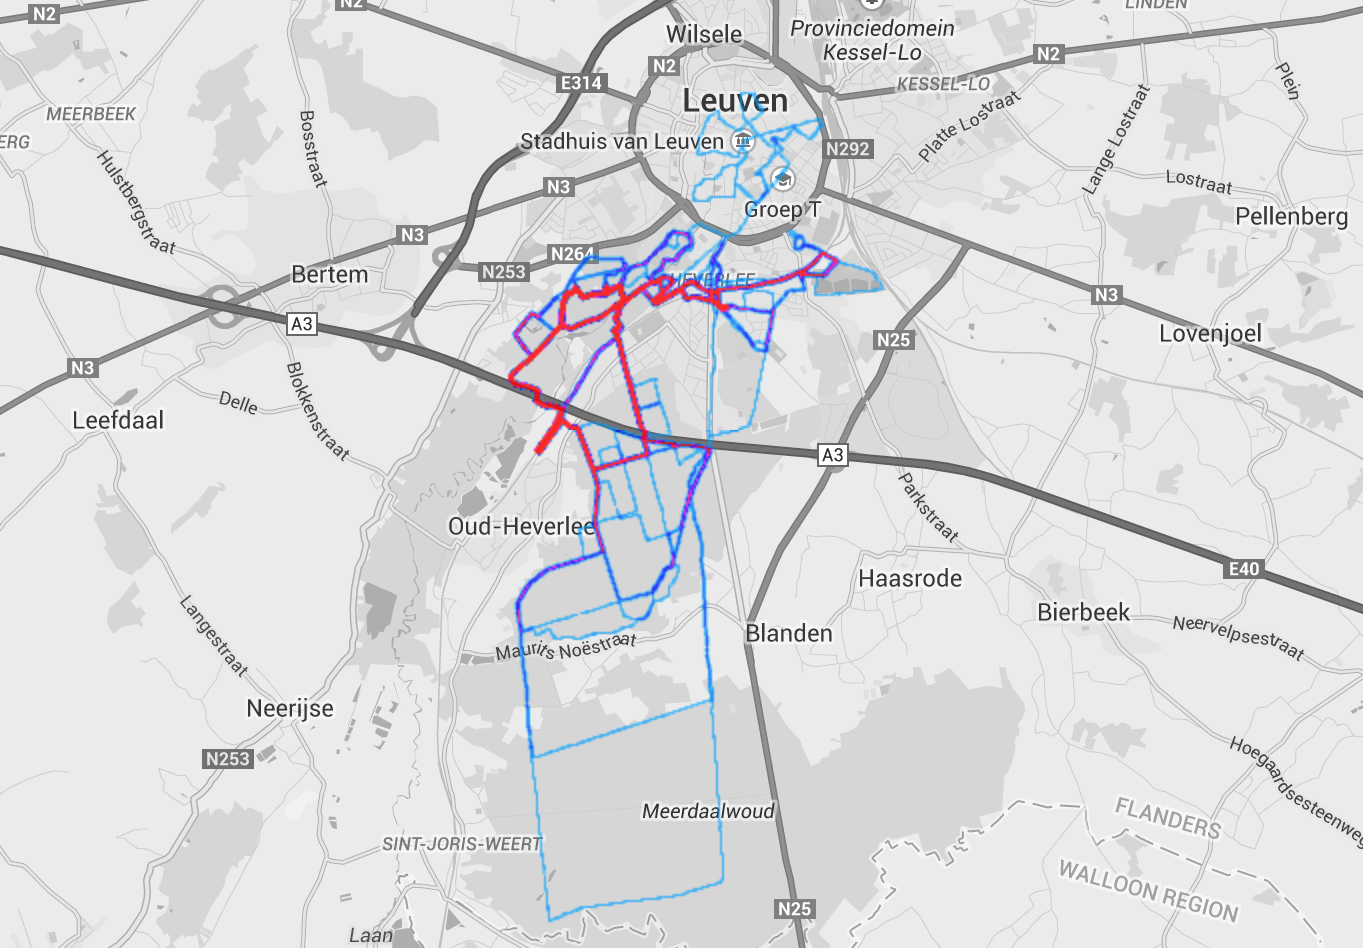
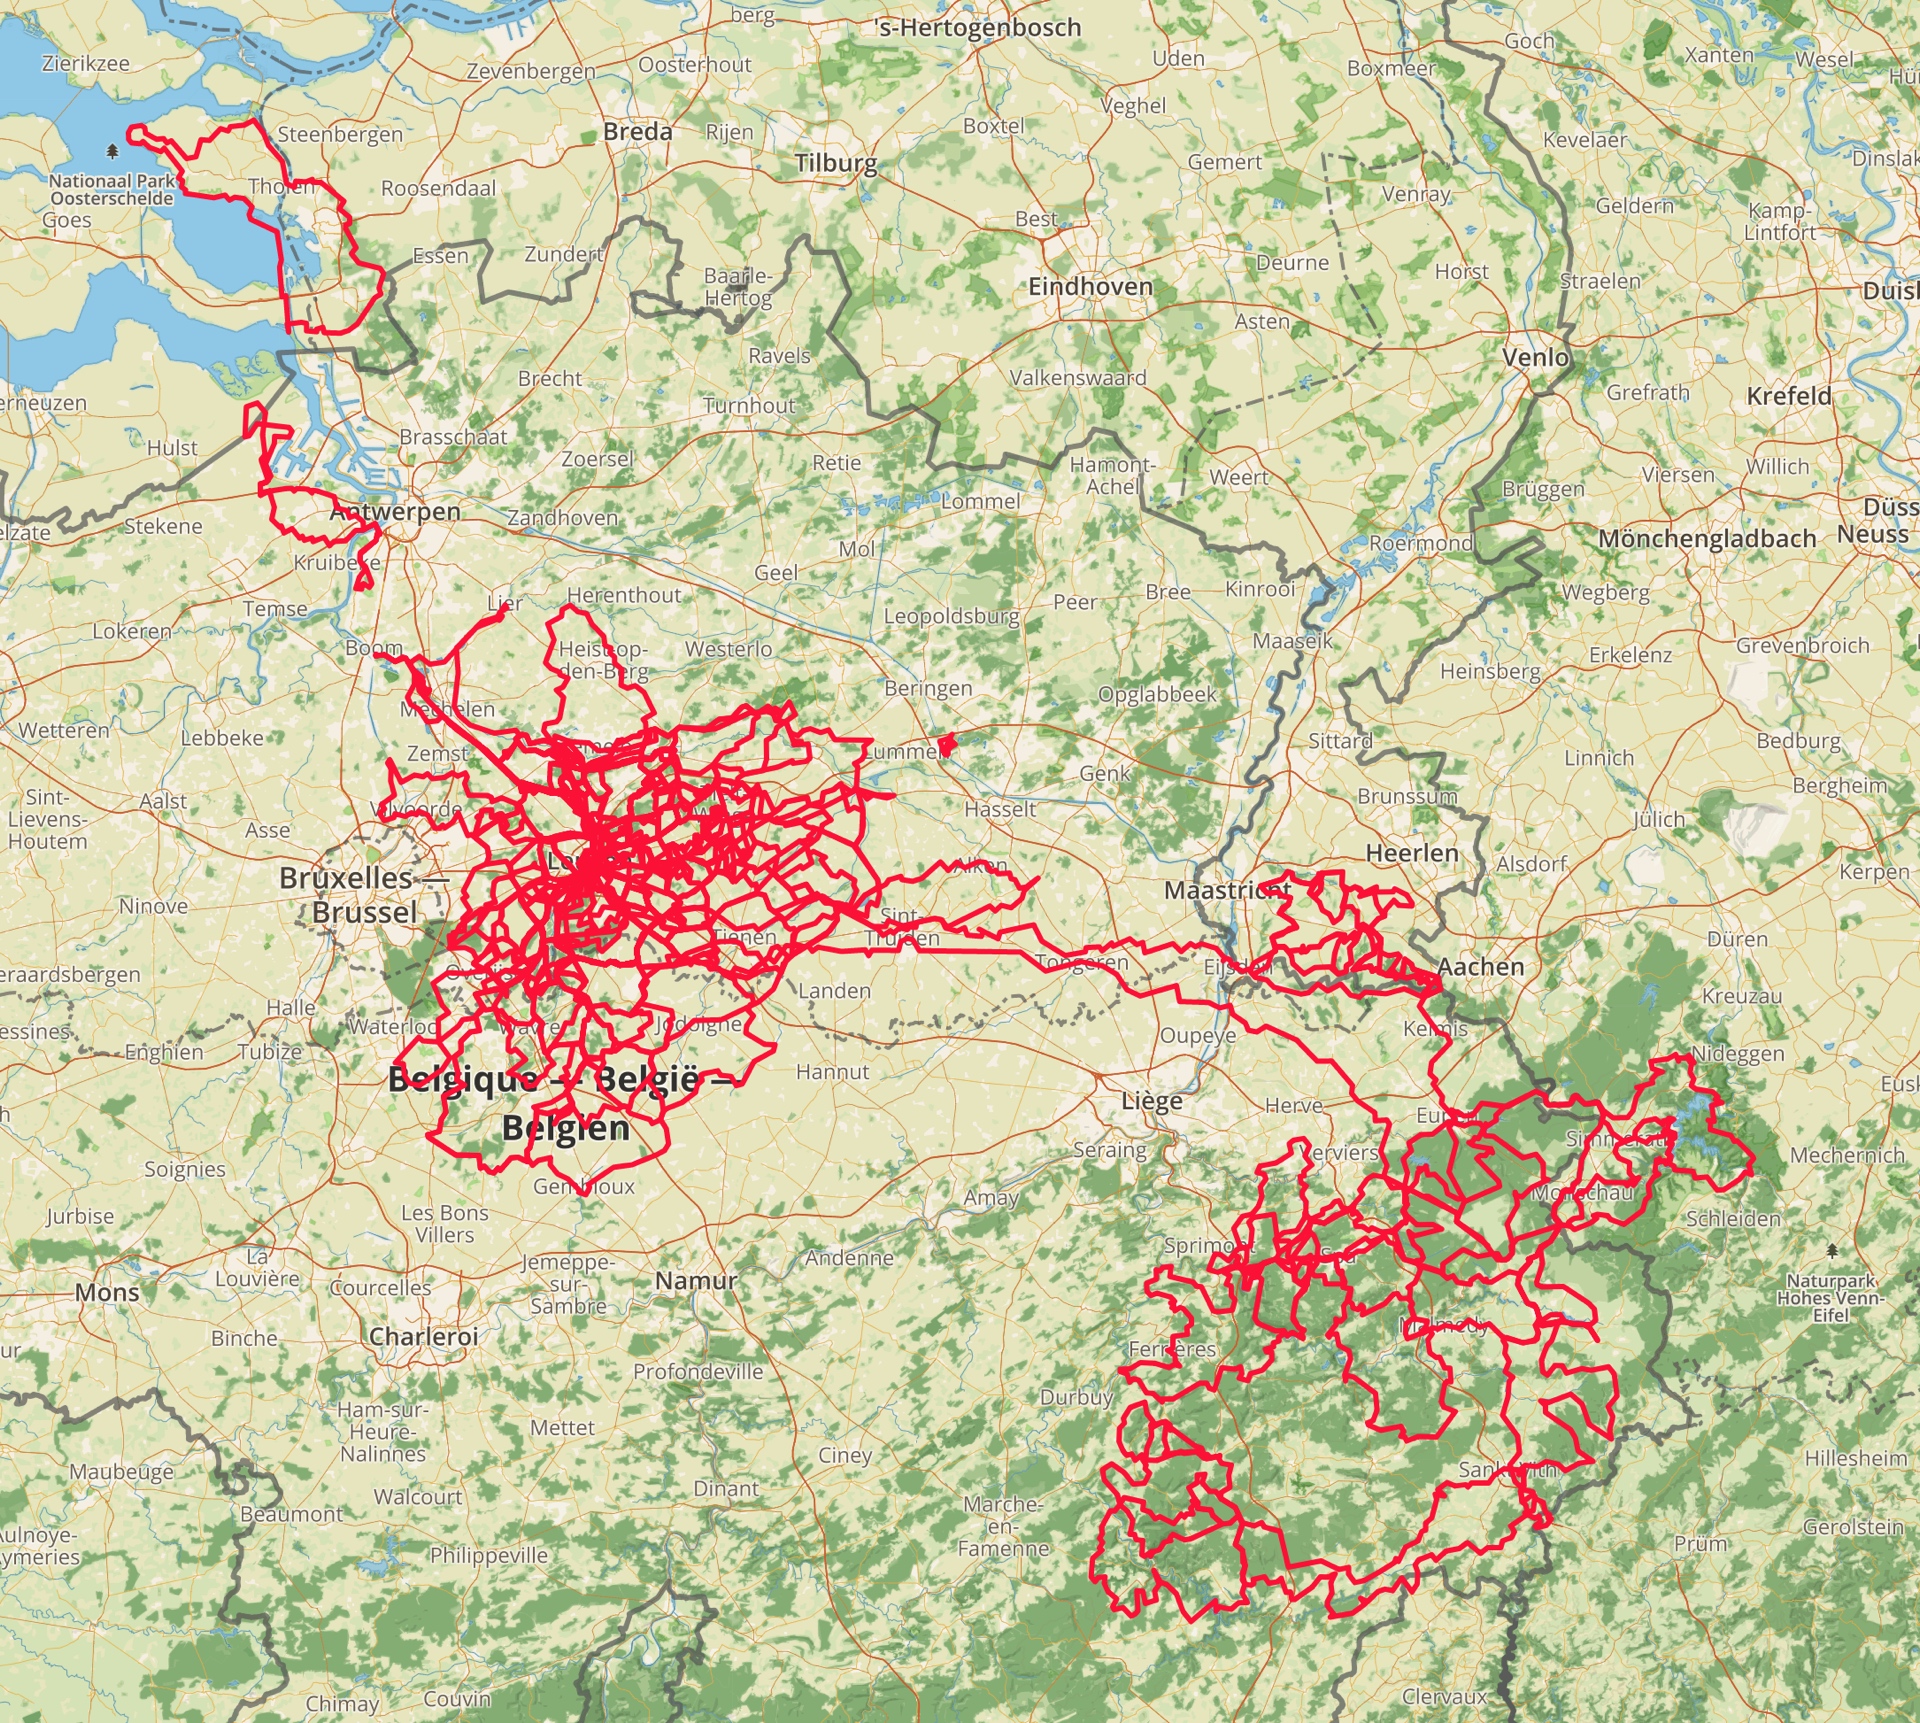
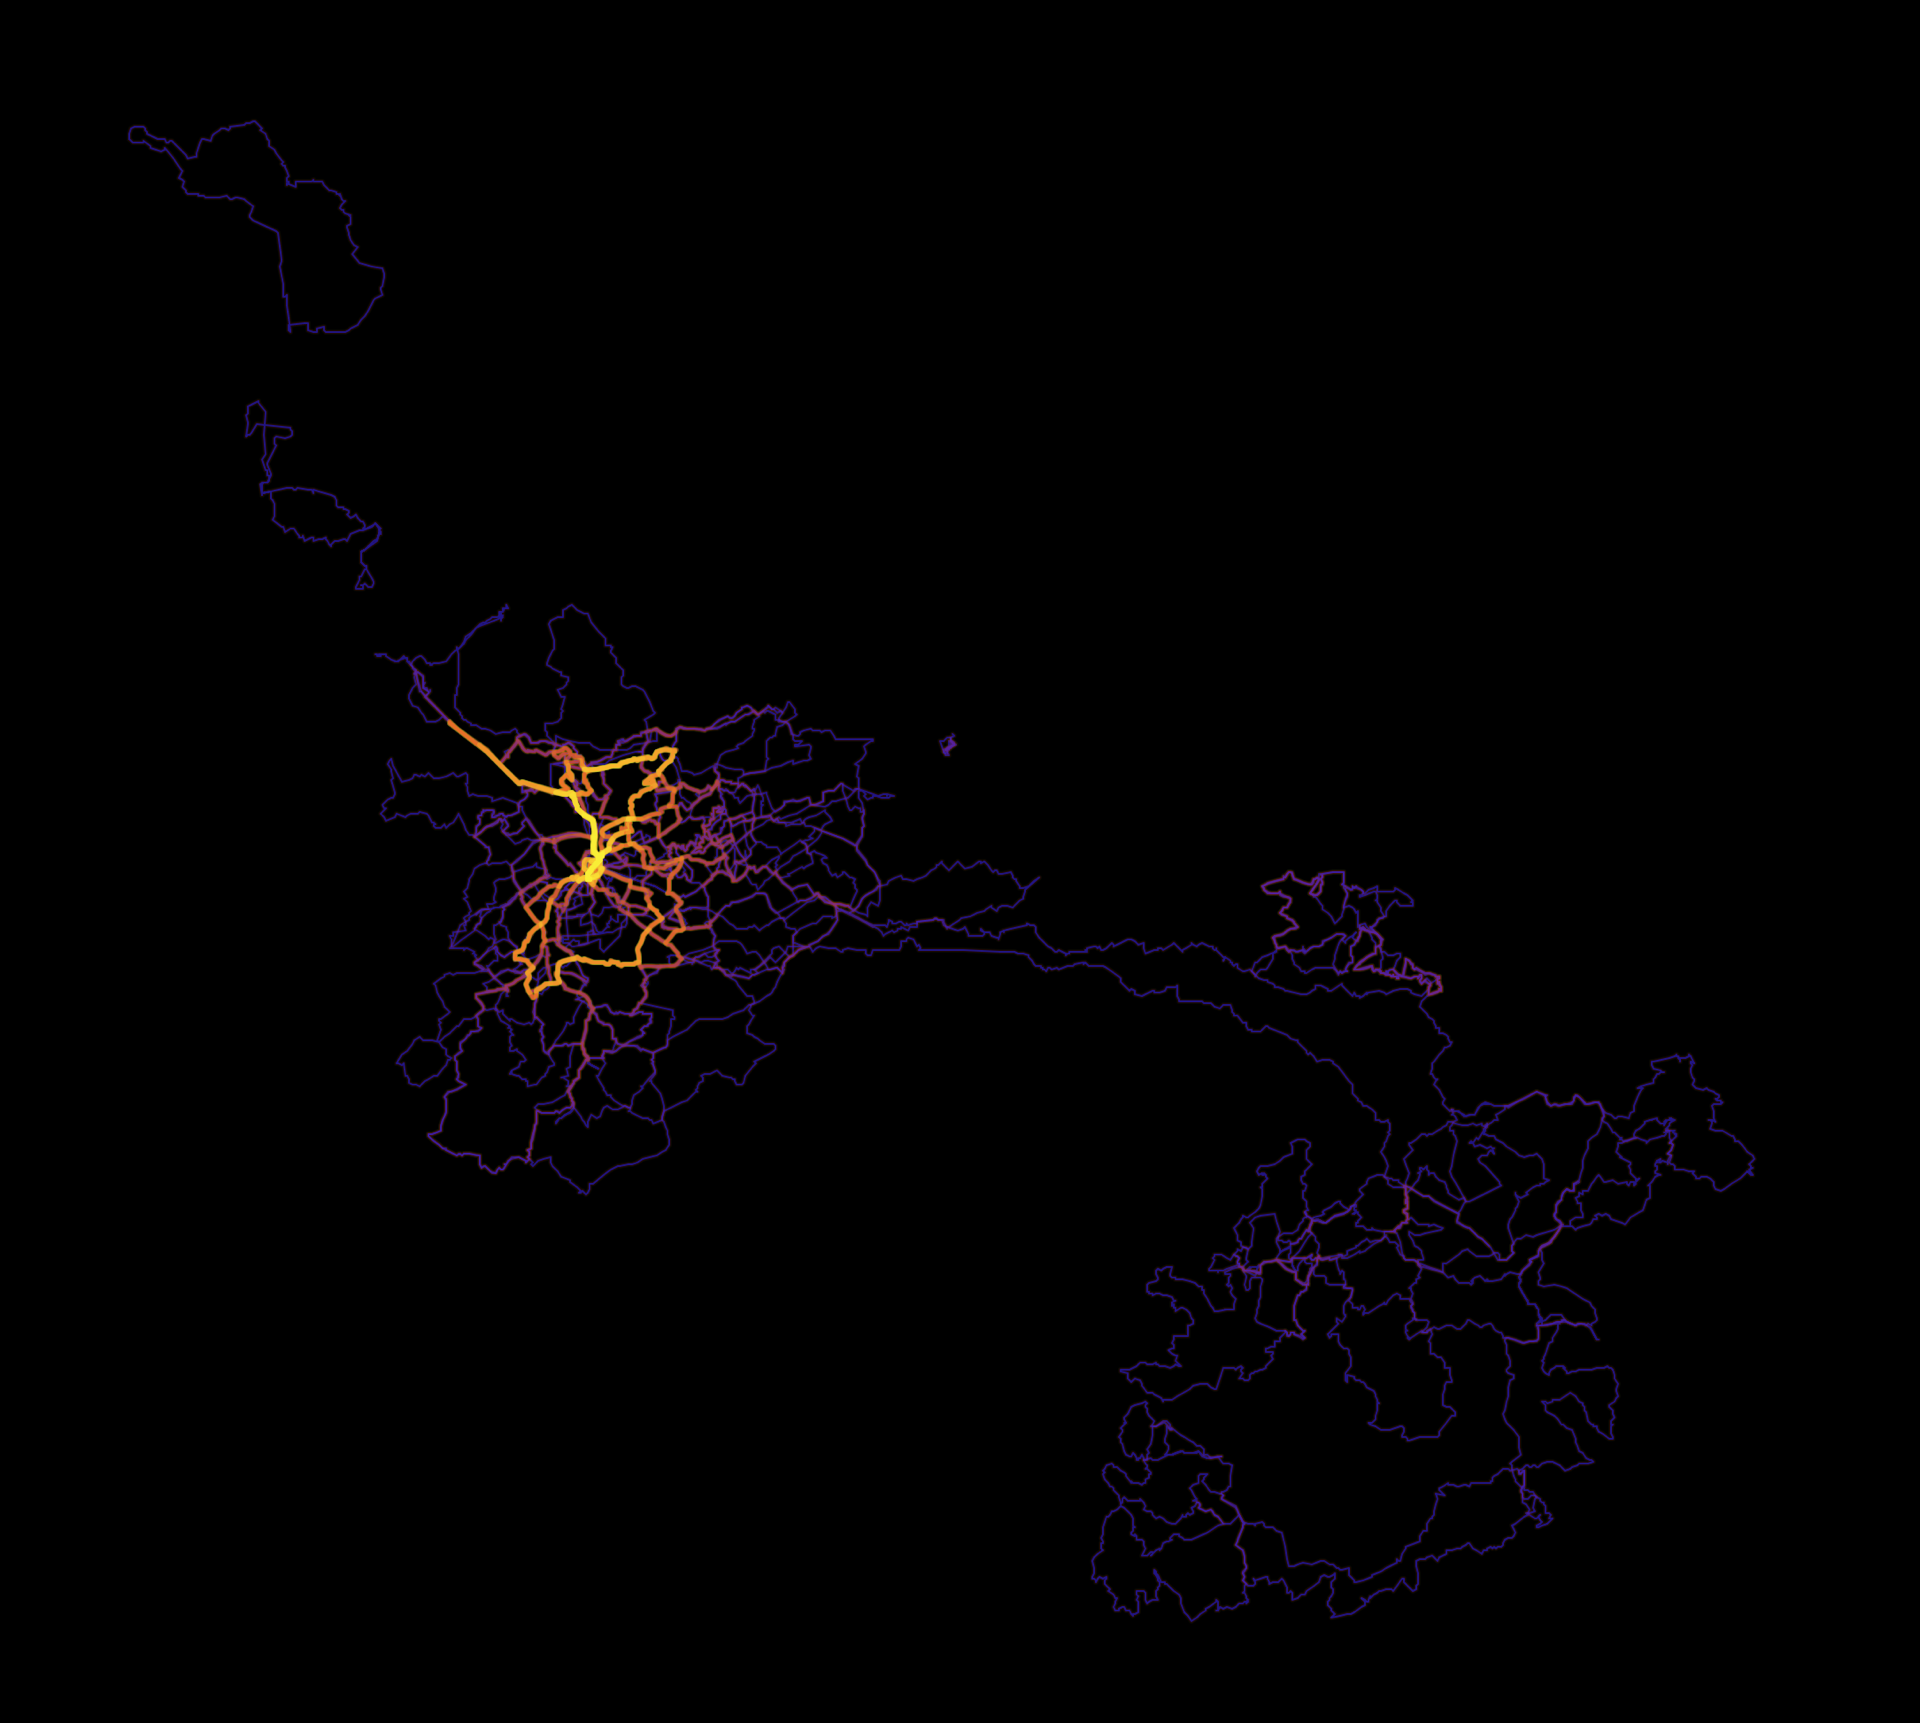
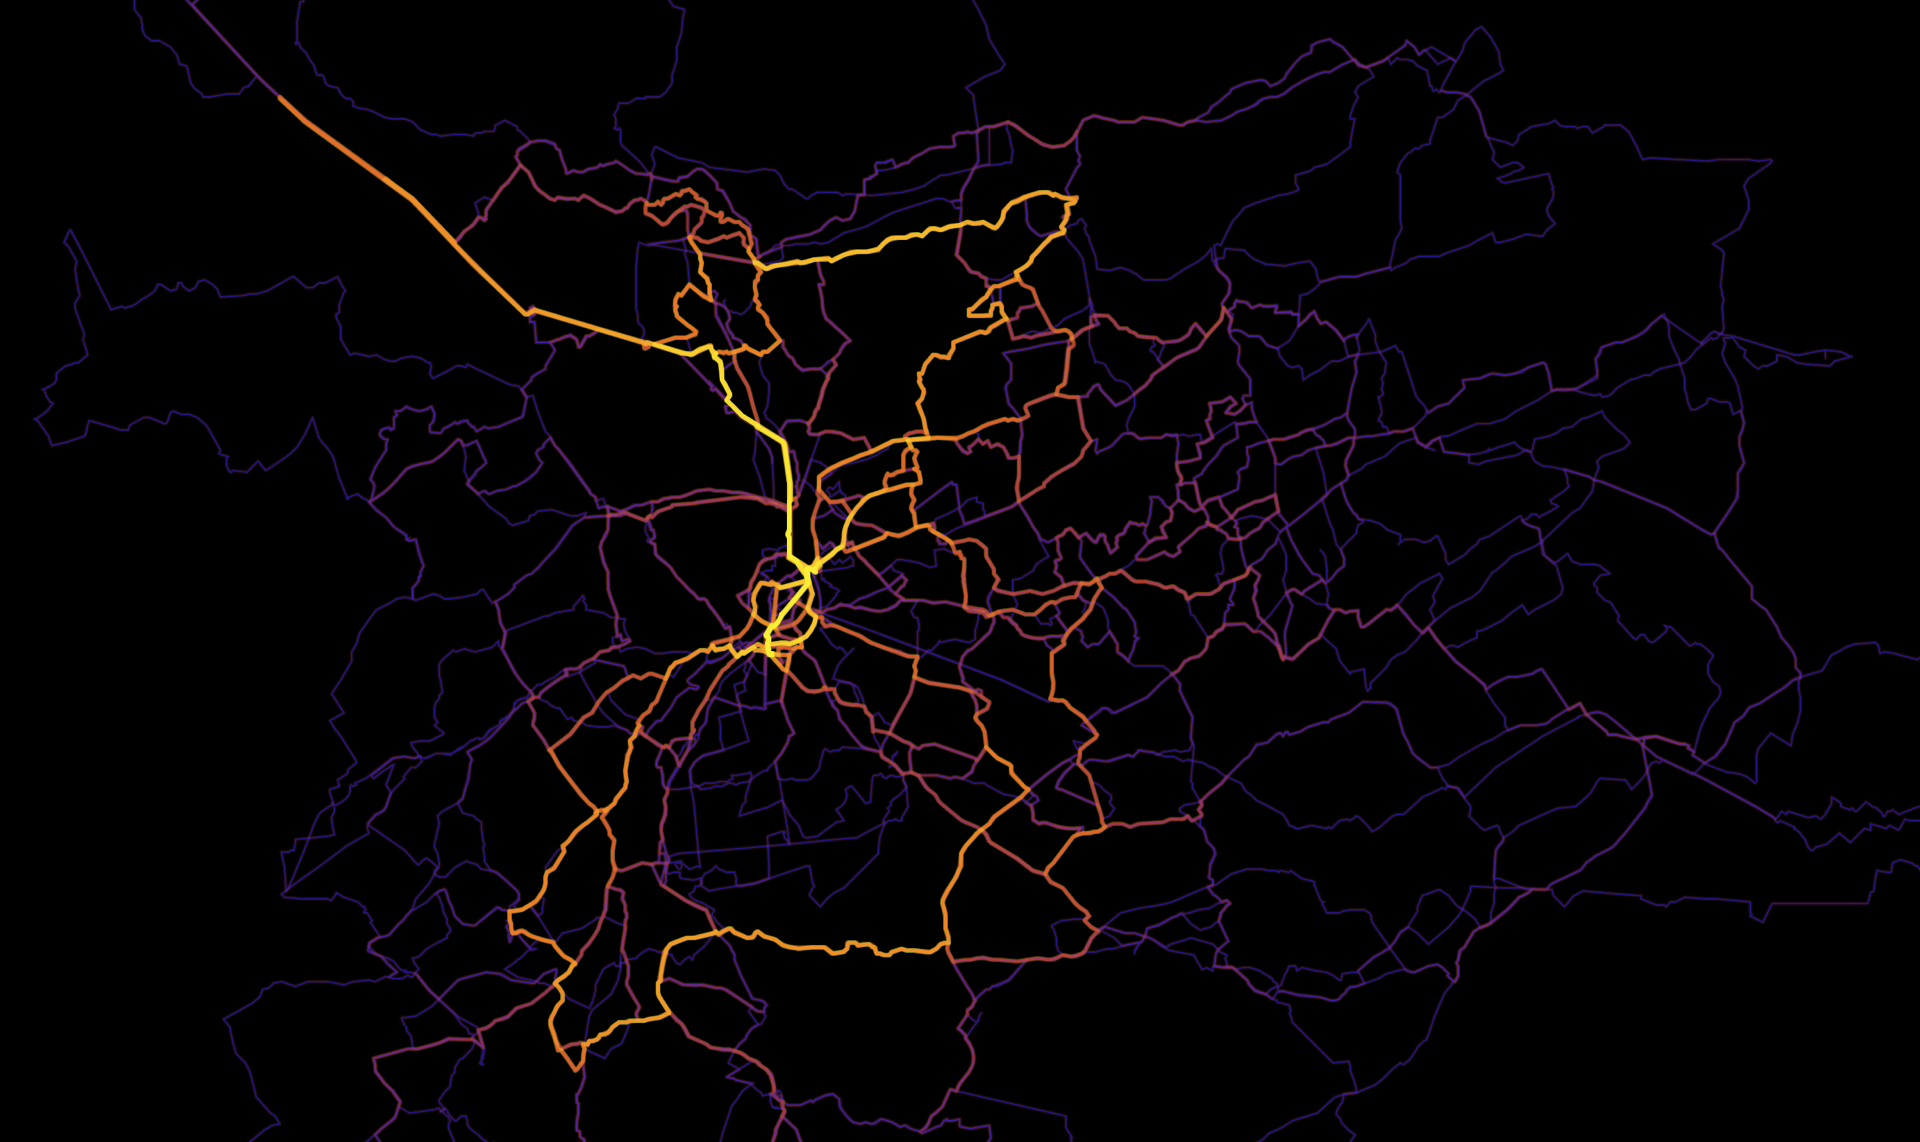
And now it is time to look at some maps and figures. Let’s start with the maps of cycling I have done this year. The first figures show the location and (for Belgium and the area of Leuven on a separate zoomed-in map) heat-map of my rides.
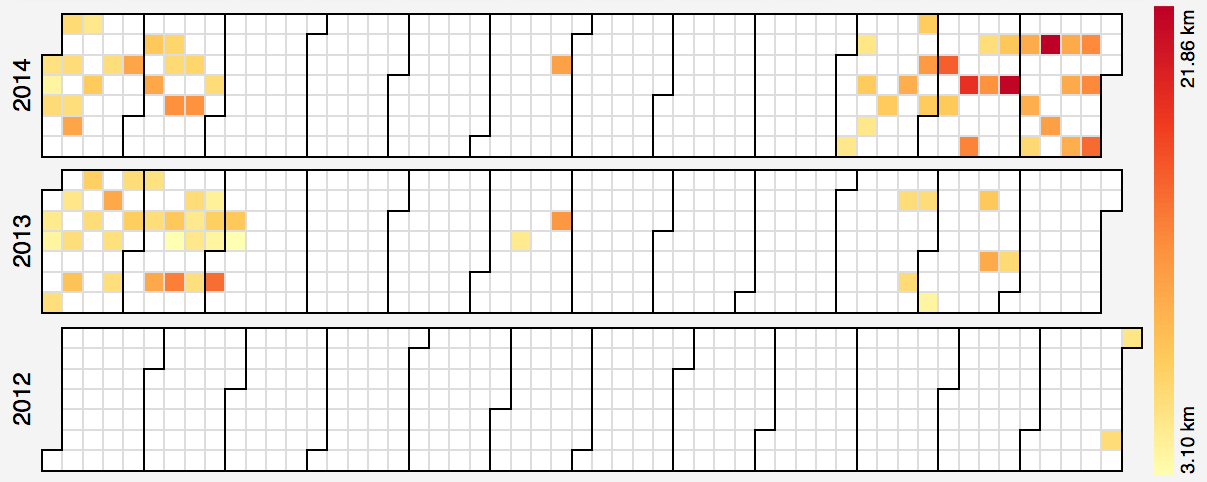
Out of the 155 active days, I rode solo most of the time: only on 44 days was I riding with at least one other person. As usual, most of the time that was Willem (22 rides, and a total time of 2.9 days), or Hao (17 rides, 2.4 days). The distribution of these non-solo rides over the year can be seen below.

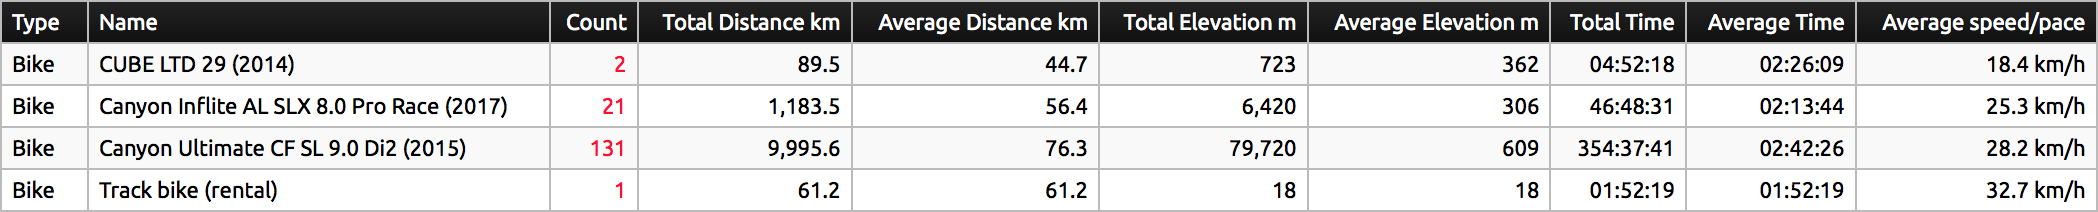
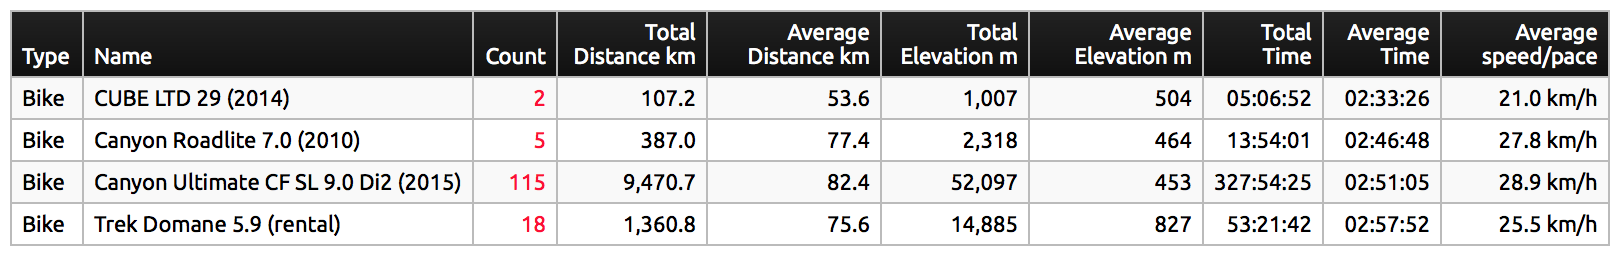
The next one is a summary table (click for legible size) of the bikes I have been riding during the year. I used the new Endurance and the old Ultimate parallel until I sold the latter early October (to make space for a new custom built steel bike that I am working on right now).

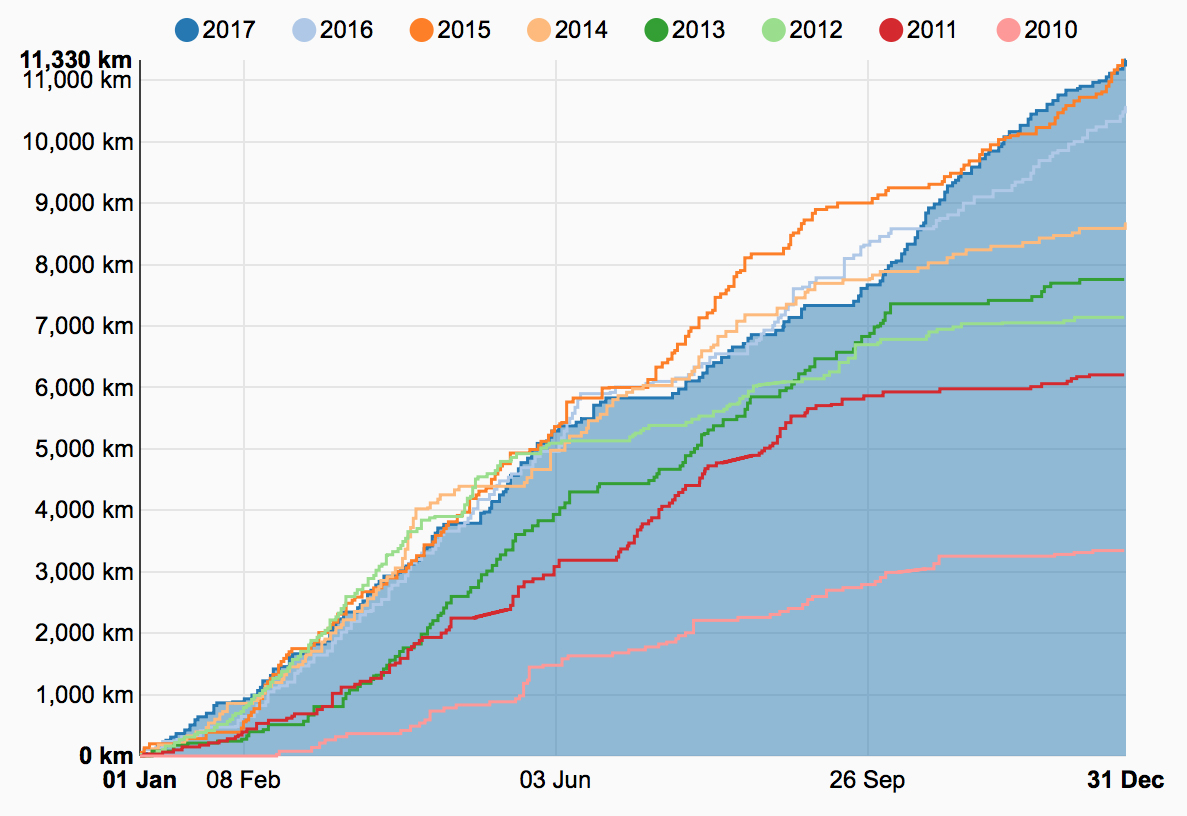
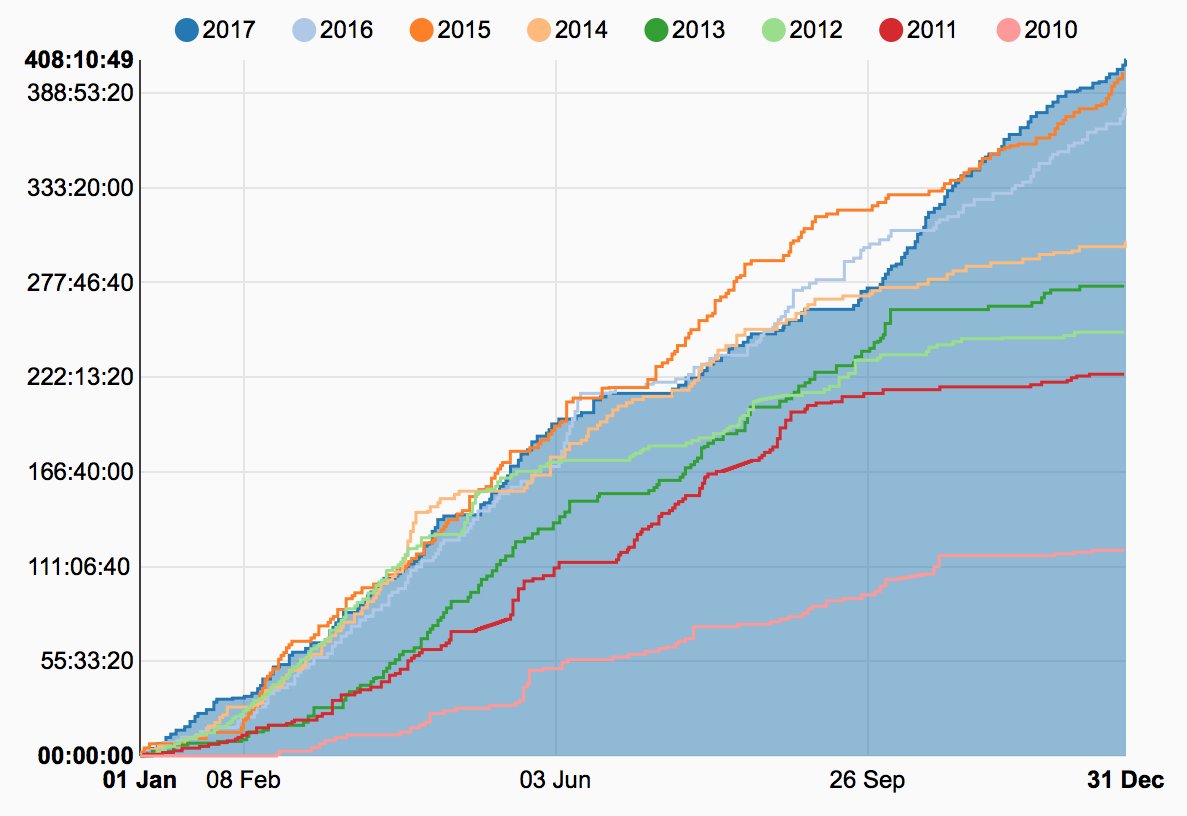
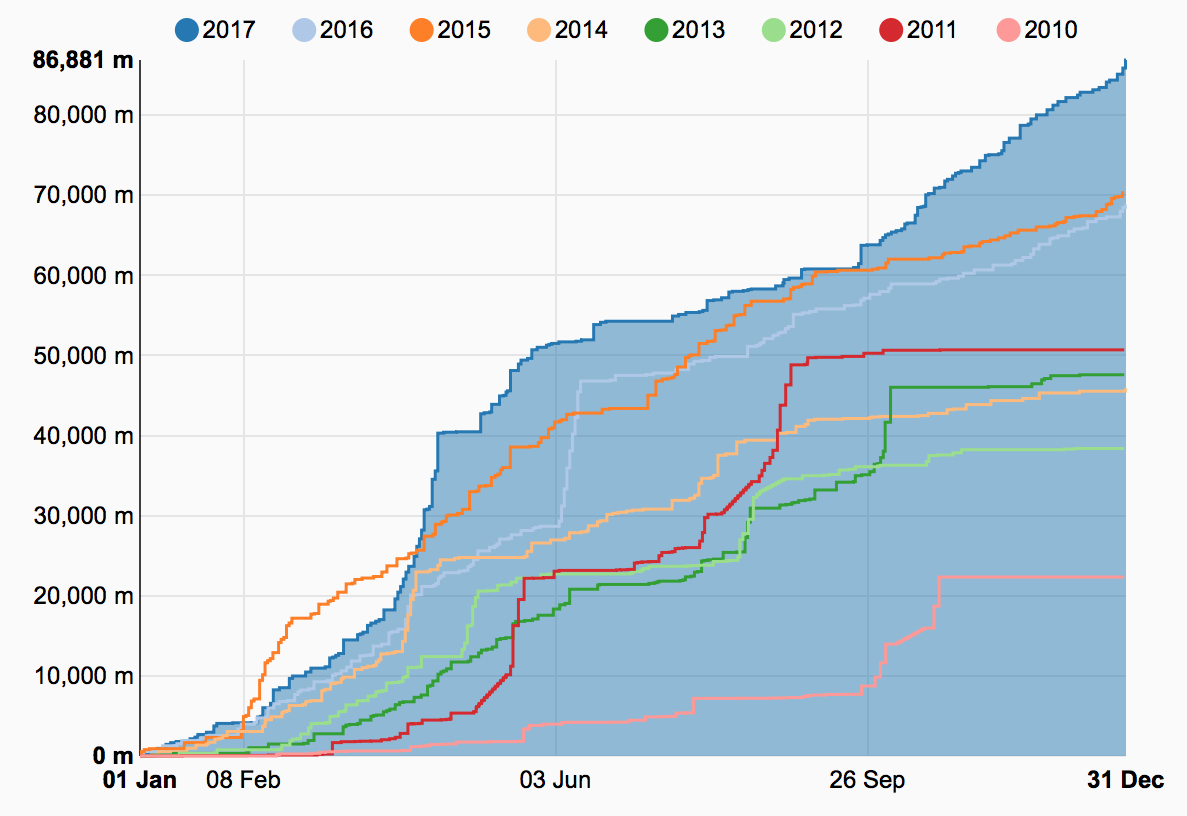
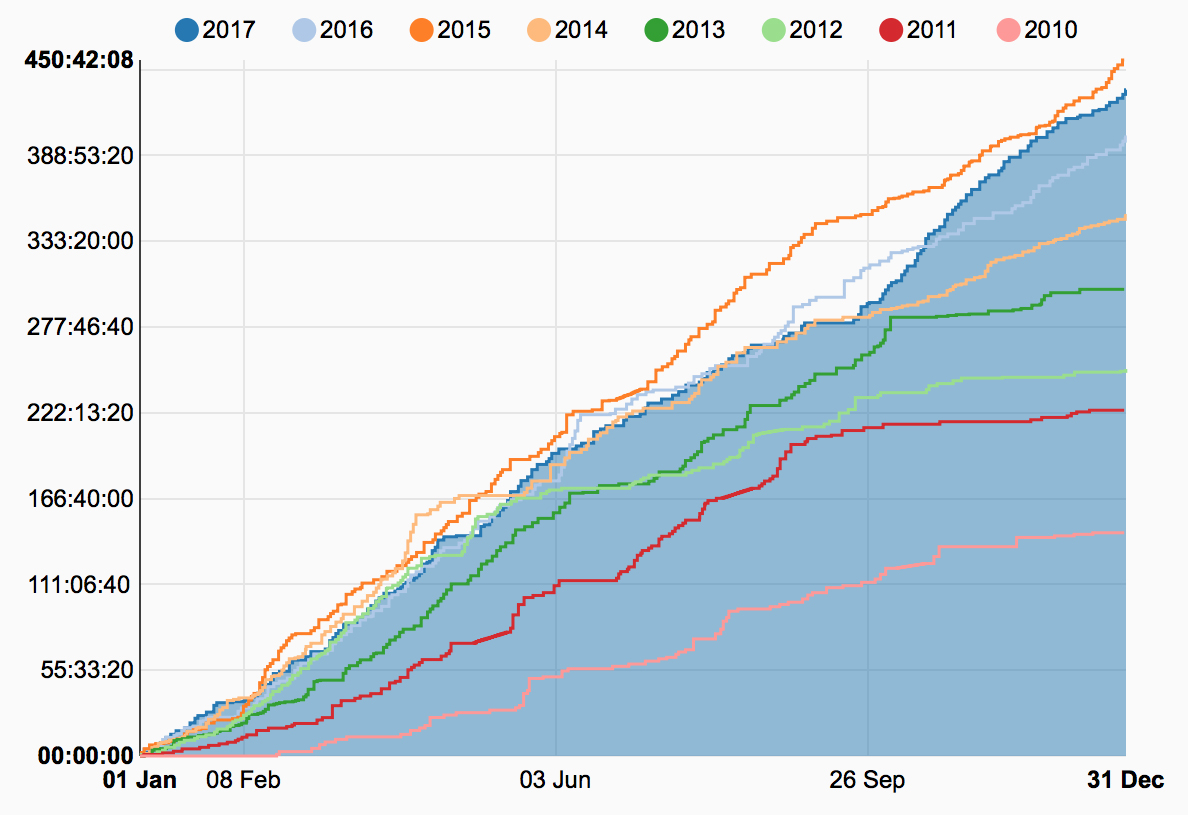
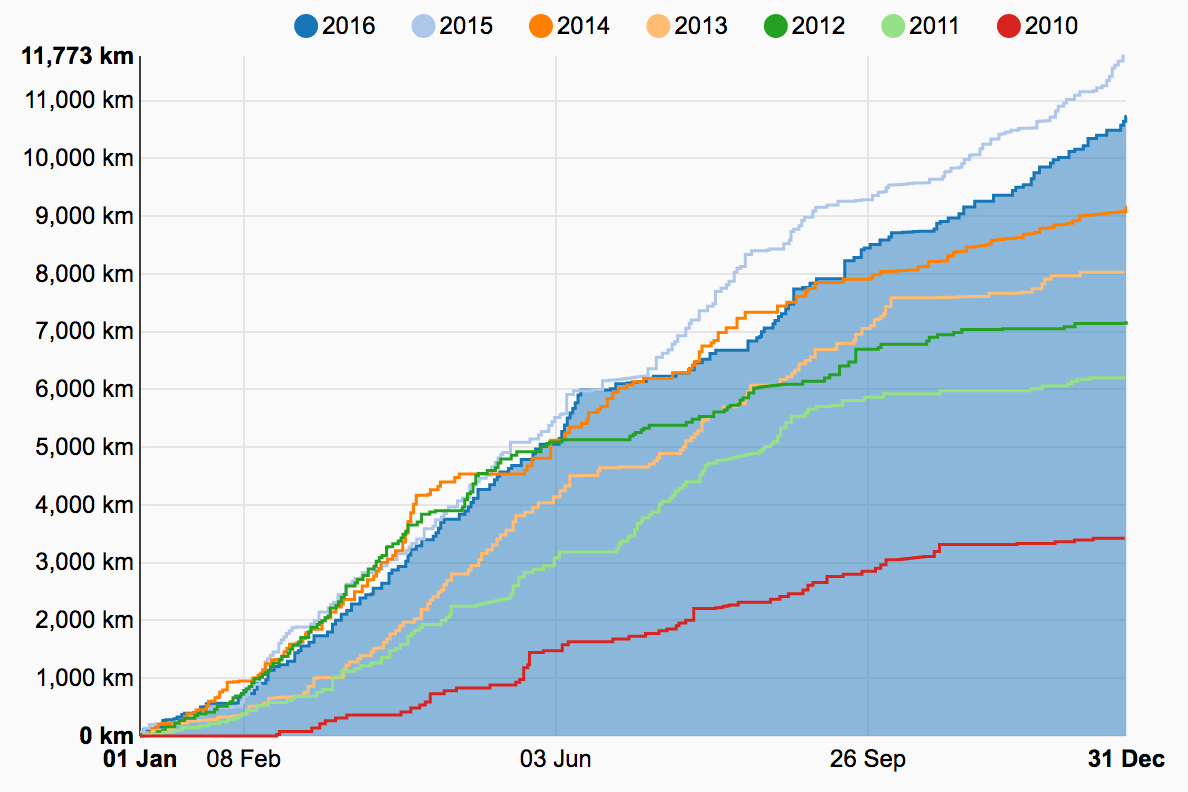
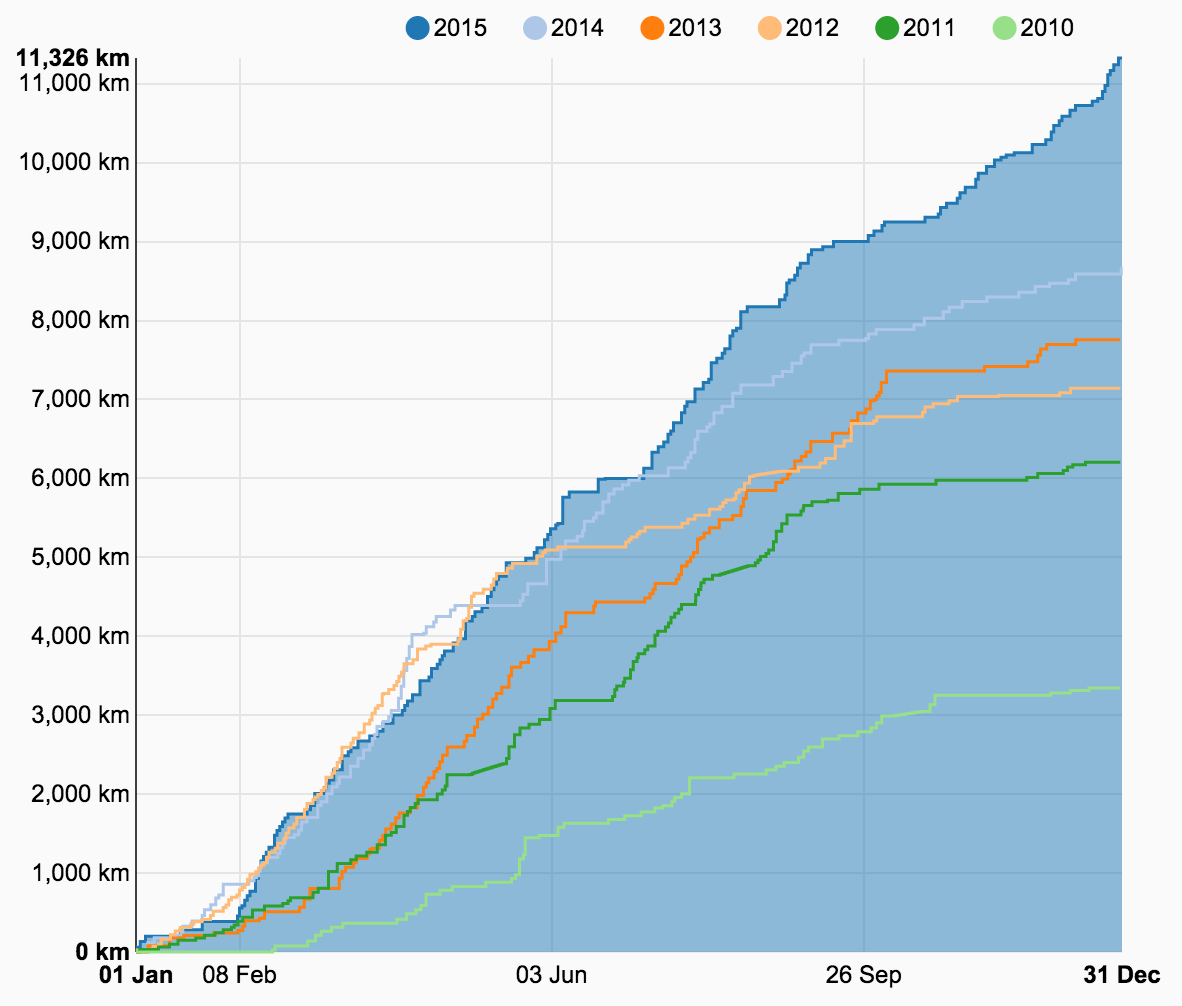
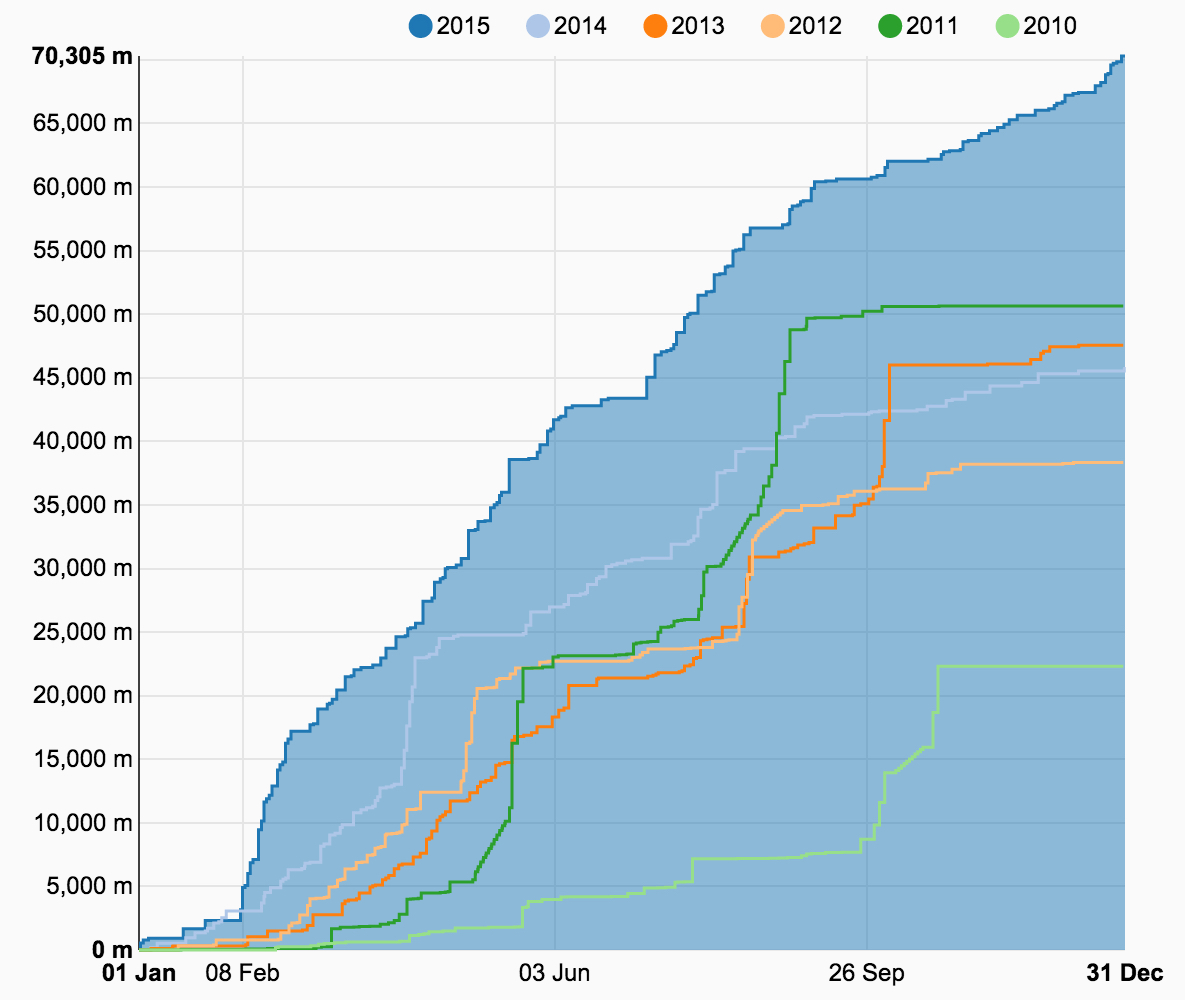
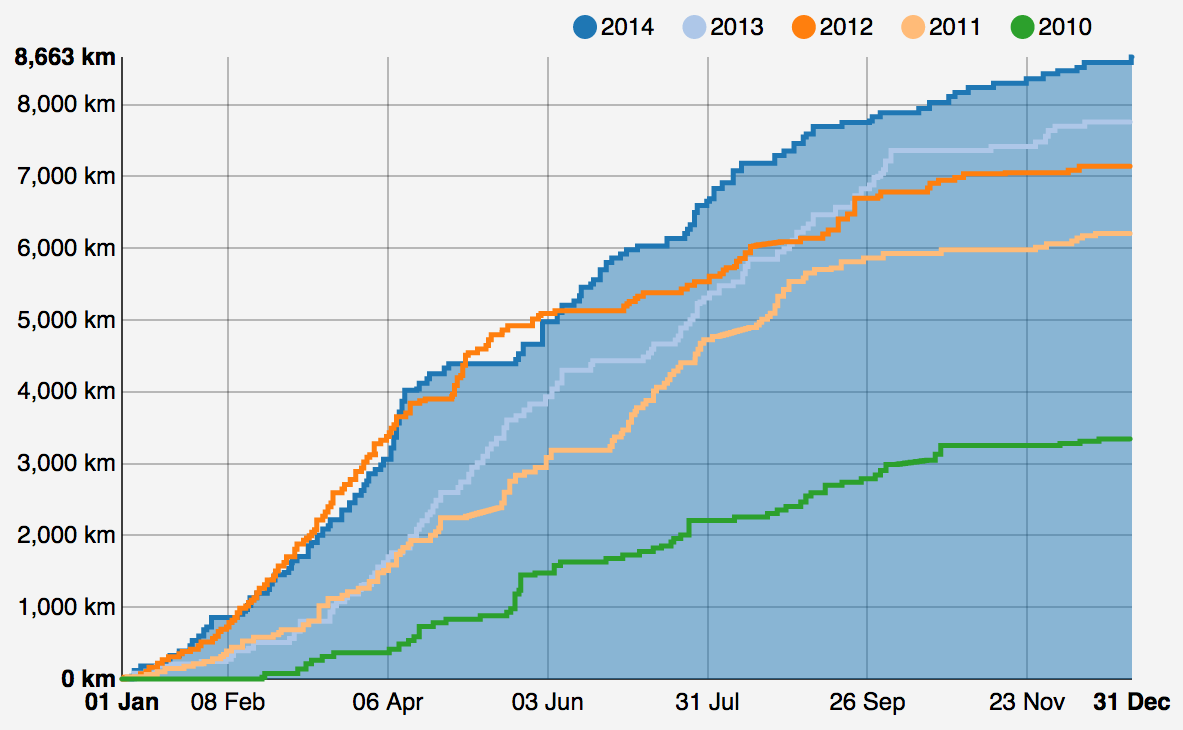
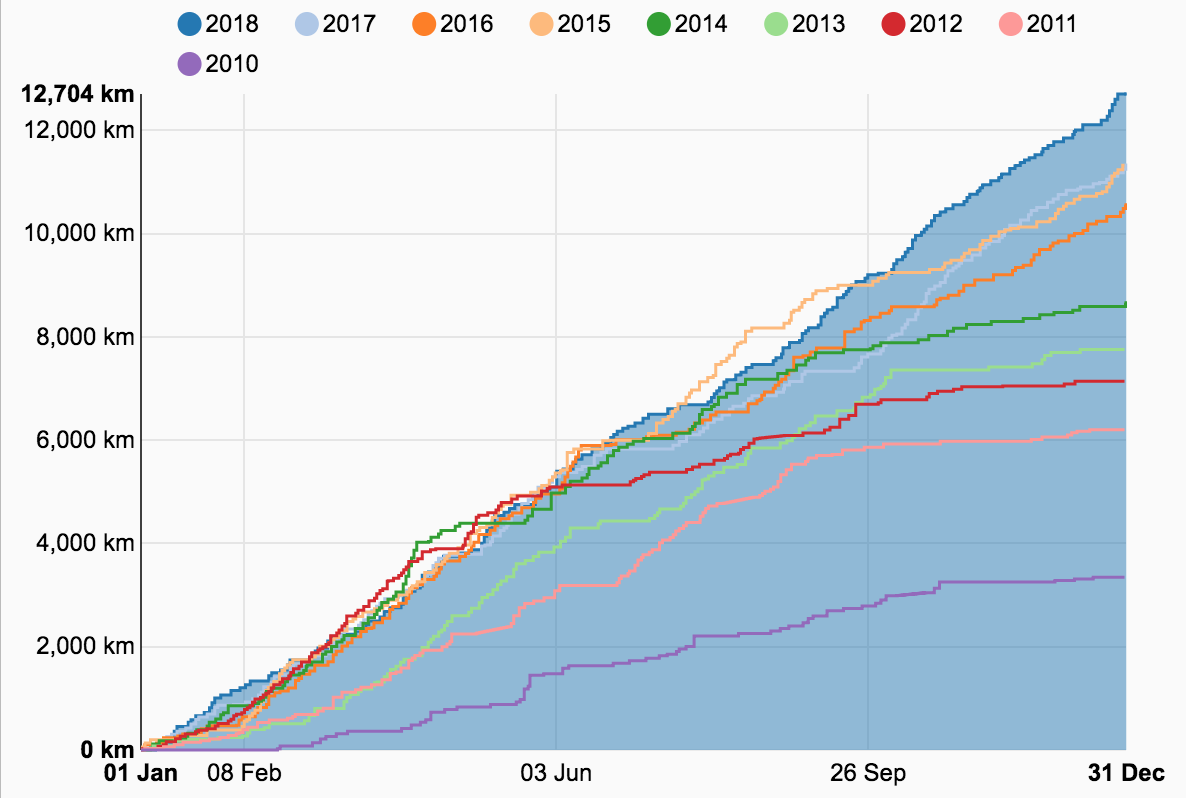
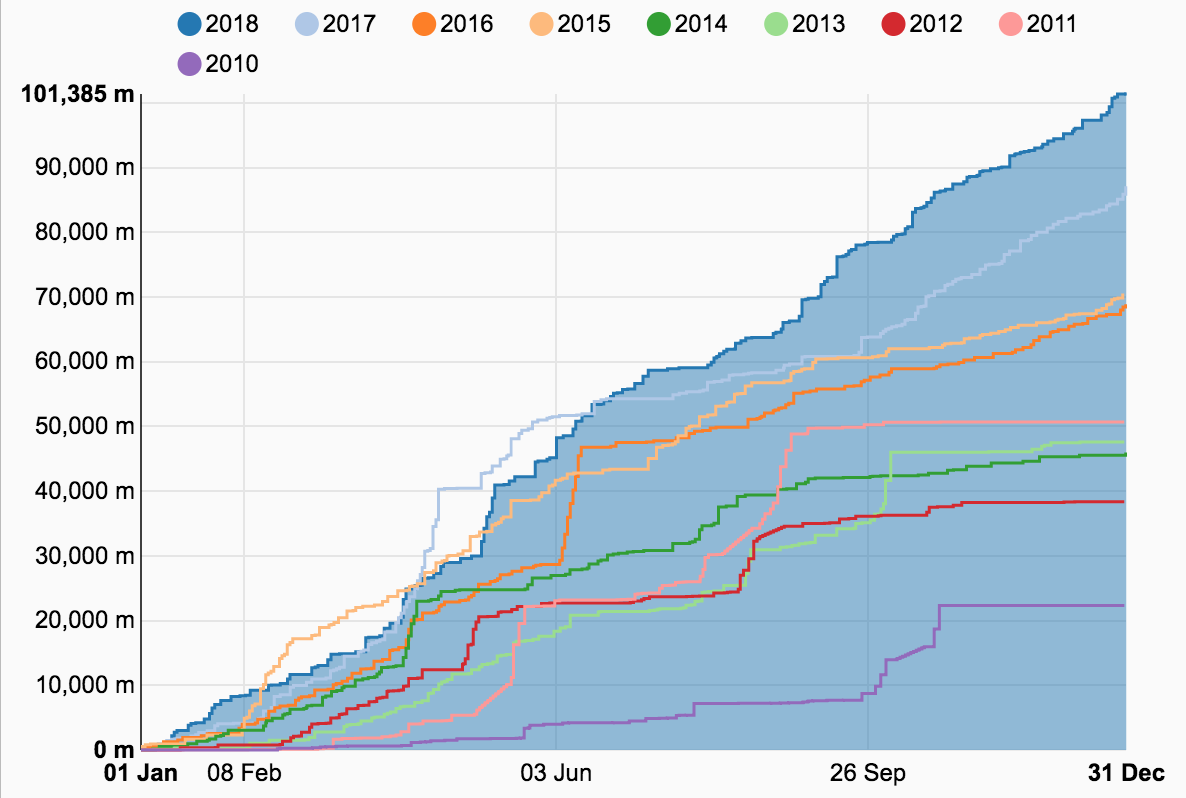
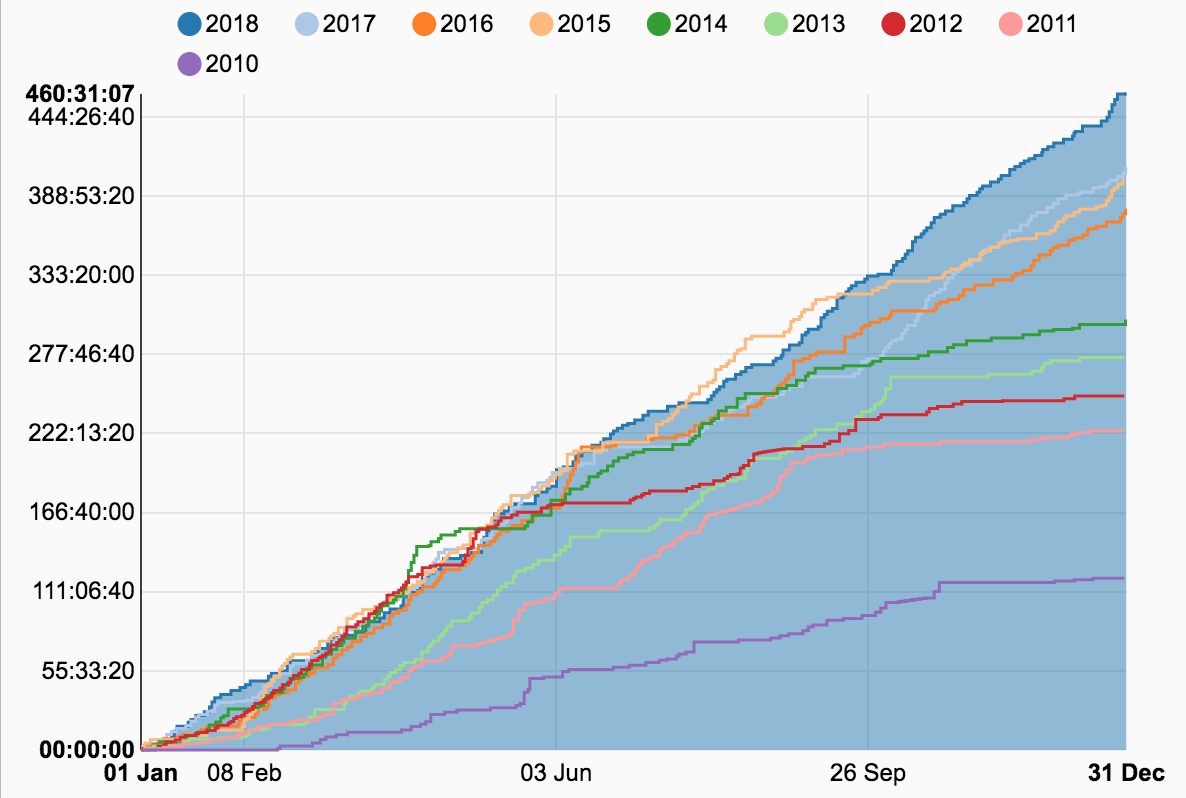
Here are the graphs showing the yearly evolution of my cycling distance, time, and elevation gain compared to the previous years.
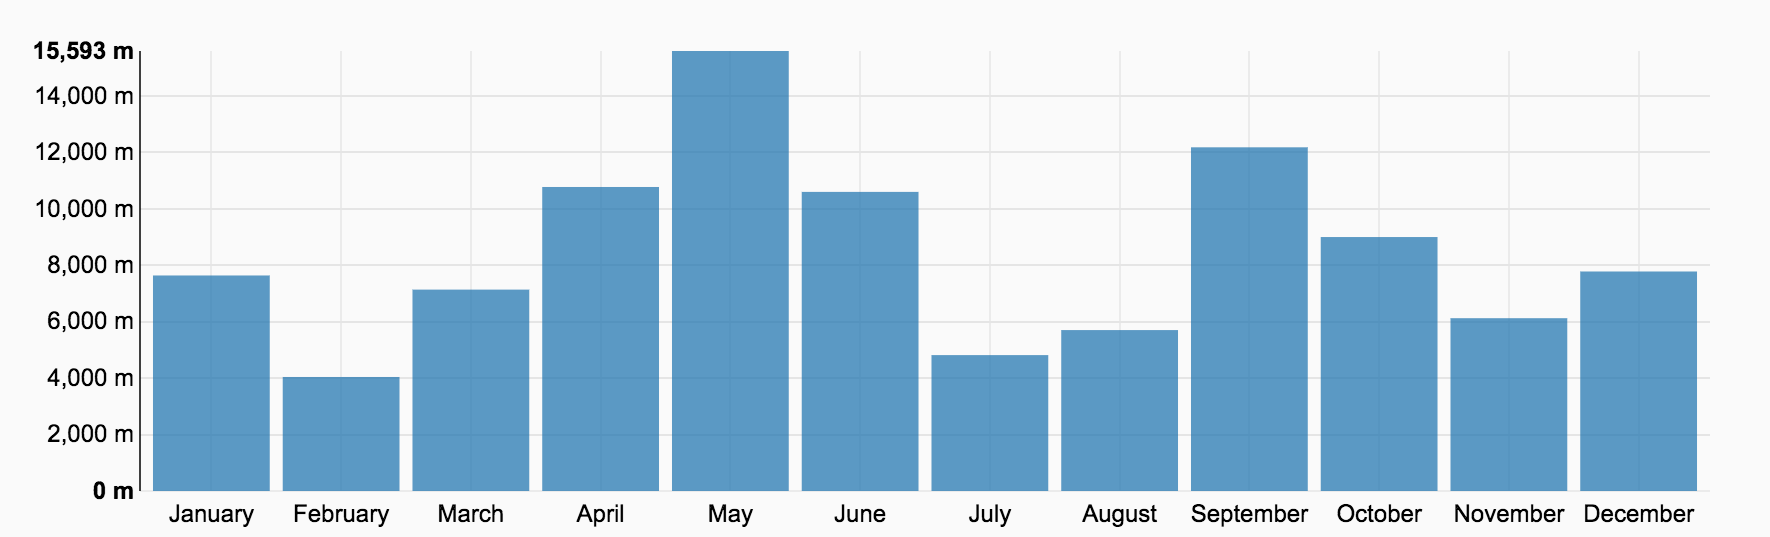
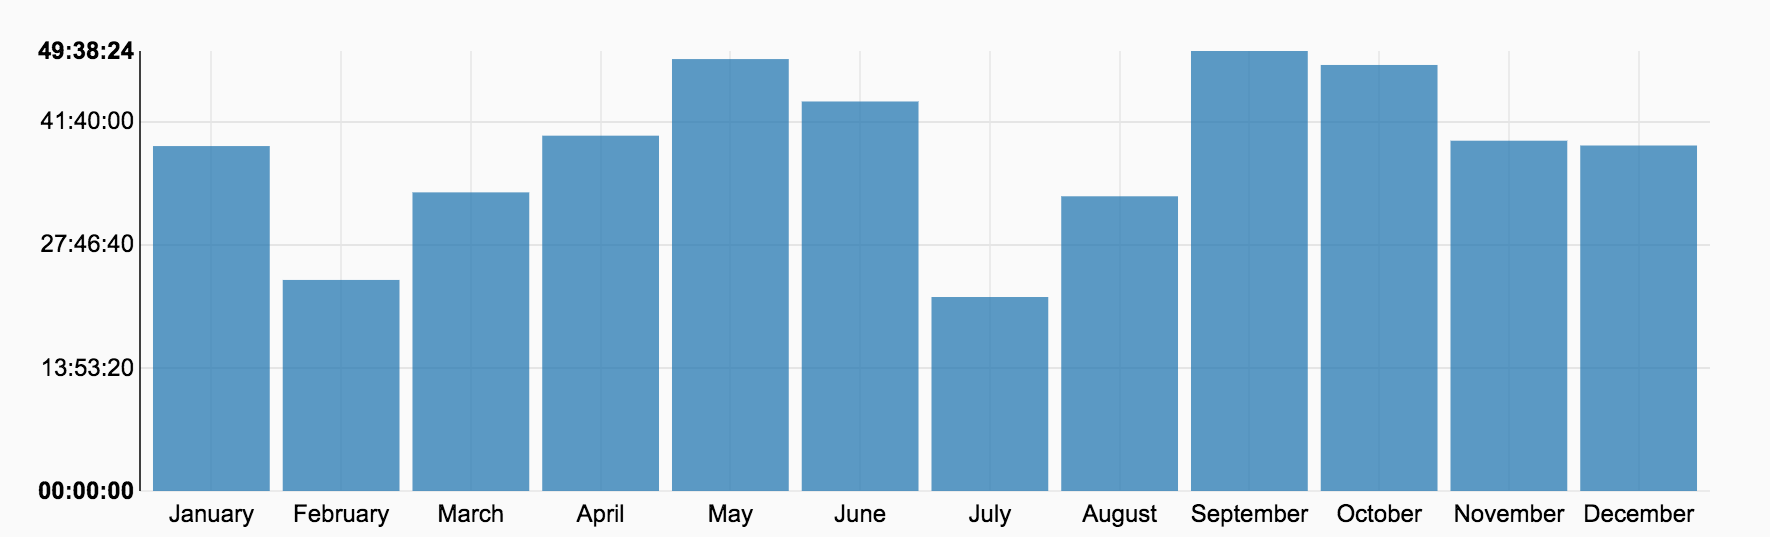
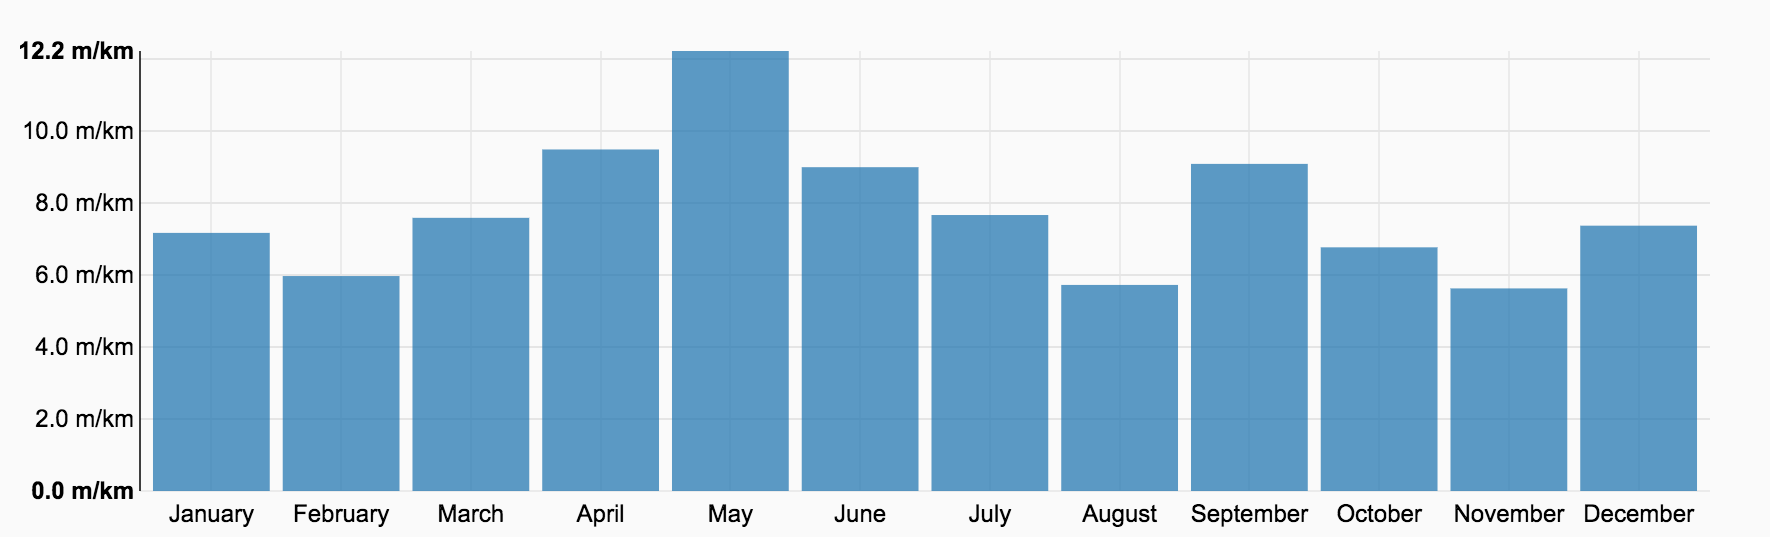
New this year are some monthly figures, because the more the merrier, right? So below you will find the monthly totals and averages for distance, elevation gain, activity time, average steepness (meters climbed each kilometre on average), and average temperature.
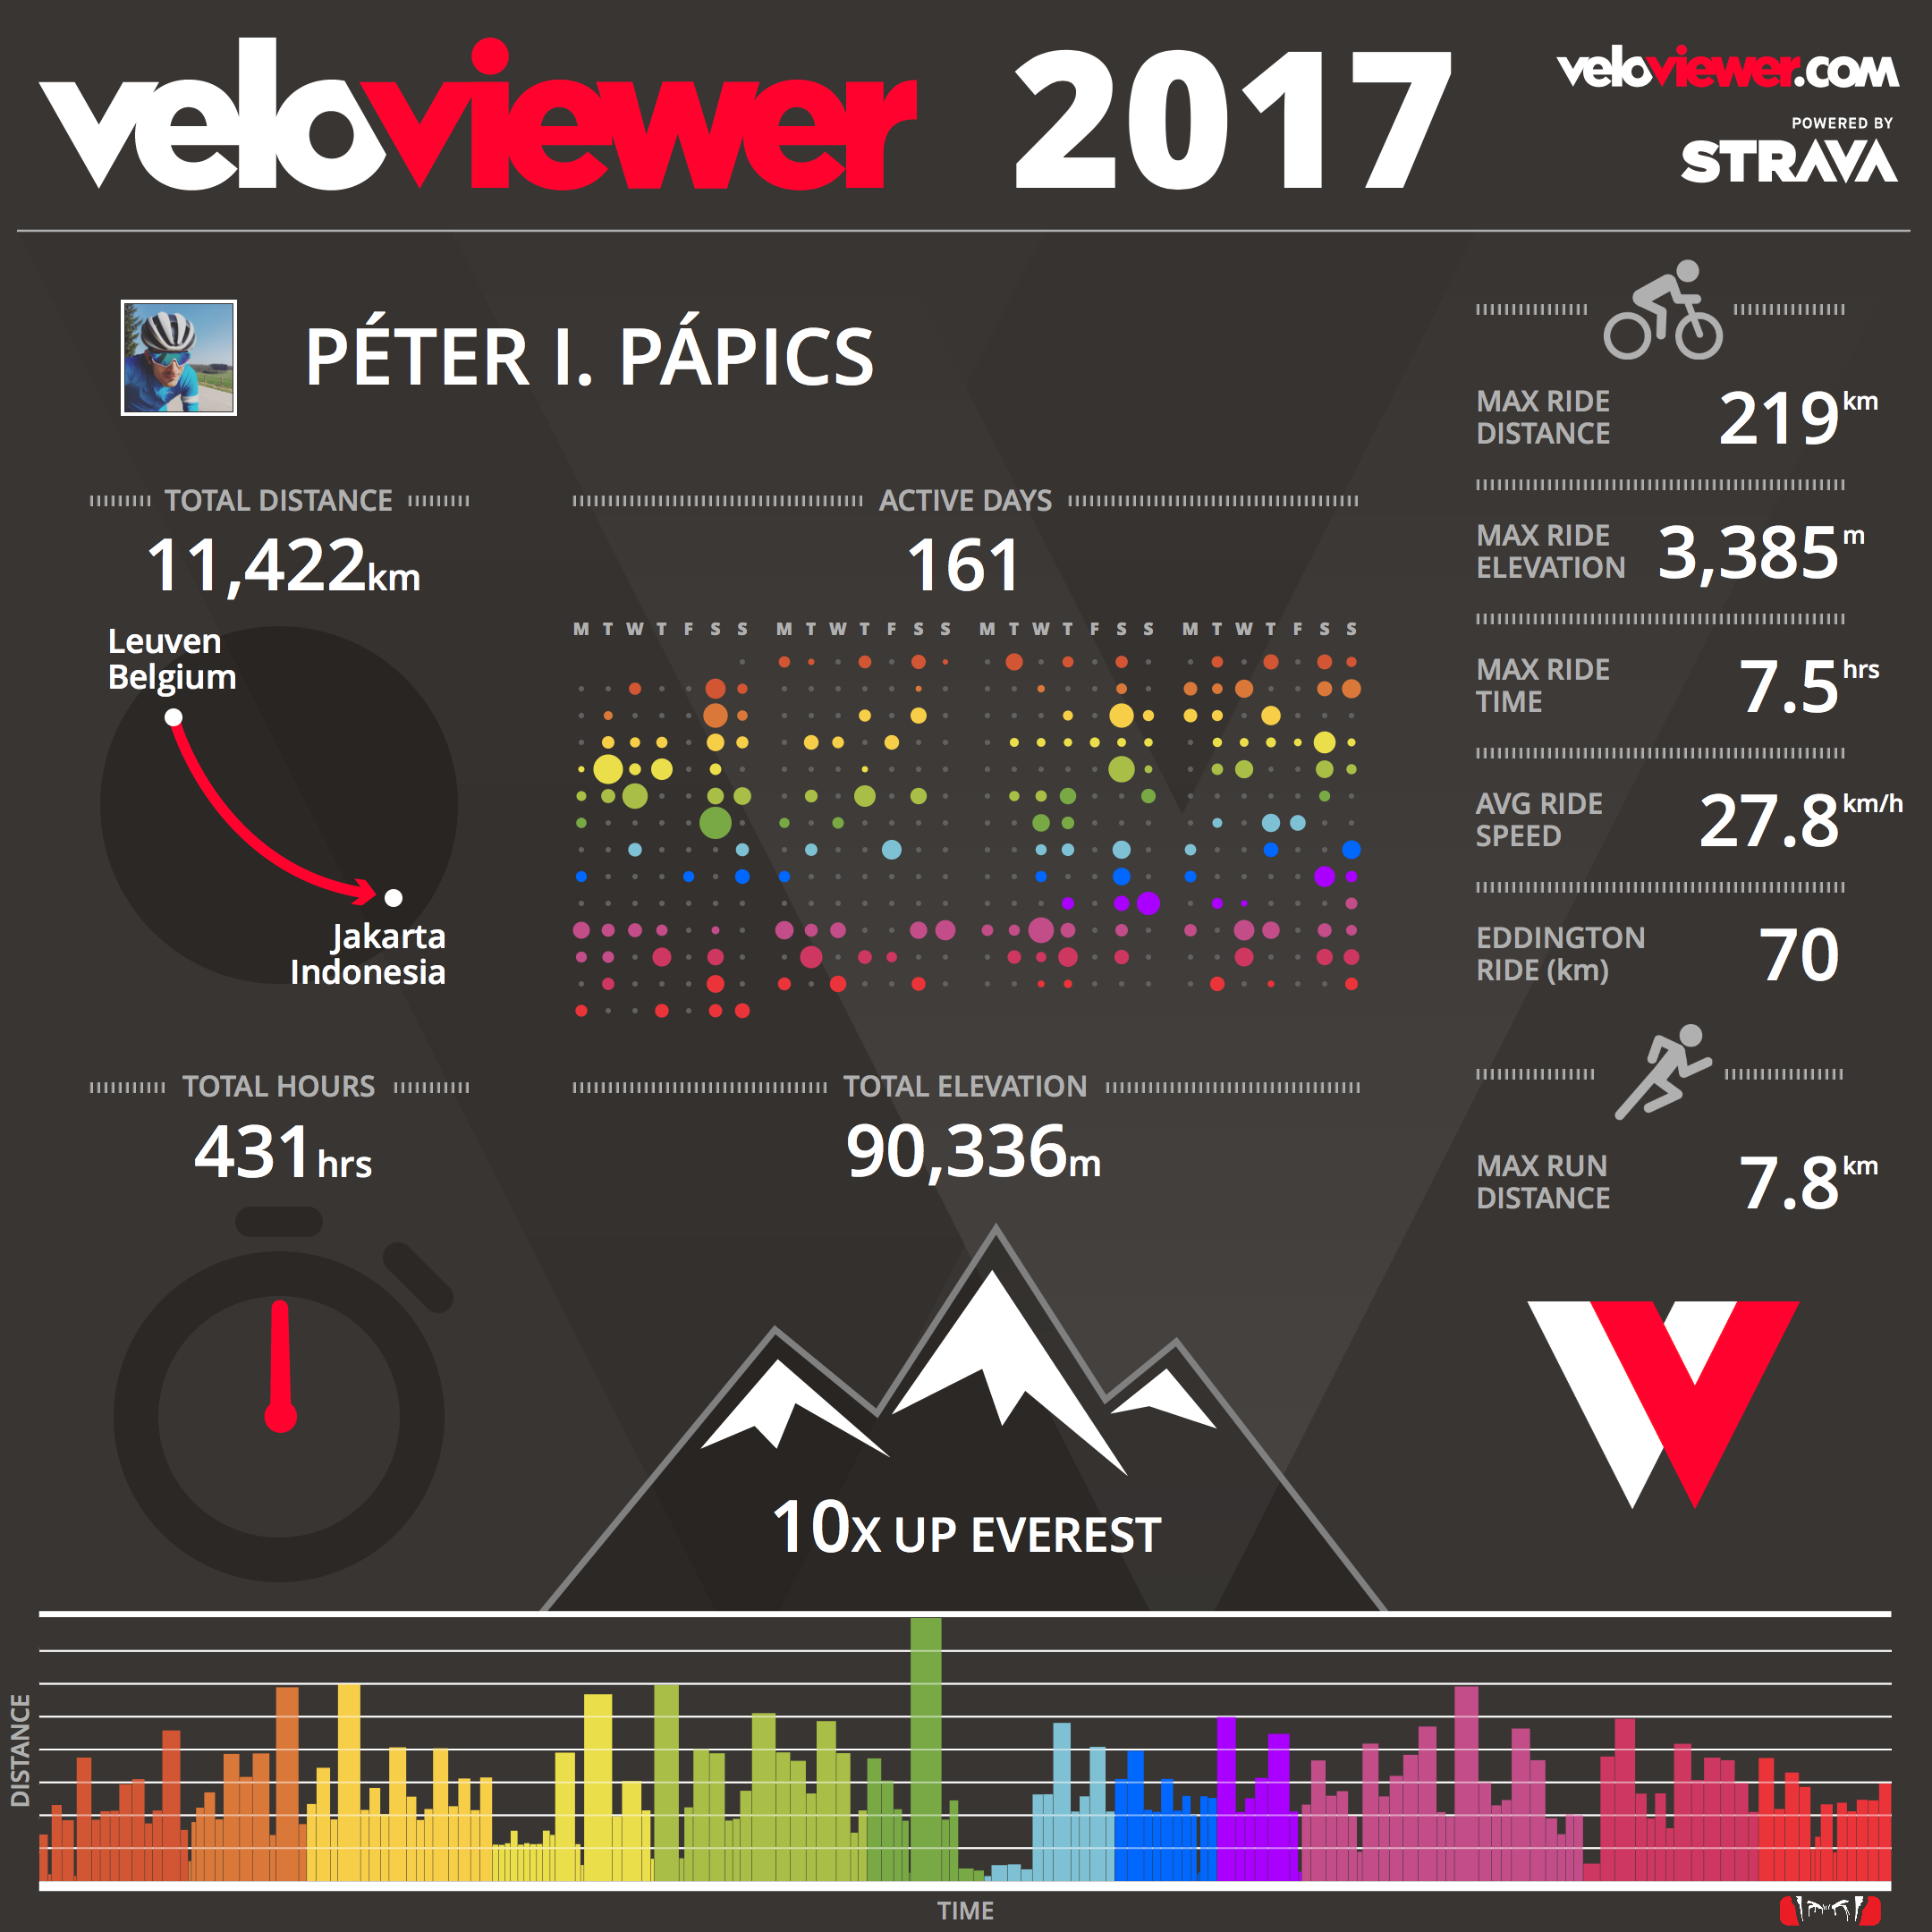
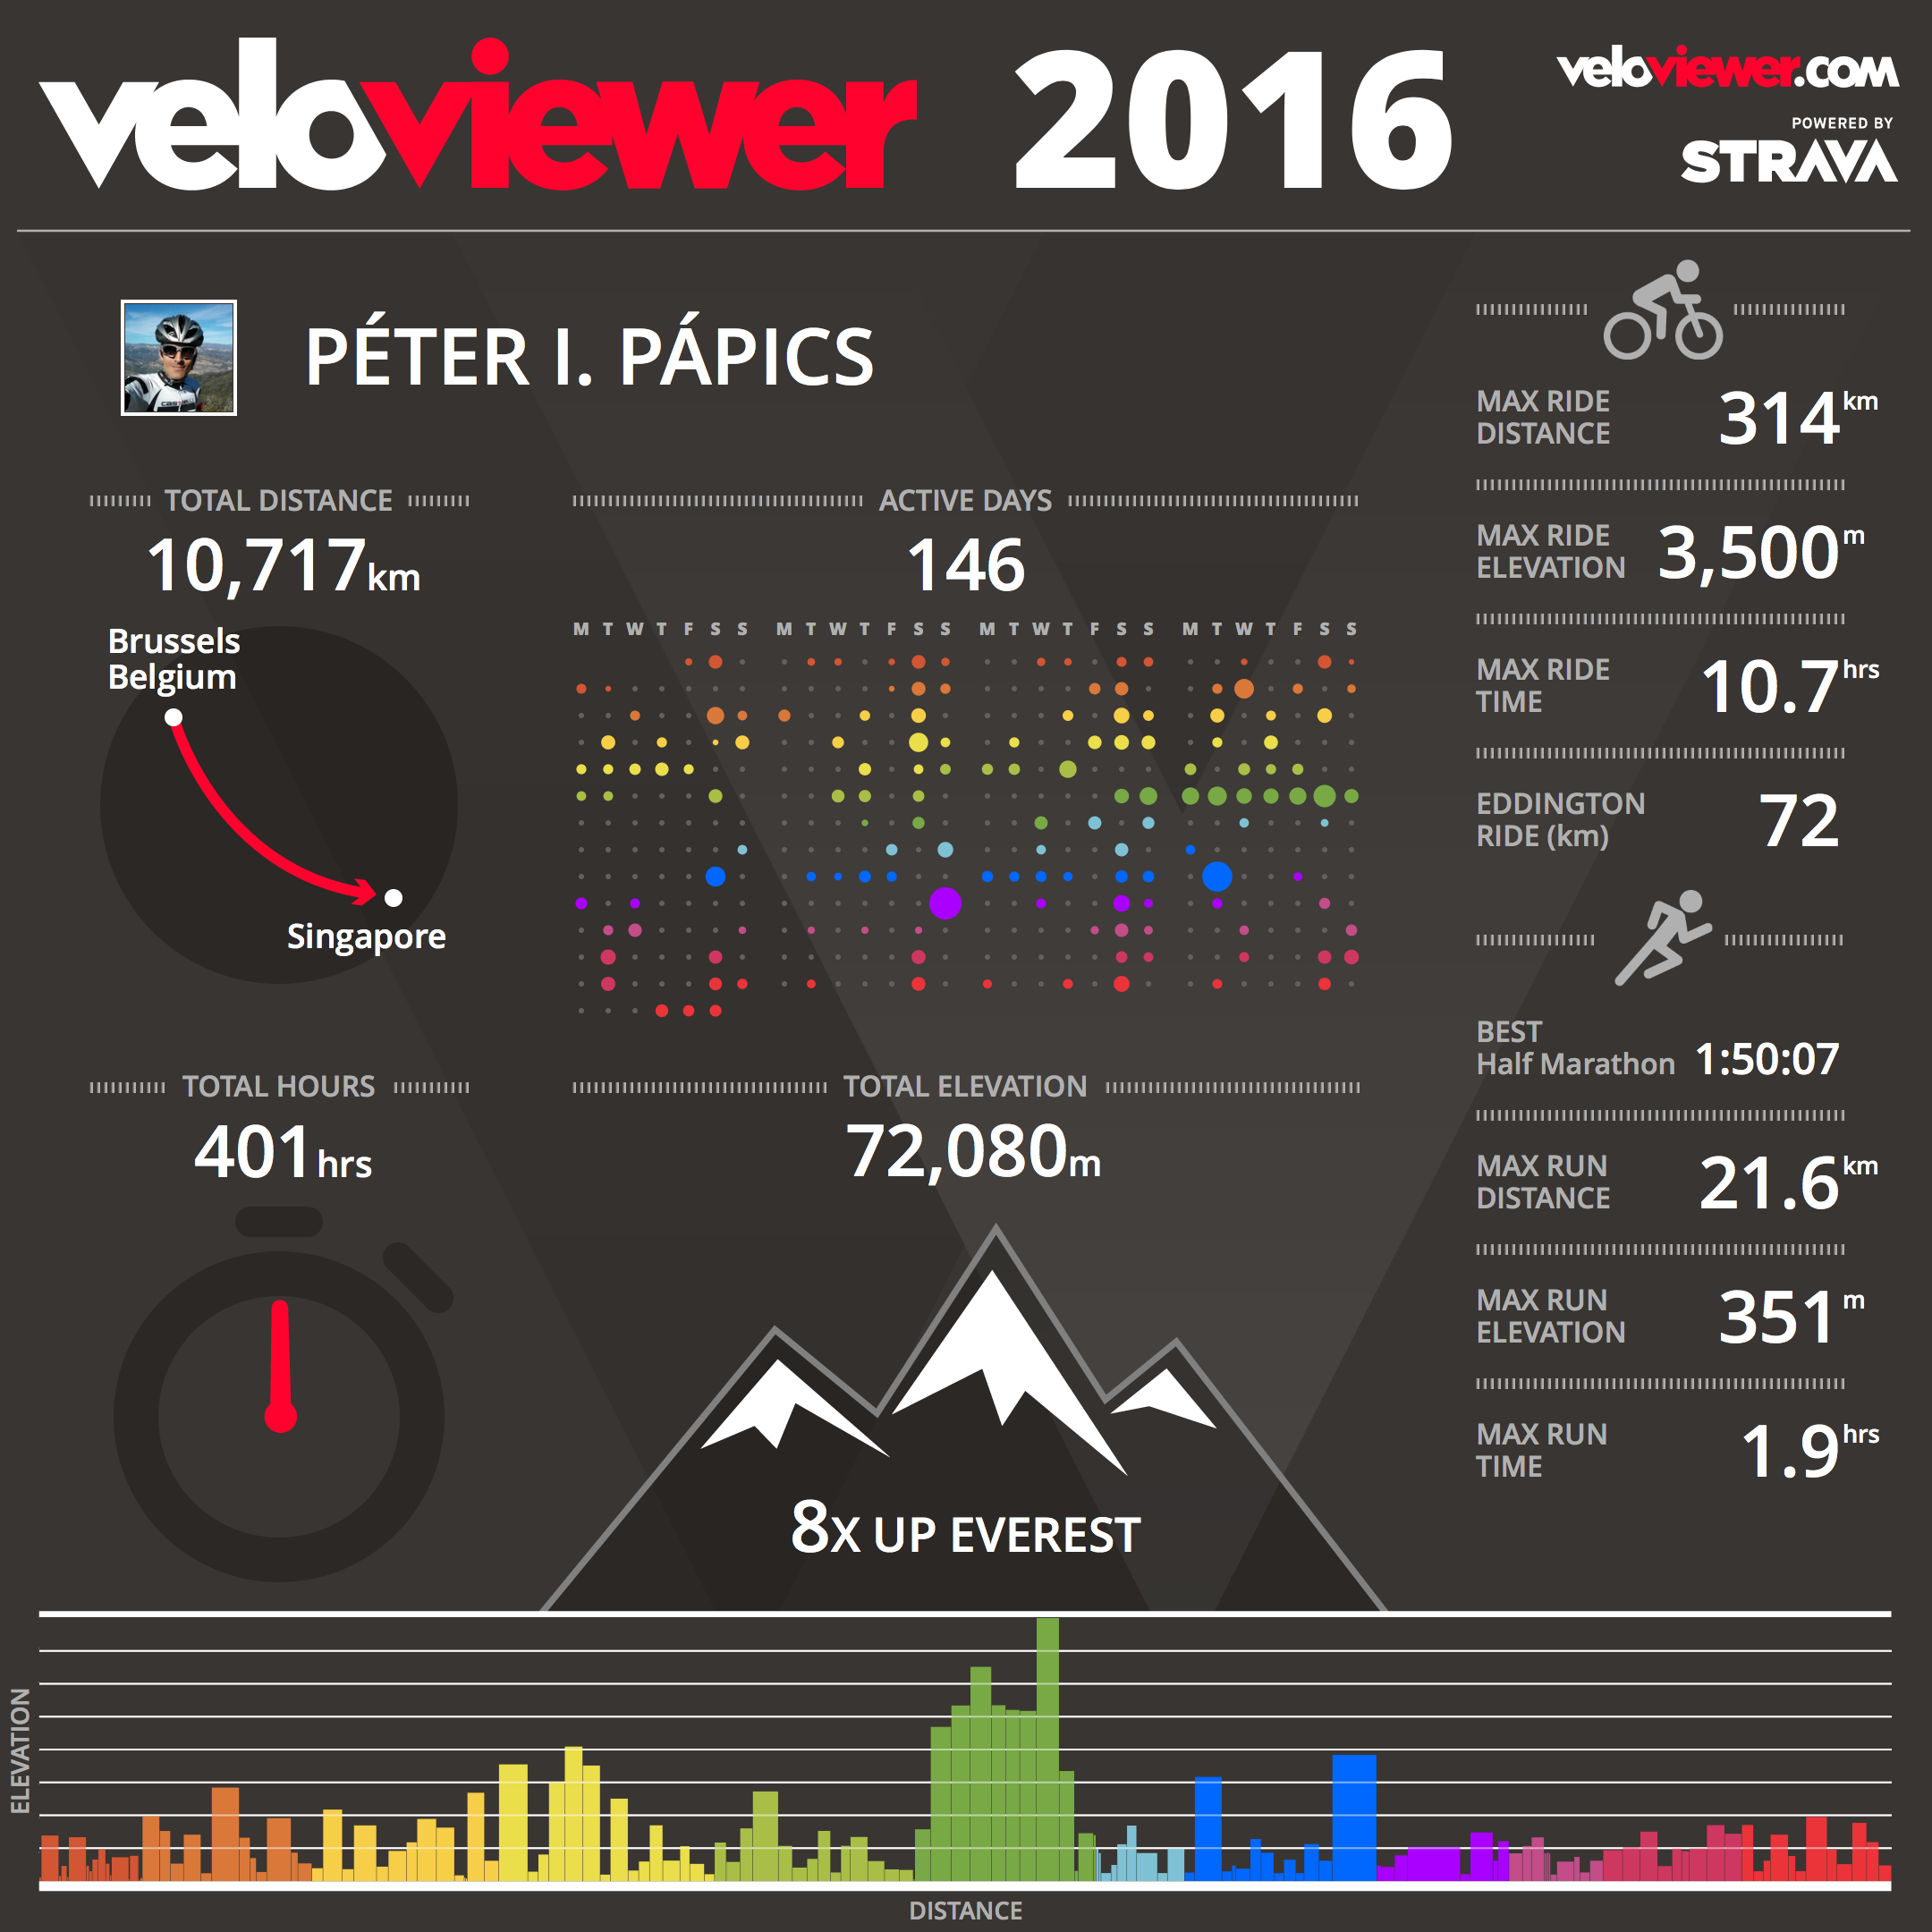
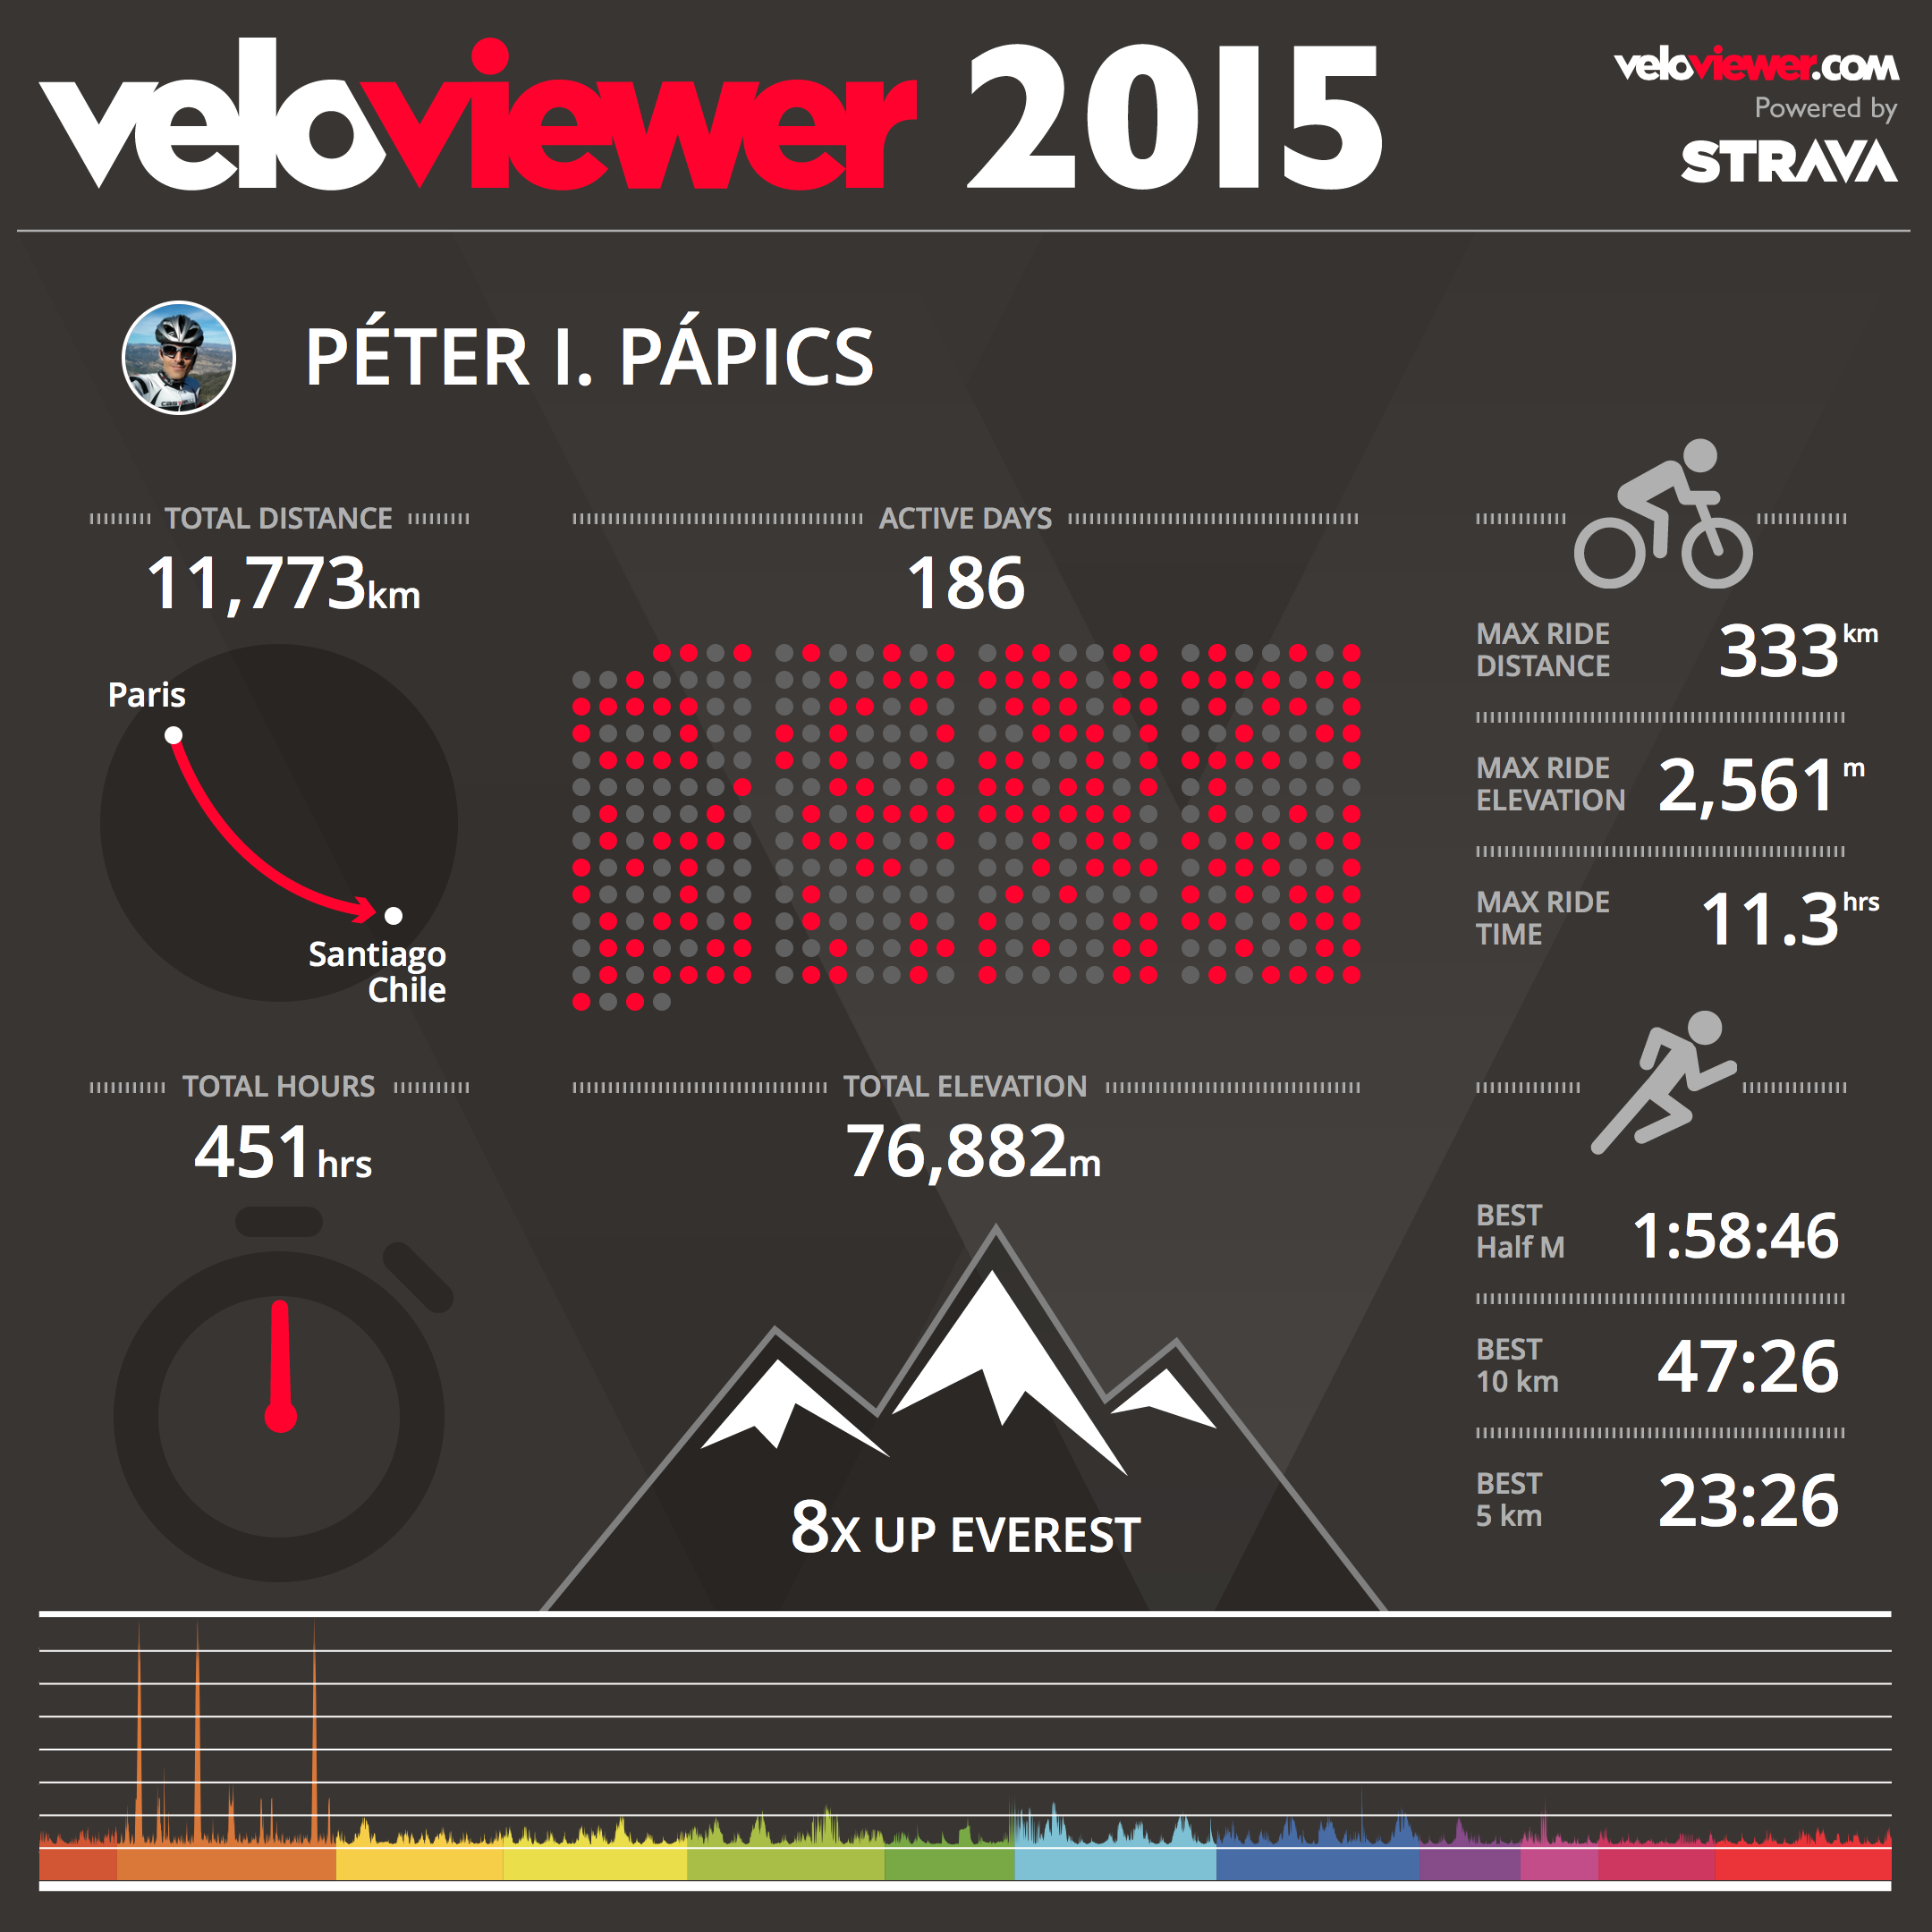
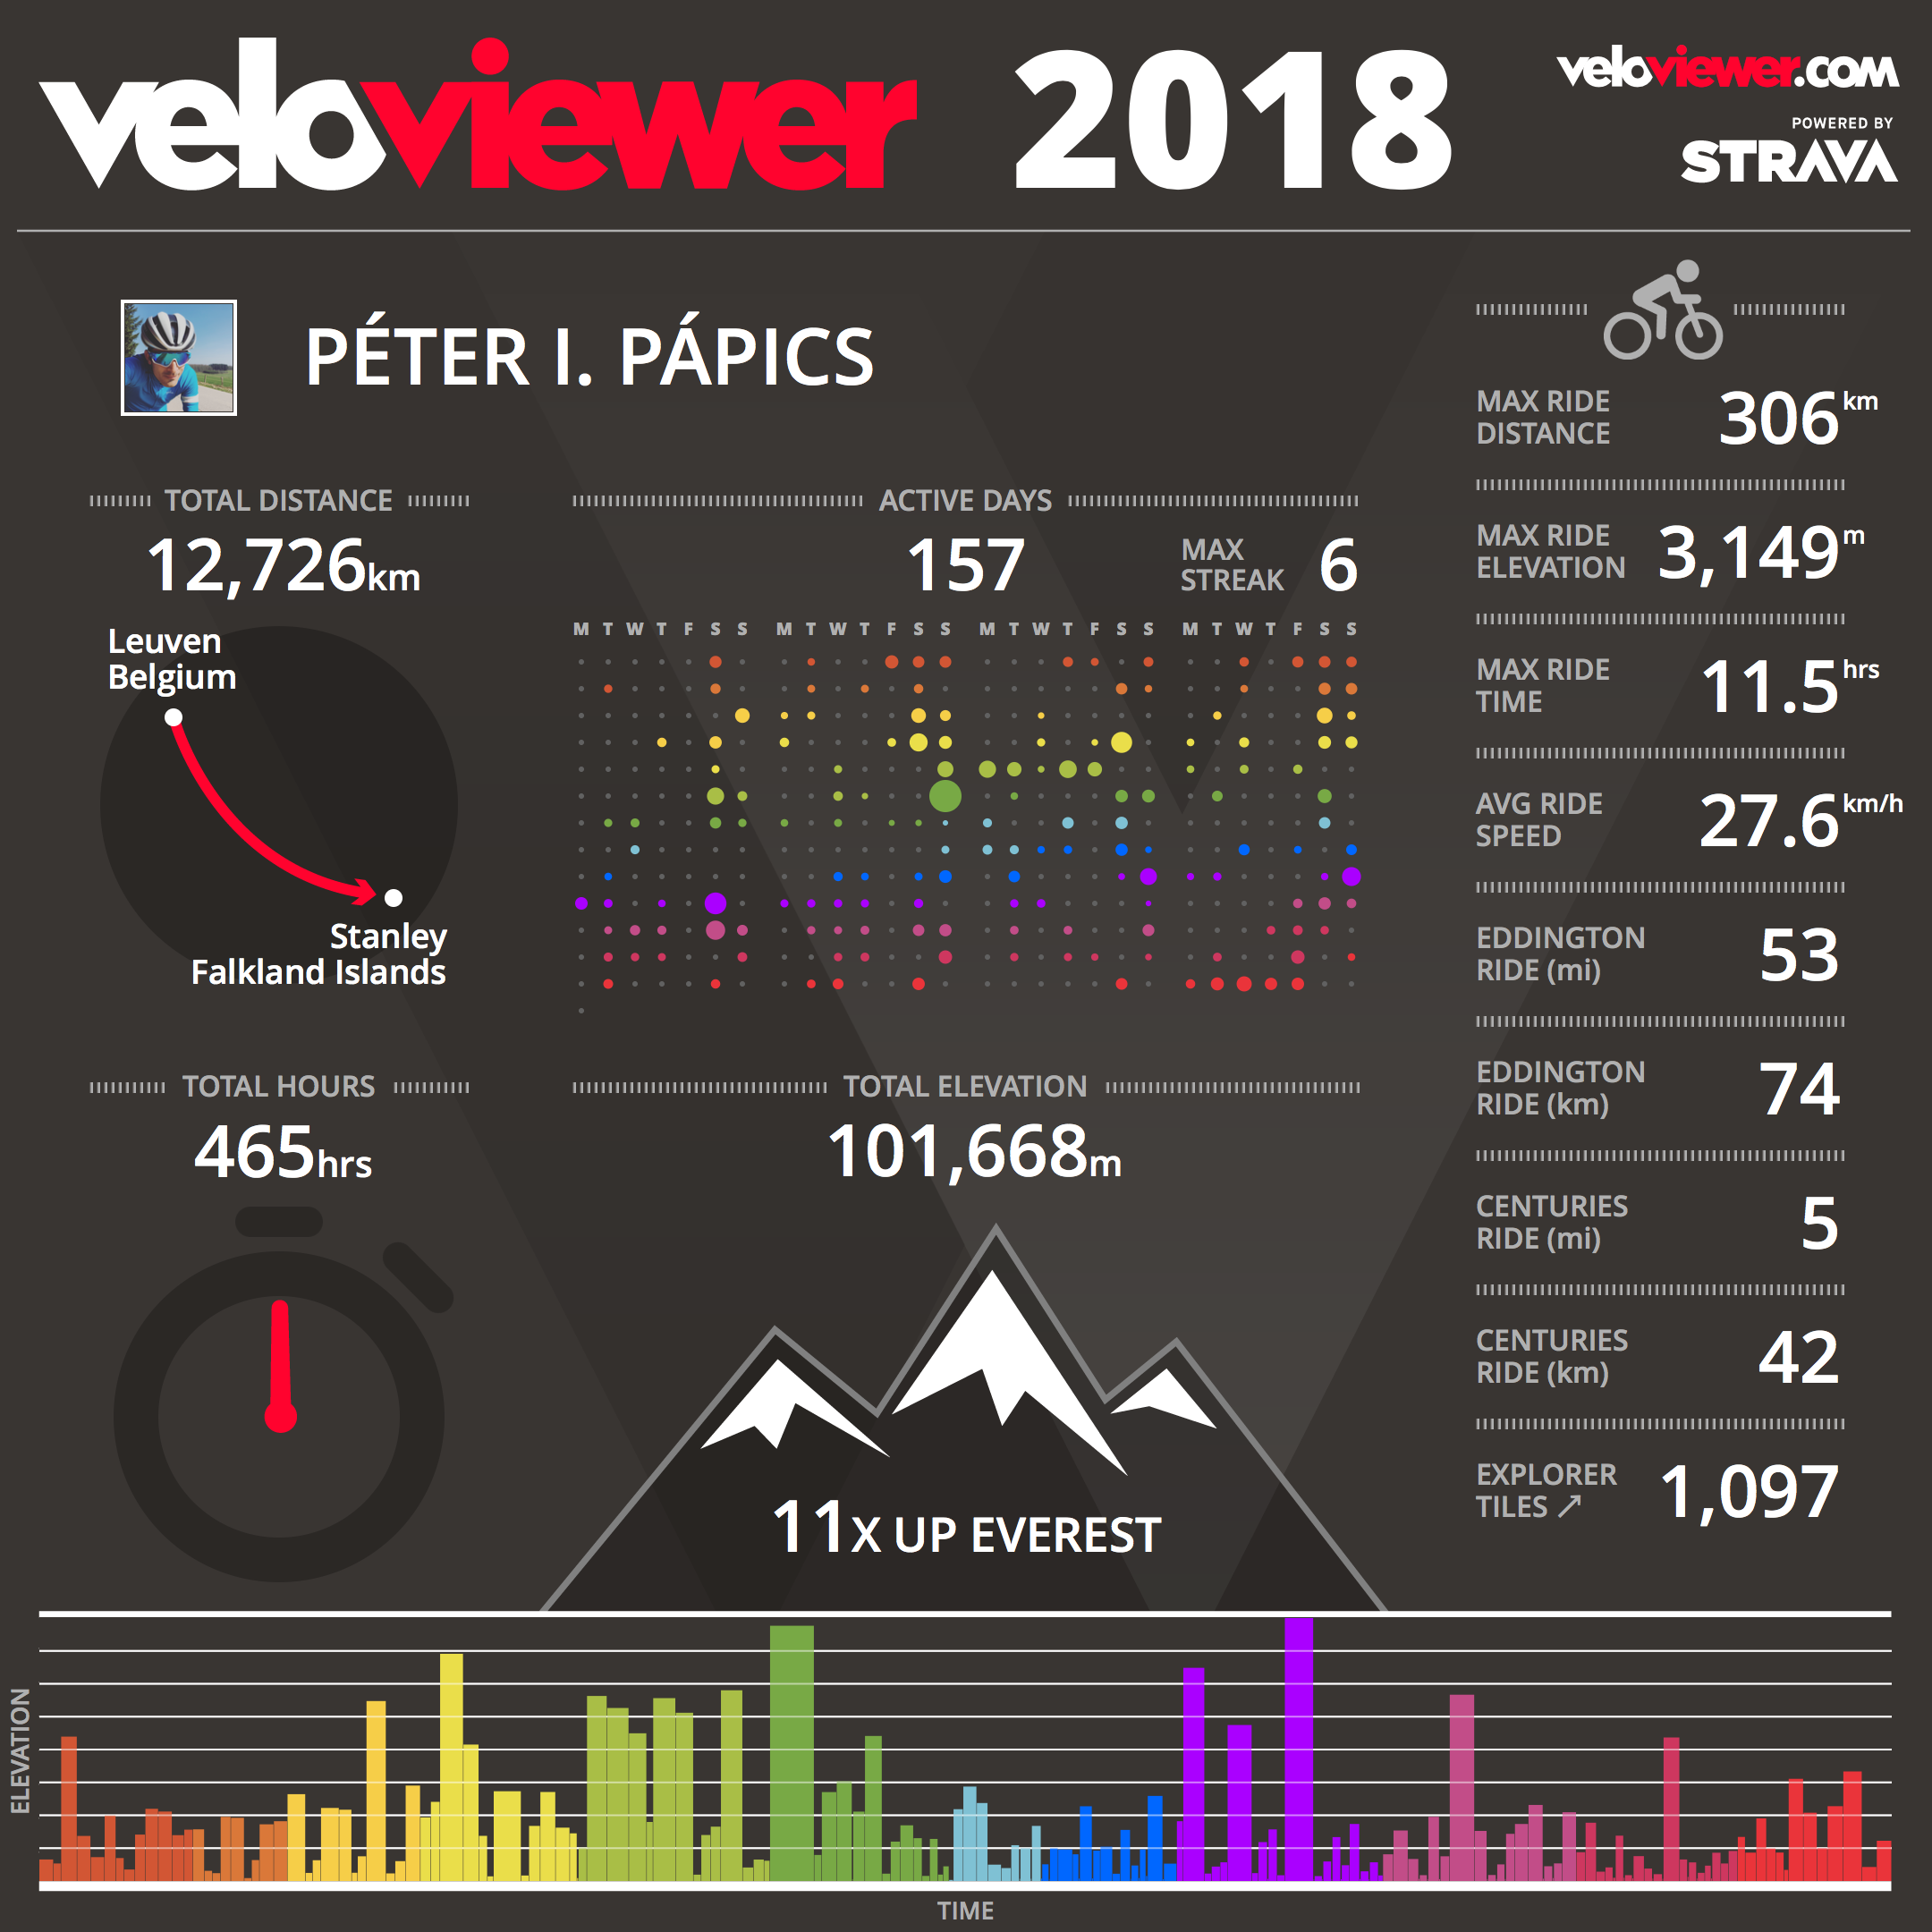
My non-cycling activities reached a long-time low, with only a tiny bit of hiking (17 km), and kayaking (4 km), so this is the first time since 2012 that I did not run at all (and I did not miss it to be honest). Here is the usual summary figure (including all activities) from VeloViewer.
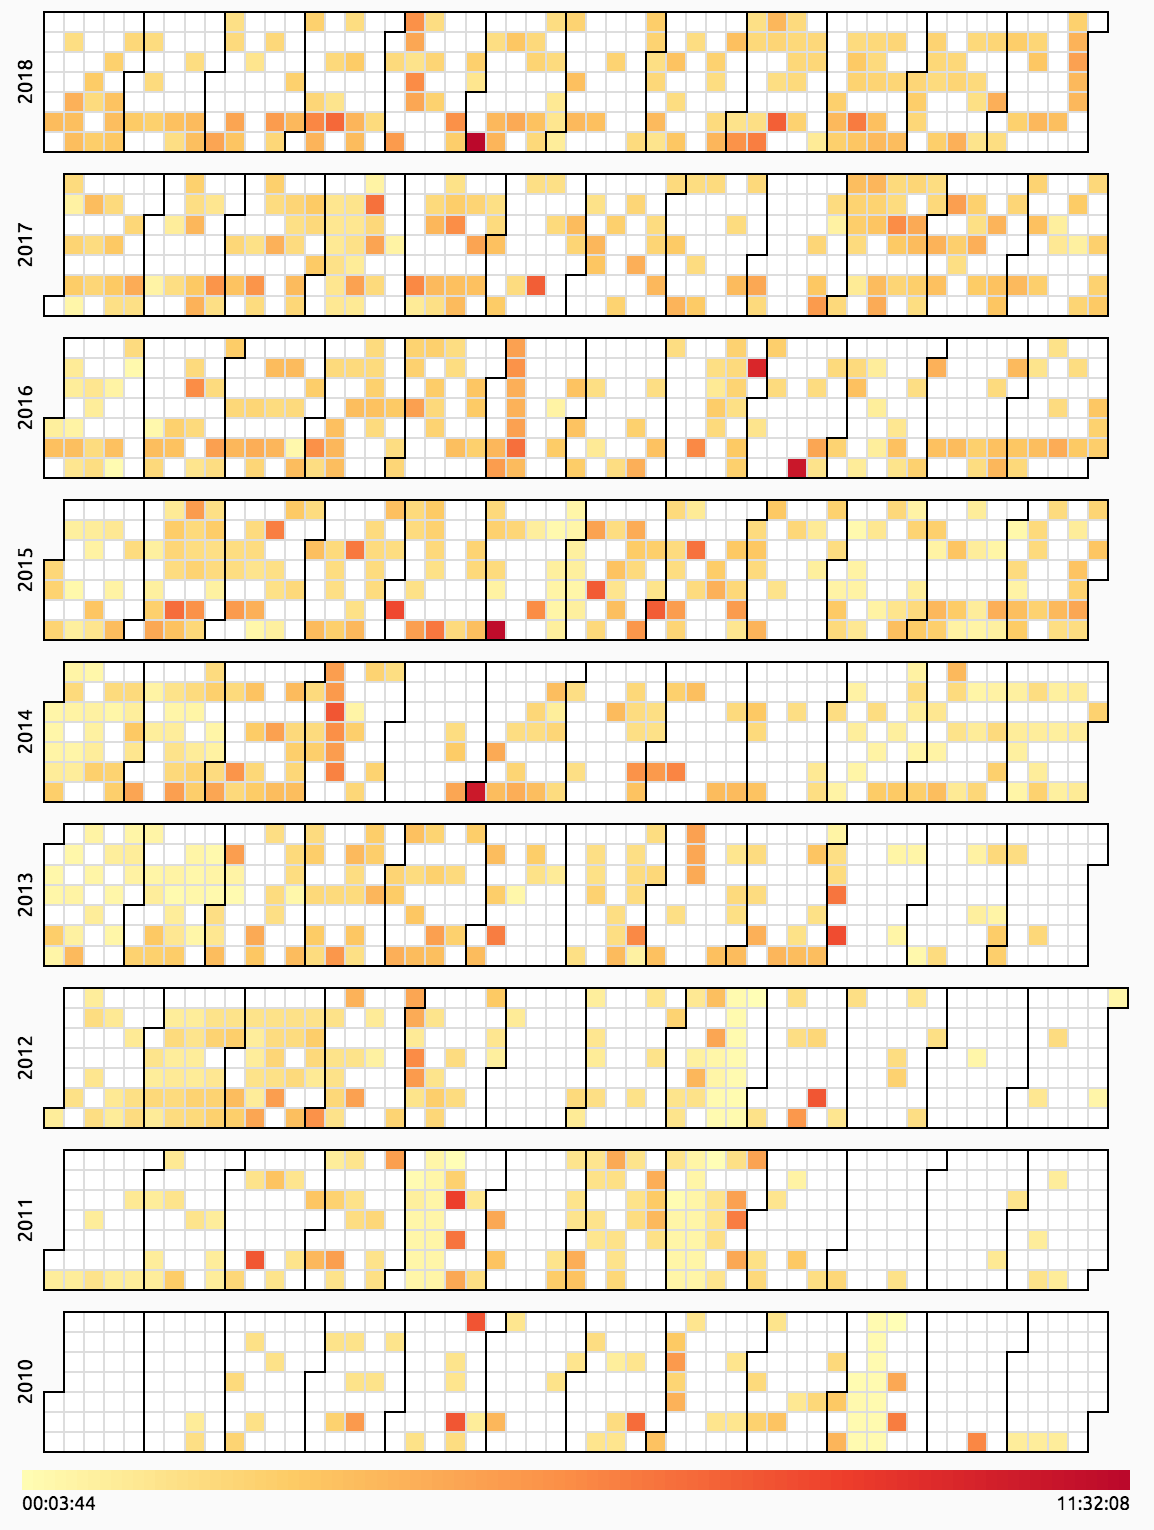
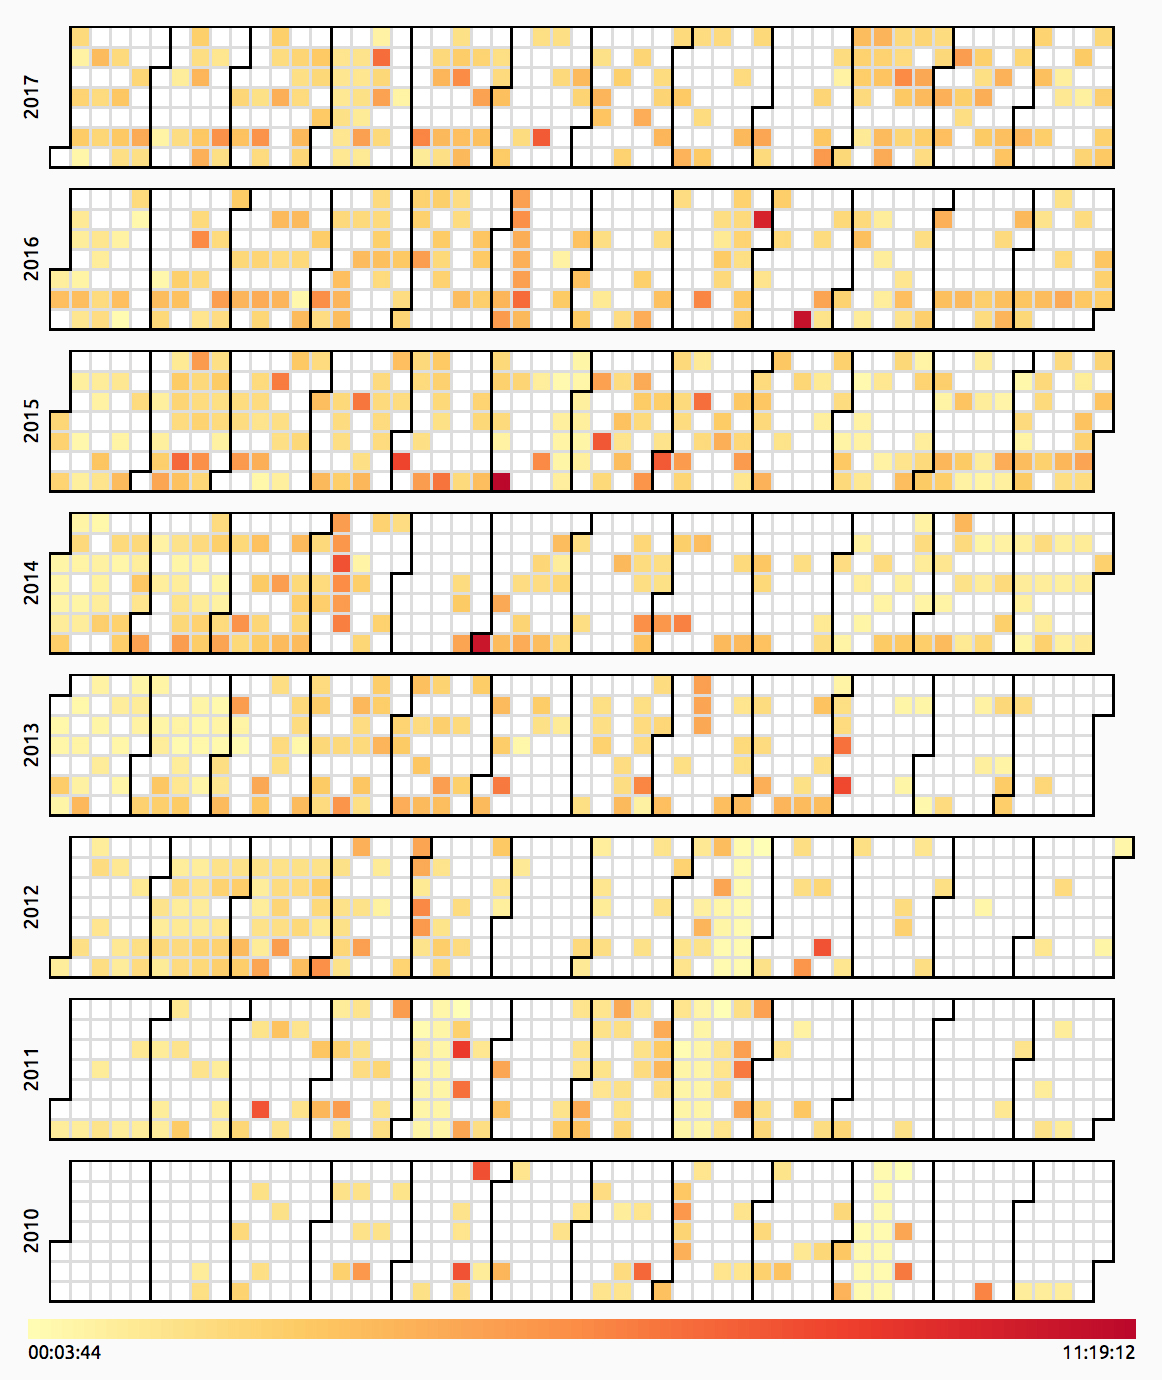
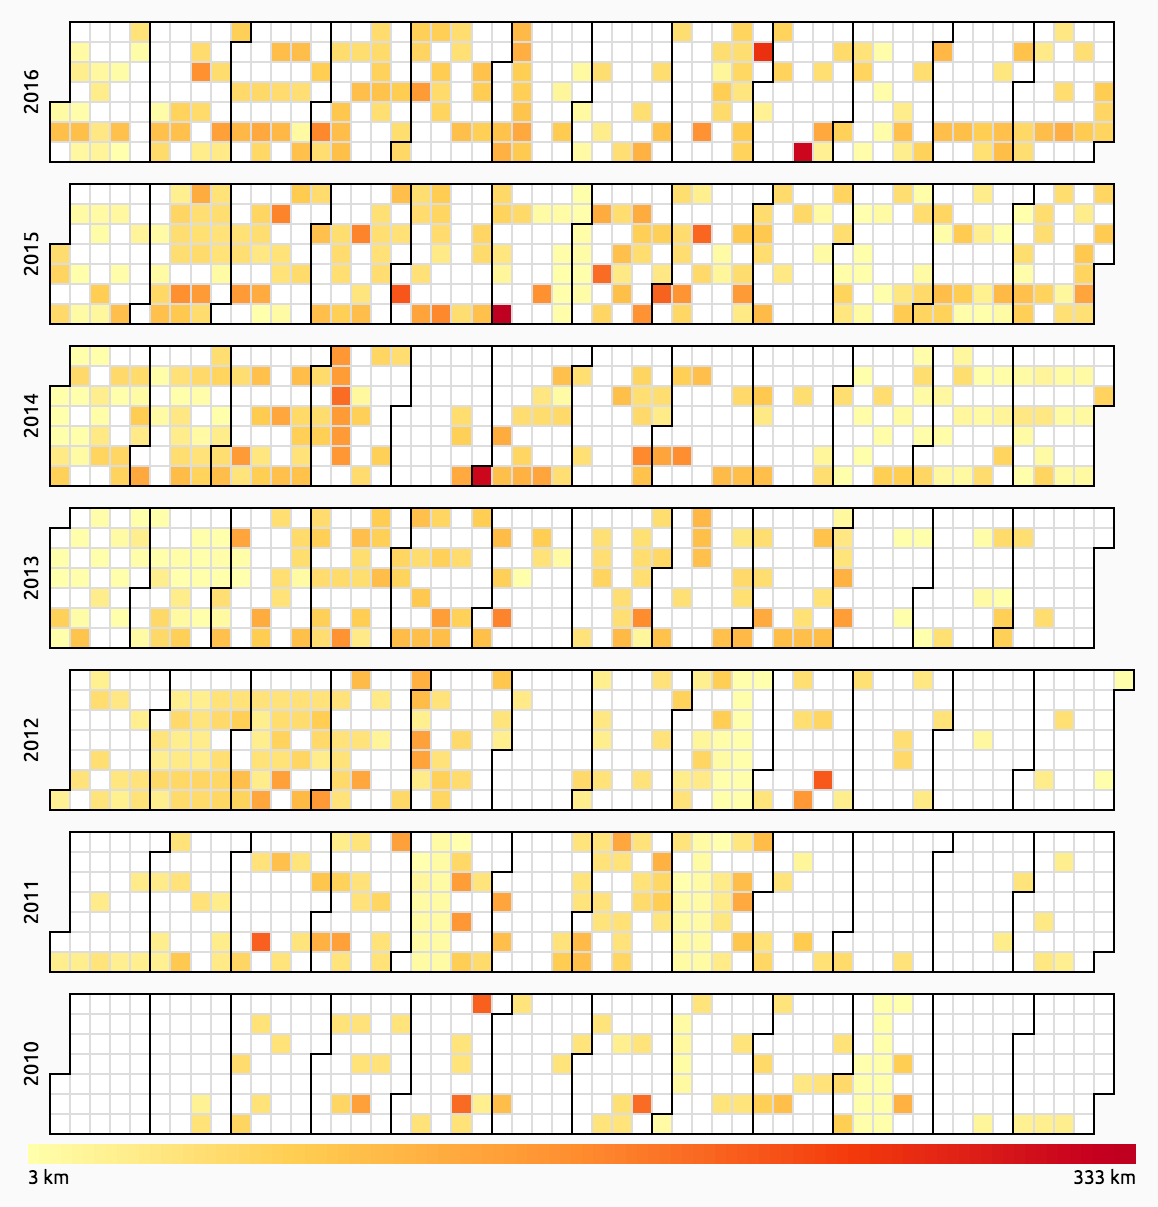
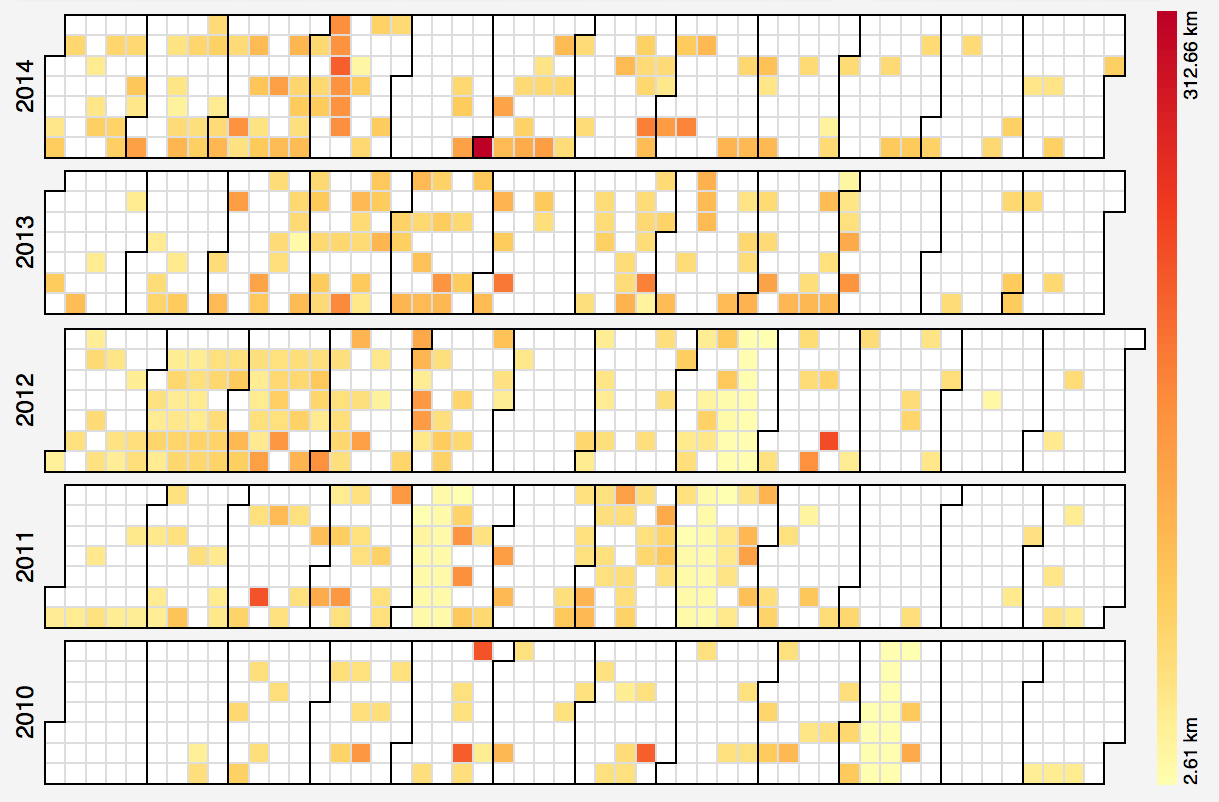
Finally, here is an overview of the evolution of the total activity time (also an all-time record with 465 hours), and its distribution across the calendar throughout the years.