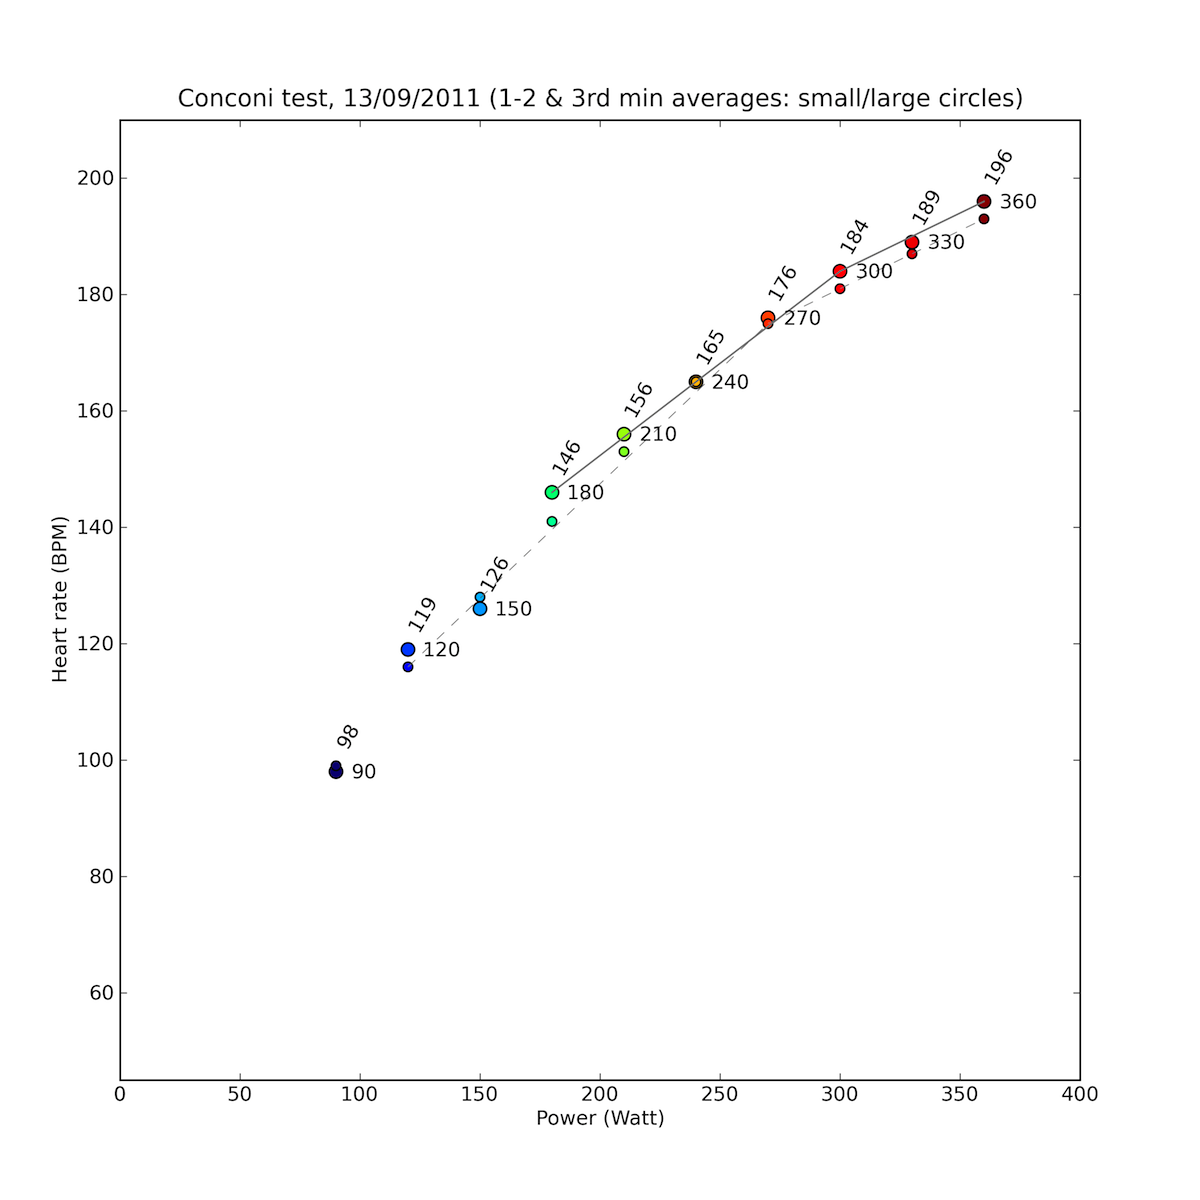
Performance tests are important parts of training. Knowing the Anaerobic Threshold (AT) or – as others tend to call it – the Lactate Threshold (LT) is very important, as training below, at, or above this intensity has very different effects and requirements. (Plus it is used to set heart rate training zones, so it is also used in my workout analyzer script, and I can estimate power from heart rate based on the threshold value.) Also, AT can change a lot with training, so it is a good measure of fitness. The principle behind the Conconi test is that there is a linear relation between heart rate and intensity below threshold, where the slope of this linear changes (and beyond this point, the relation might not even be linear anymore). So when heart rate and intensity is plotted against each other, there should be a deviation point, which marks the threshold level. The test is a relatively easy test to perform and retesting is easy, and the good thing is that you don’t need an expensive power meter, only a midrange indoor trainer, which is capable of directly measuring and setting (via changing the resistance) the intensity. How to do the test? Do a proper (but not too intensive) warm-up, then set a low power level, and maintain a steady pace for three minutes. Then every three minutes, increase the wattage level with 30 Watts until you can not hold it for three minutes anymore. (Then you will be completely KO, but try to spin a couple of minutes to cool down, and try to avoid falling off the trainer – because that is what you will want to do if you really did a maximum effort.) Then calculate the average heart rates for the last minute of every three minute interval, and plot them against the corresponding intensity values. You will get something like this (ok, maybe not as fancy as this, but you get the point…):
This is my test data from this month. The larger circles correspond to the last one minute, and just for comparison, I also plotted the averages from the first two minutes with small markers (which should be a bit lower normally). First of all, it is clear, that at very low intensities, a small change in riding position or breathing rhythm can influence the heart rate significantly, so there the linear relation will not be perfect. But from 170 W on, it is a textbook example (look at the large circles, and the solid lines), the deflection happens at 300 W and a heart rate of 184 BPM (so this is my AT), while I finished the test after three minutes at 360 W and with an average heart rate of 196 BMP in the last minute. From the raw data, my absolute maximum heart rate was 197 BPM (and I think I would say that my threshold is more likely to be 181-183 BPM). These are all quite good values for a 26 year old PhD student, who also bikes occasionally ;D
By the way, this month I have not been training that much, because first the weather was crappy after (and while) riding on the F1 track, then I had Mariann visiting me on the 2nd weekend (which was really nice, even though now I have been to Brugge more than my Belgian friends…), then the weather was crap again, then I got sick (just a cold), and as it is the end of the season I had no real motivation anymore. (Luckily my work related motivation is rising lately!) I hope this sickness will be gone by the weekend, because the weather will be nice, and I really need a good ride now…
