2017 was the third year in a row that I managed to bike more than 10000 kilometres, and mostly thanks to the combination of great weather and plenty of free time in October, I even made this my best cycling-year ever with 11330 km (but only with a tiny margin over 2015). October became my best month ever by a landslide, totalling in 1813 km, 65h 48m, and 9218 m of elevation gain.
I had no special plans for this year, but I still managed to collect plenty of long-lasting memories on the road. First of all, for the first time since 2013 (and likely for the last time), I took my racing bike to La Palma again to ride during and after my observing run, and since I gained some free time by having a drivers licence, I could put in some extra hours of quality high-altitude training while working at the observatory too. I had a slight insomnia problem afterwards, but still managed to pull off two epic rides around the island (and a few shorter ones). I also did a few beautiful (solo) rides in the Ardennes, which I hope to do more in 2018, because one of my favourite things in cycling is still discovering new, scenic, and quite roads. For the first time ever I finally had a positive experience in a race while participating in the 12 hours of Zolder with Squadra Tornado: I felt strong in my shifts, I contributed to the race, and I came away fully satisfied at the end.
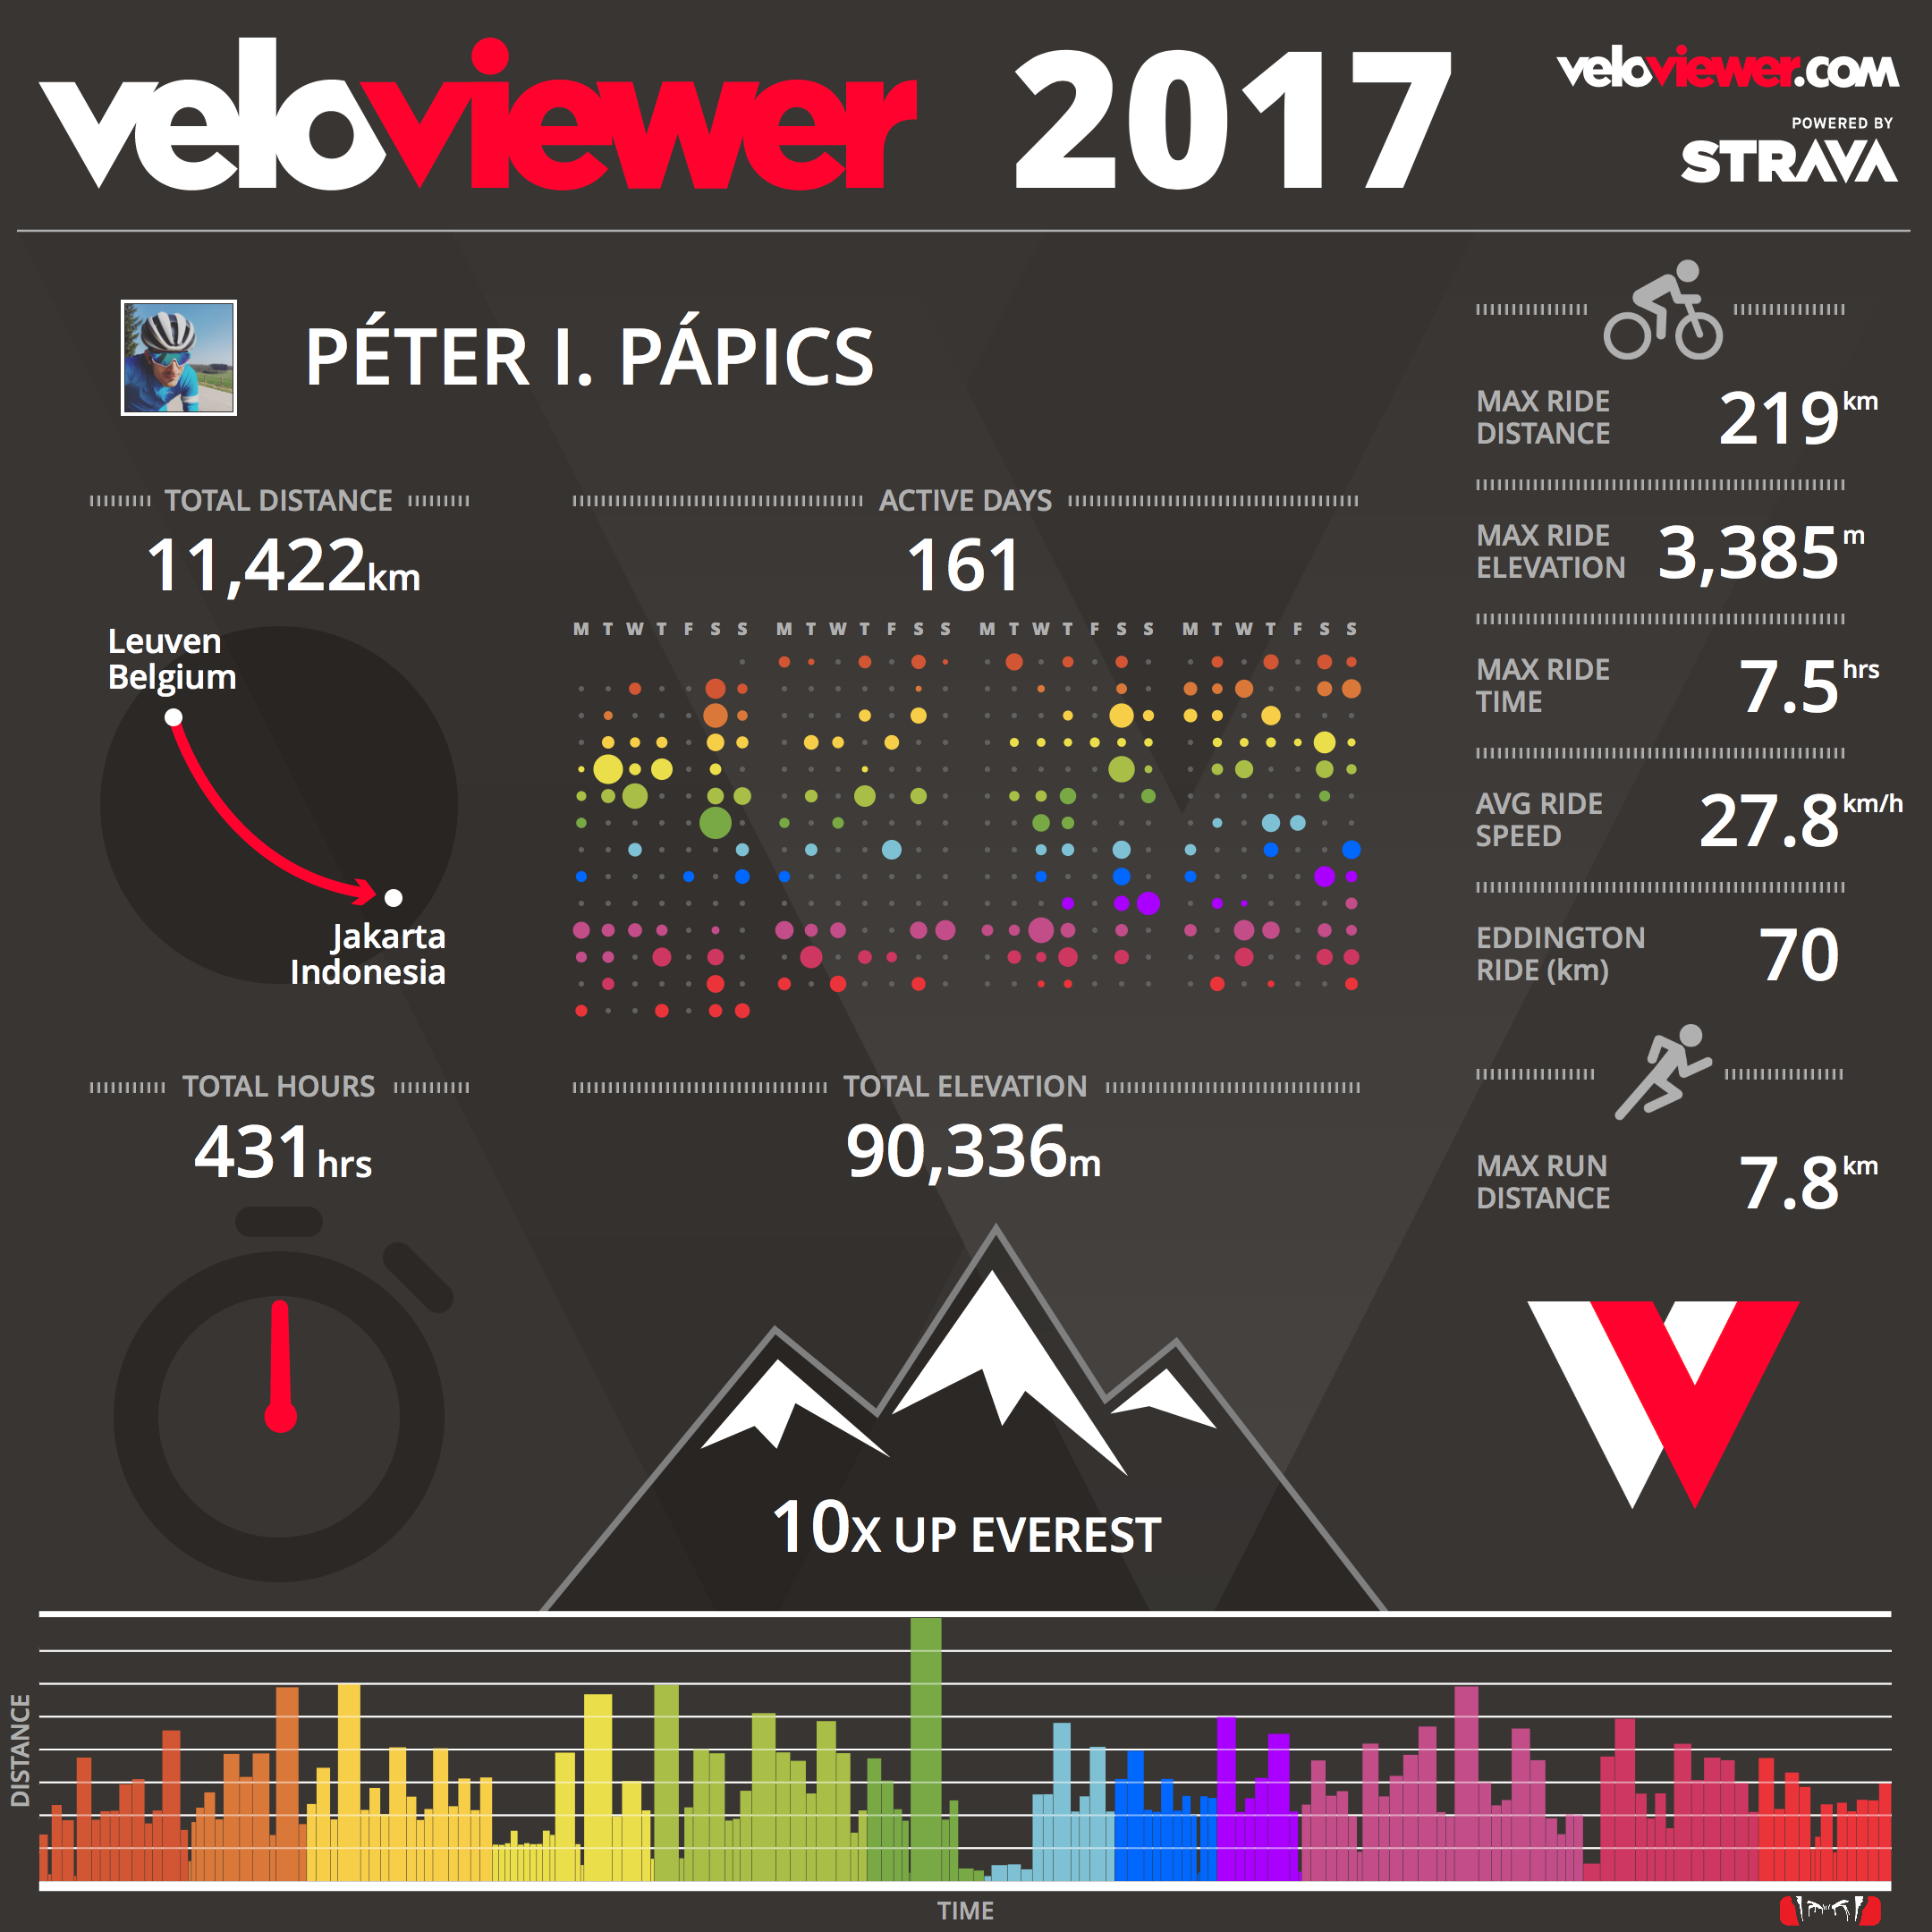
The raw numbers for my cycling – without the daily commutes of course – in 2017:
Total distance: 11330 km
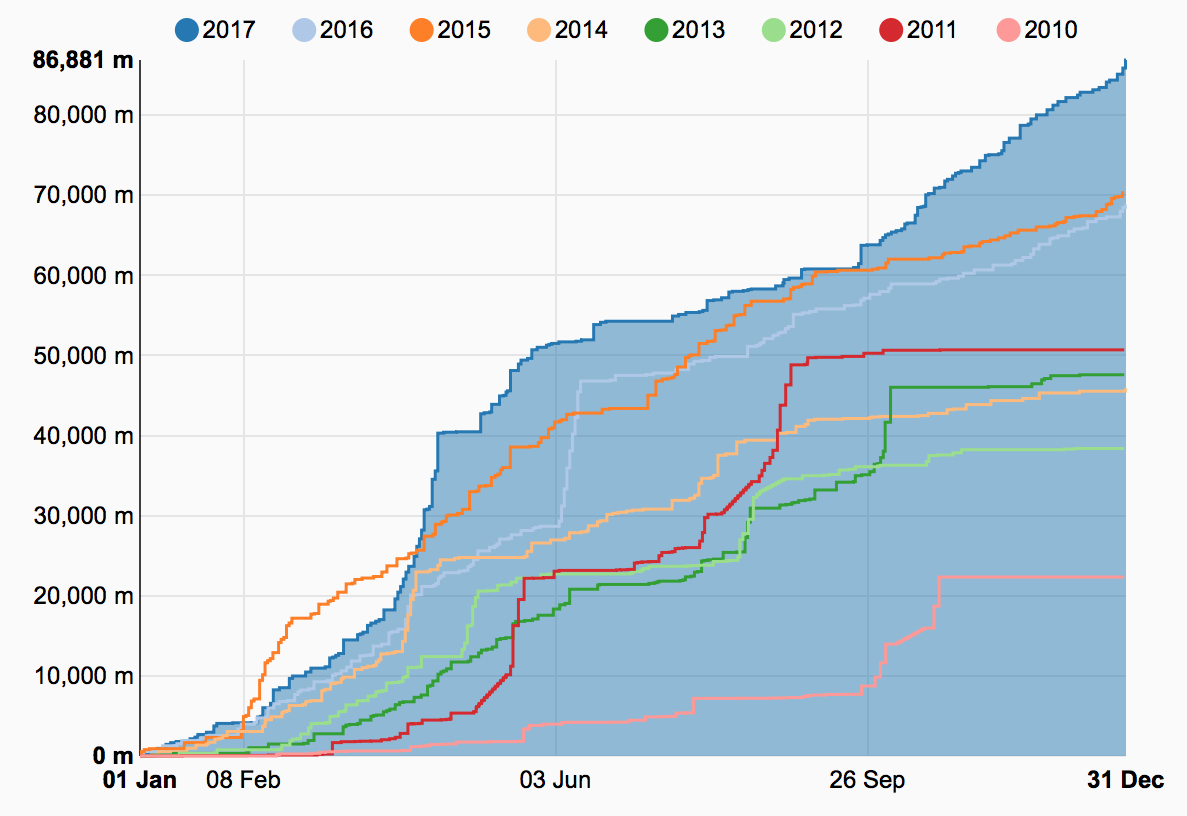
Total elevation gain: 86881 m
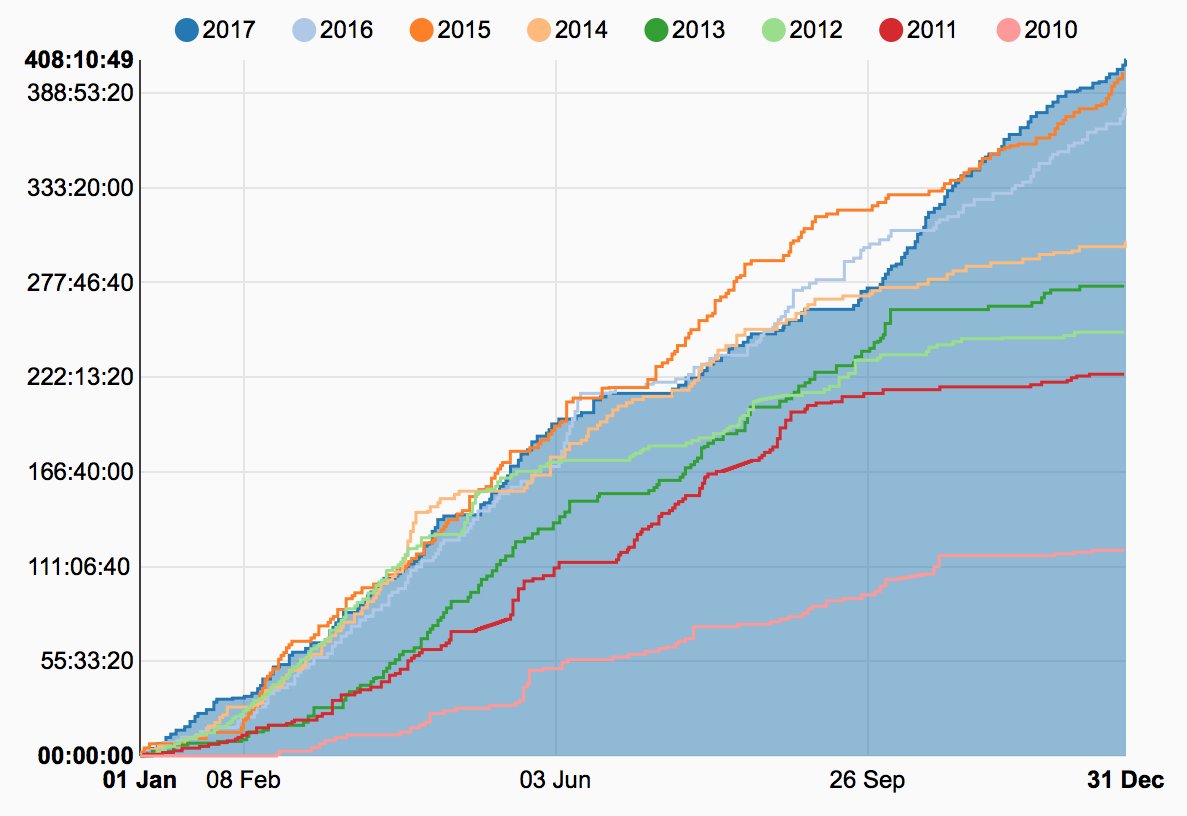
Total time: 408h 10m
Activity count: 155
Average speed: 27.8 km/h
Average heart rate: 151.9 bpm (max: 199 bpm, after 2.5 weeks of rest, uphill sprint)
Average cadence: 88 rpm (but I only have cadence measurement on my road bike)
Average temperature: 13.2°C (quite average, but with a very cold 0.6°C January)
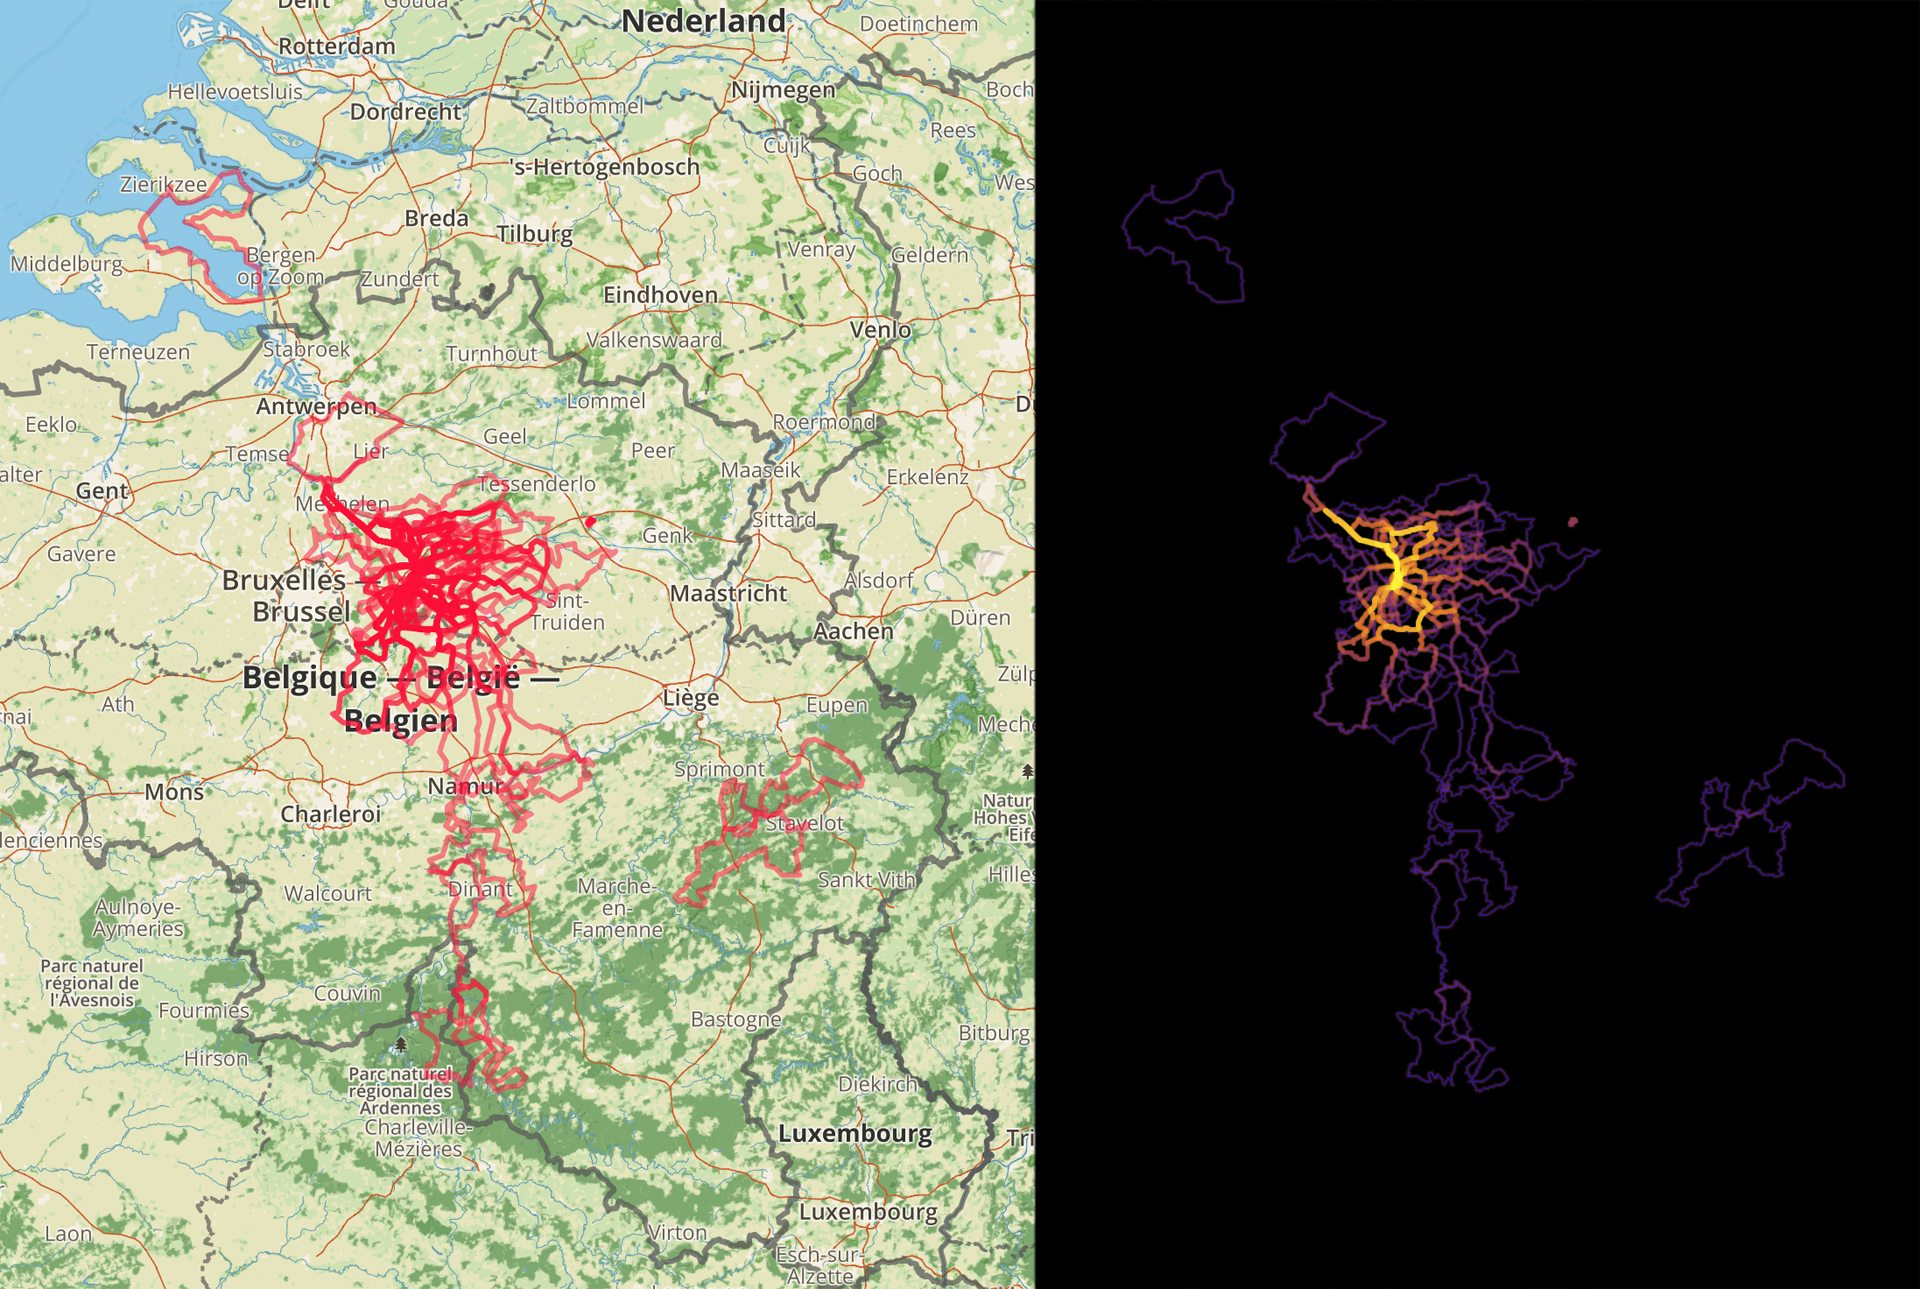
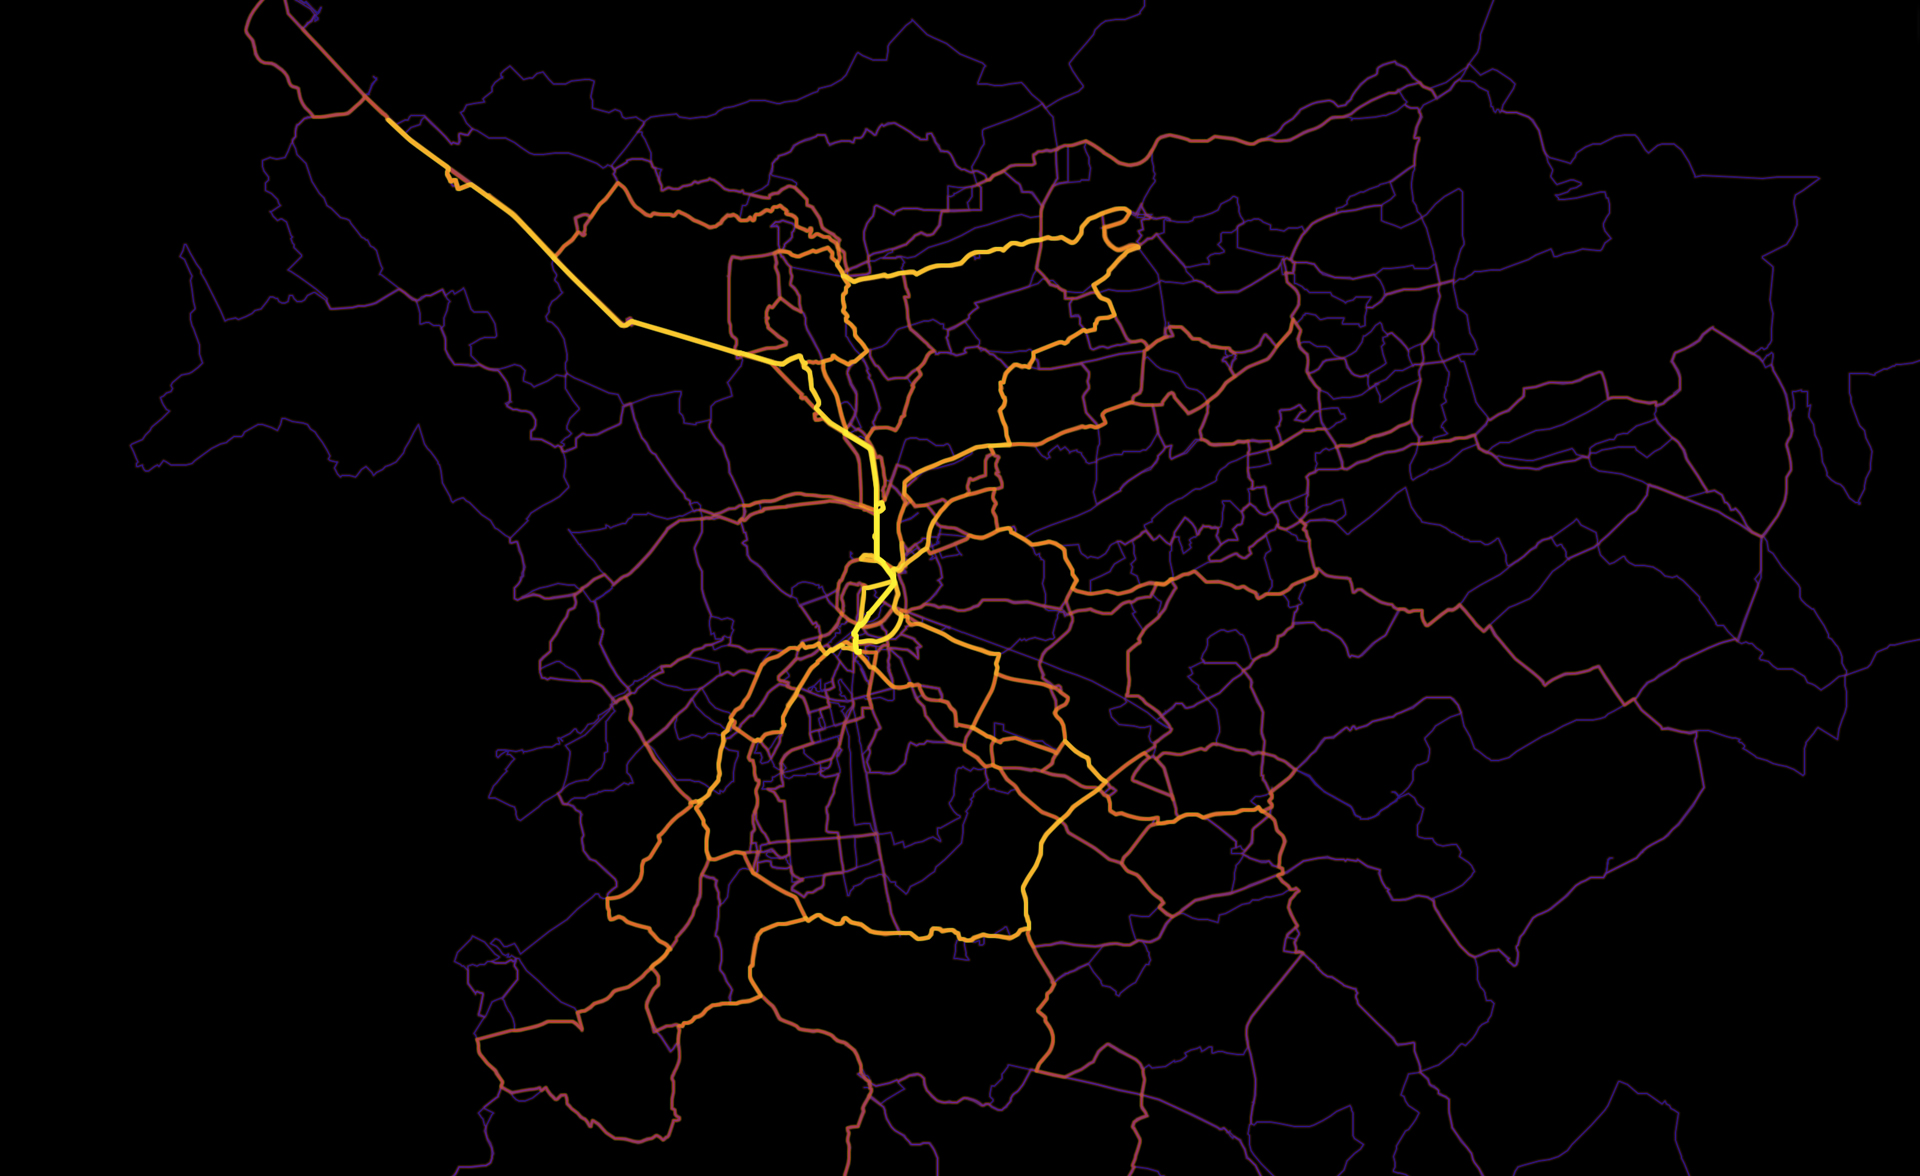
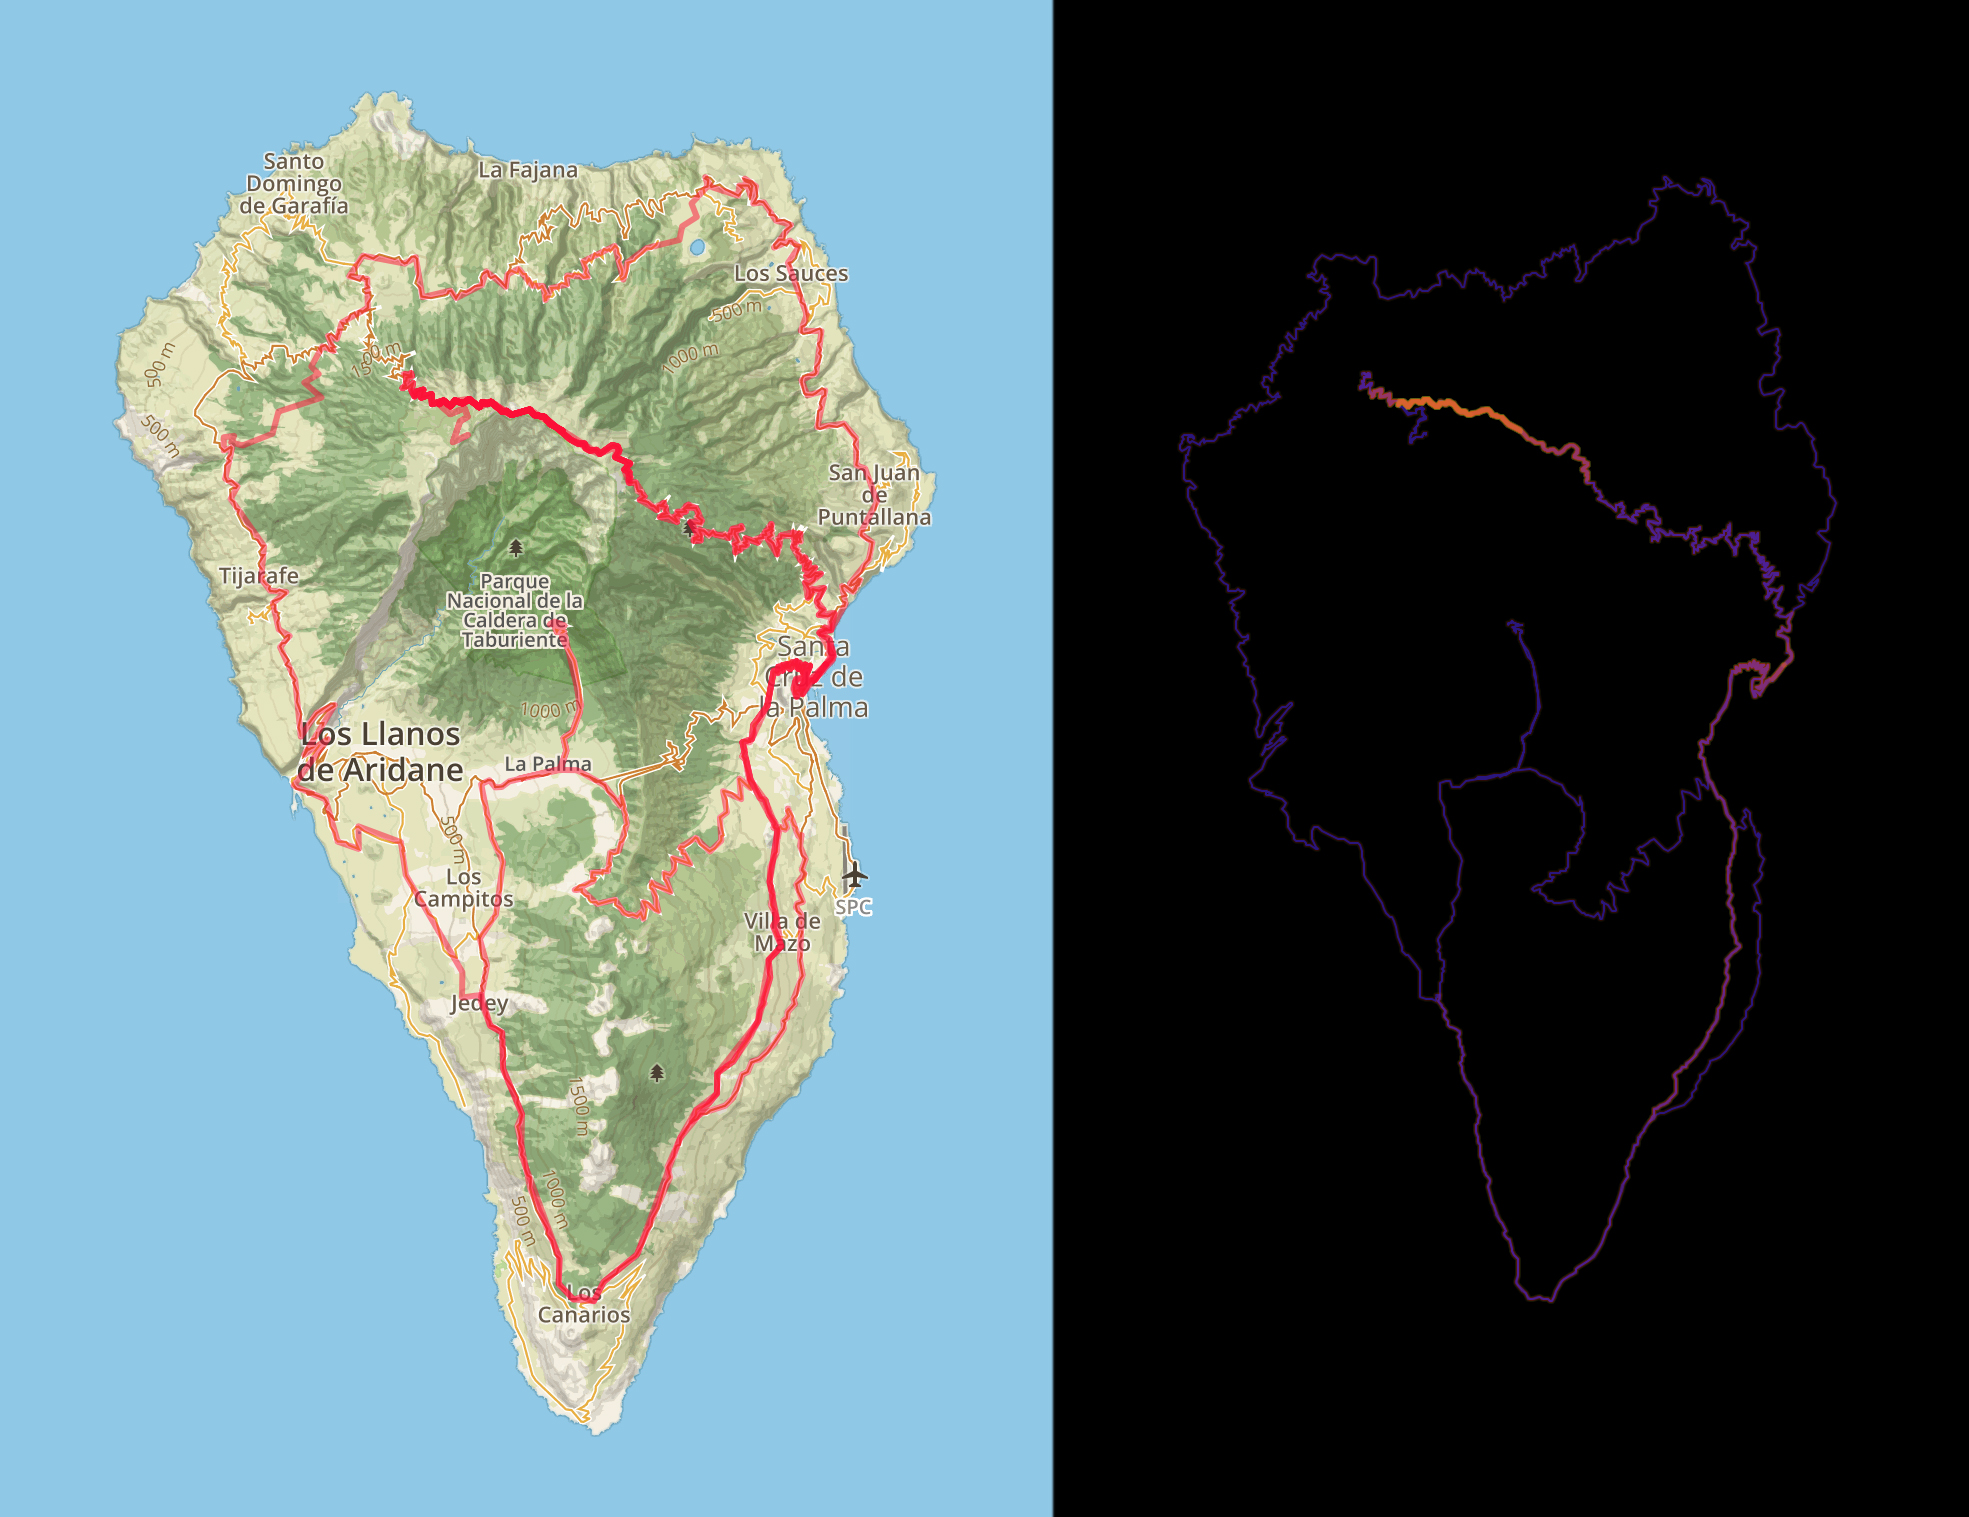
And now it is time to look at some maps and figures. Let’s start with the maps of cycling I have done this year. The first two maps show rides mostly in Belgium (with a zoom-in to the heat-map around Leuven), while the third is for La Palma.
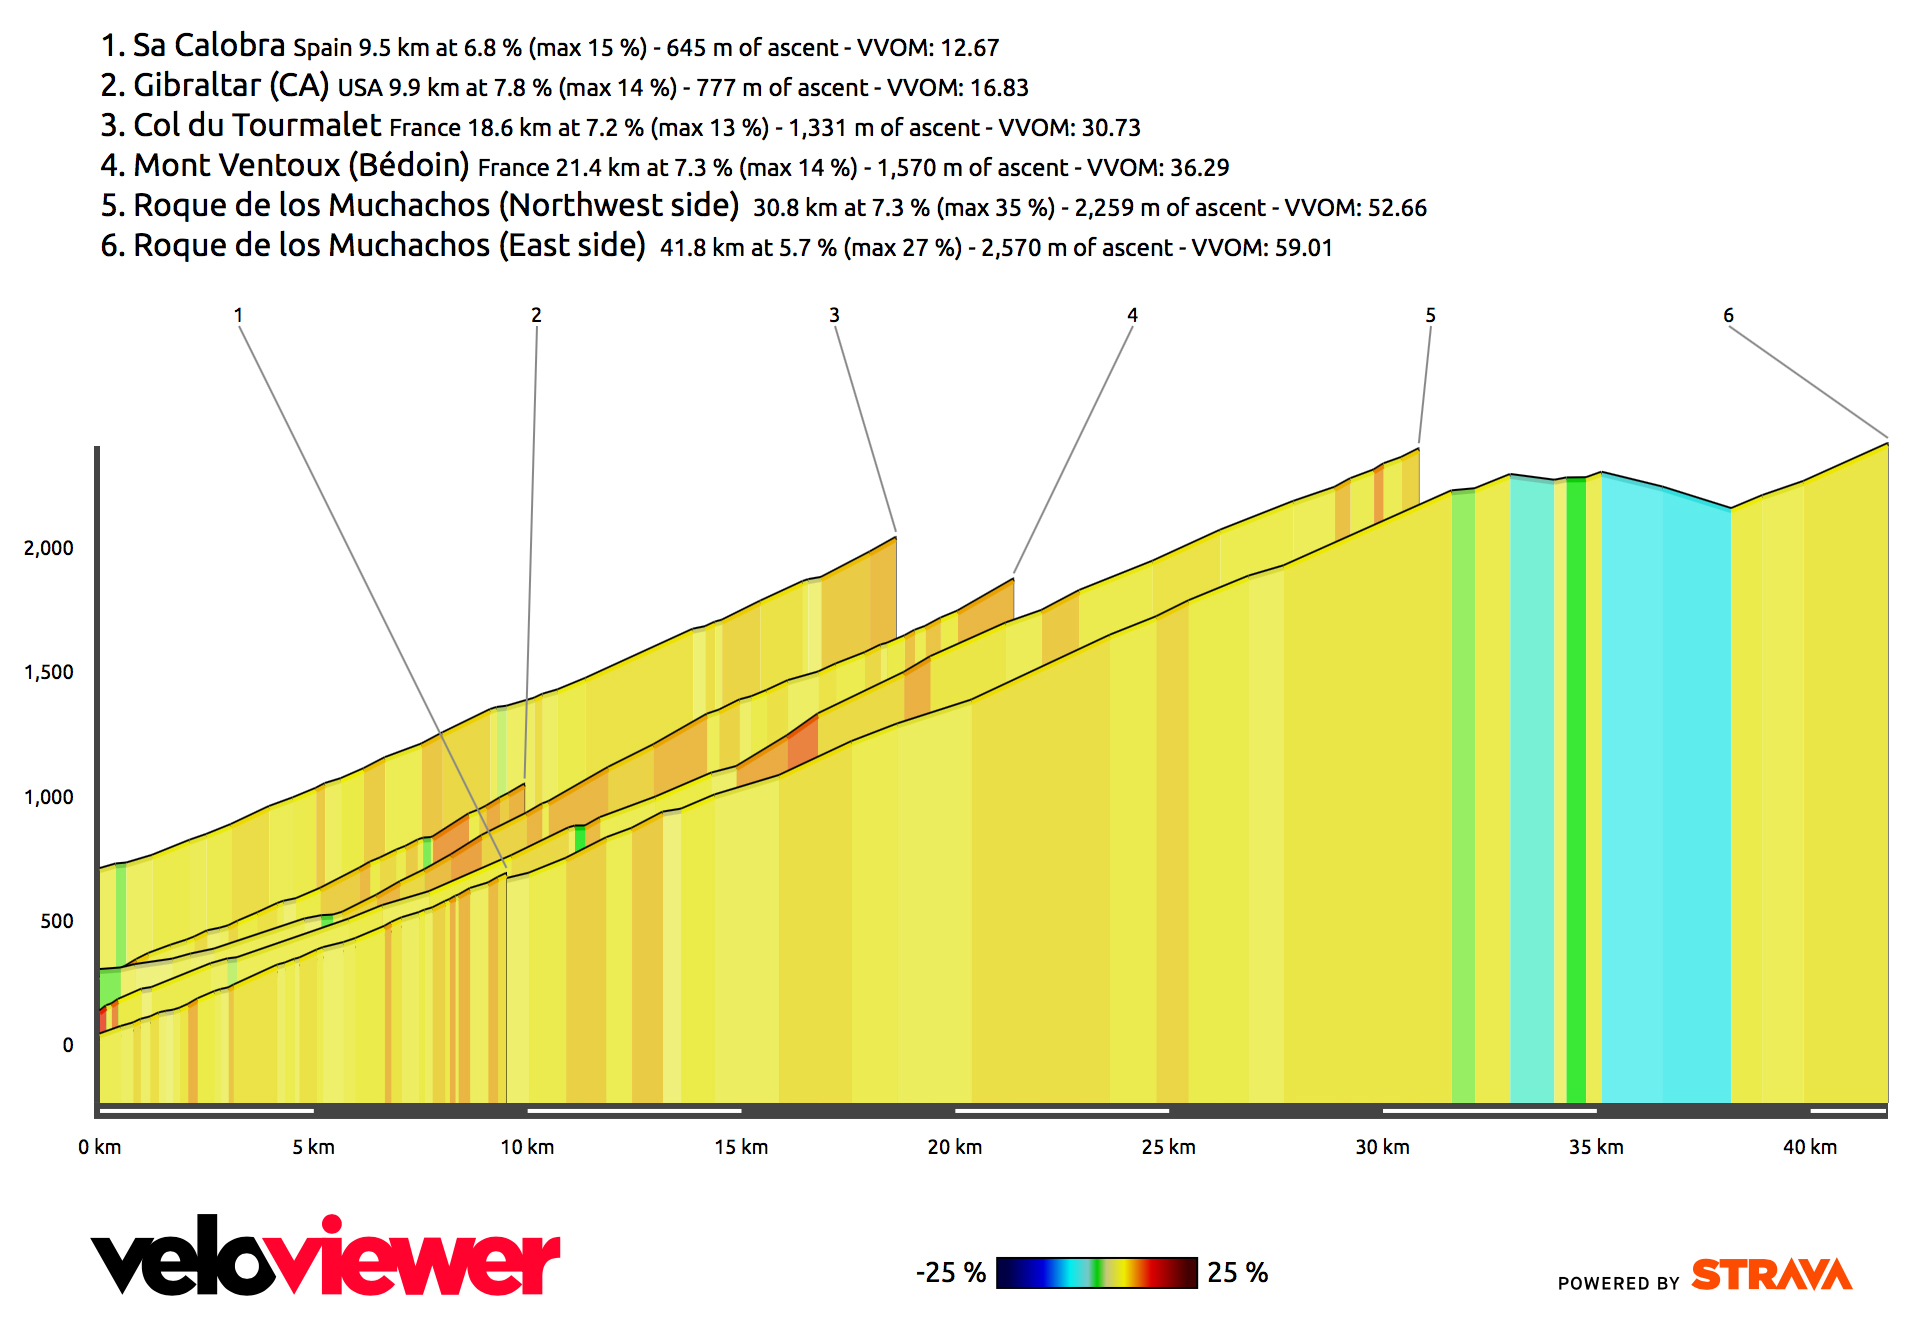
Just for the fun, here is a comparison of some of the bigger / more famous climbs I have done the past few years, with the last two being here on La Palma (although this year I only did the very last in this list).
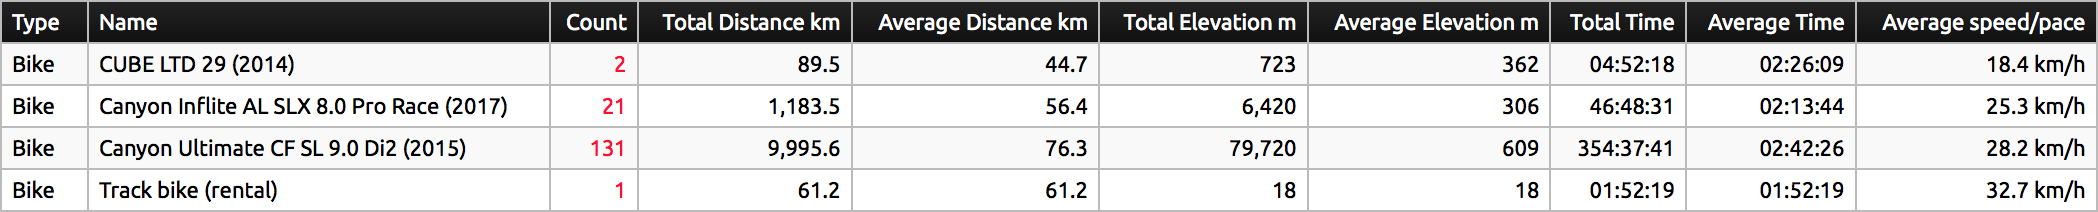
Out of the 155 activities, 110 were done solo, and 45 with at least another training partner, which means that I biked much more often alone this year. My most common partners in crime were Willem (23 times, for a total of 2.2 days) and his brother, Steven (19 times, 1.9 days). Here is a summary table of the rides by bike (note: the average speed for the track bike is incorrect).
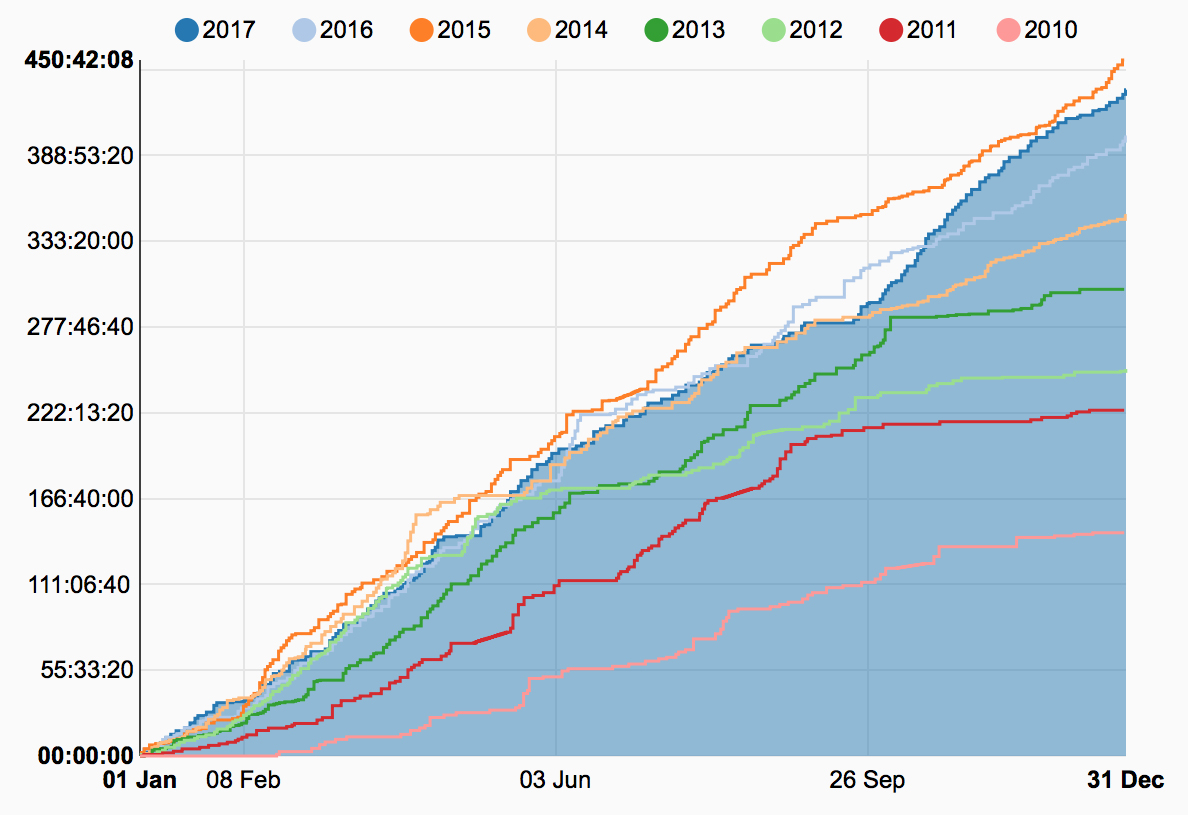
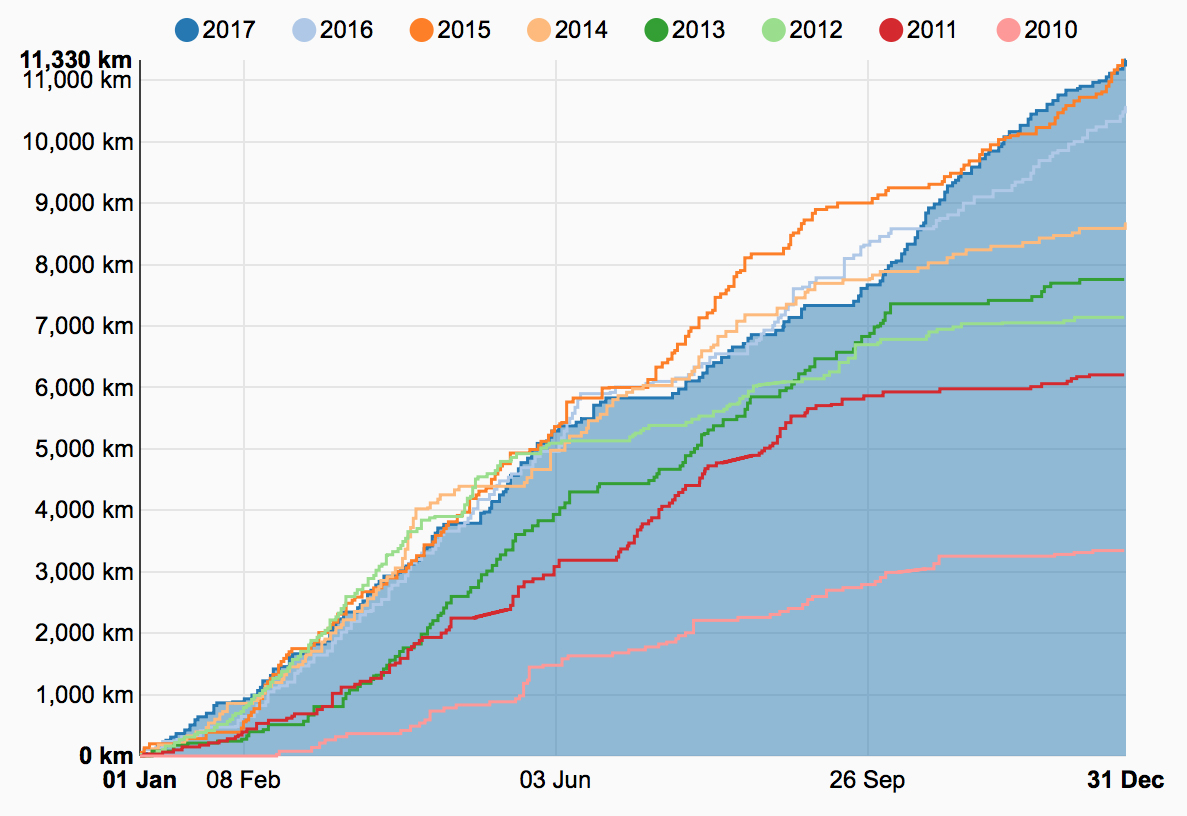
Here are the graphs showing the yearly evolution of my cycling distance, time, and elevation gain compared to the previous years.
I also did a little bit of running (17.7 km) and hiking (74.8 km), adding up to a total activity time of 431 hours, which is not much worse than in 2015 (~450 hours, because I did much more running back then, besides almost the same amount of cycling). That is ~255000 extra calories burned!
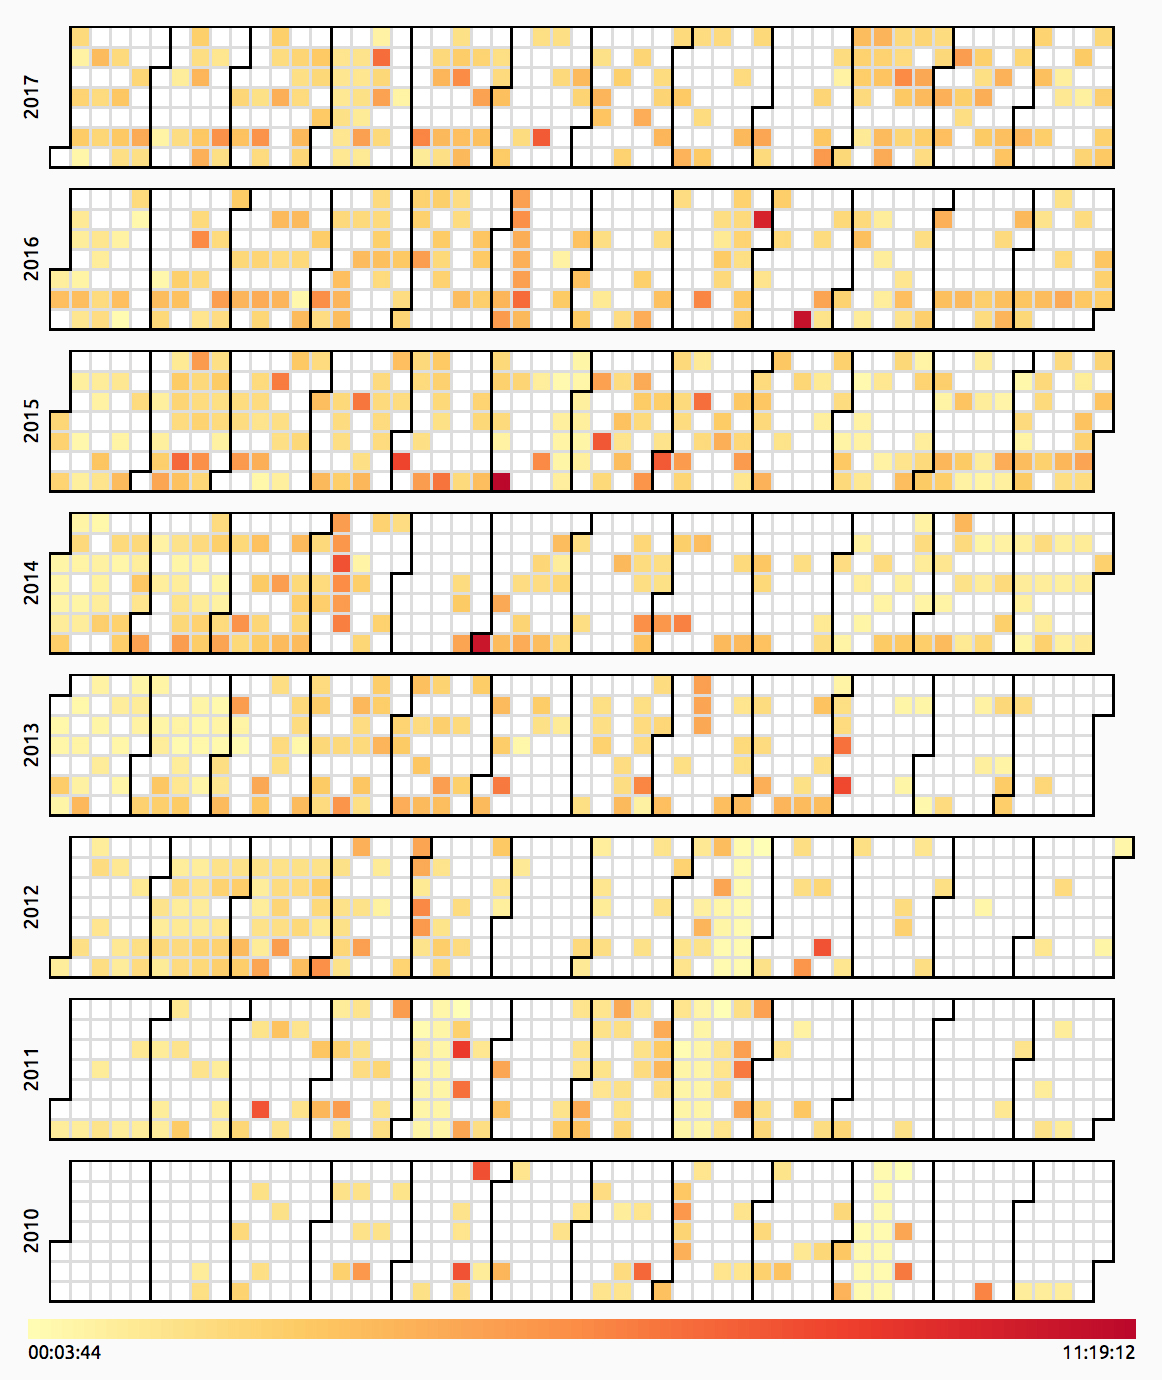
Finally, here is an overview of the evolution of the total activity time, and its distribution across the calendar throughout the years.