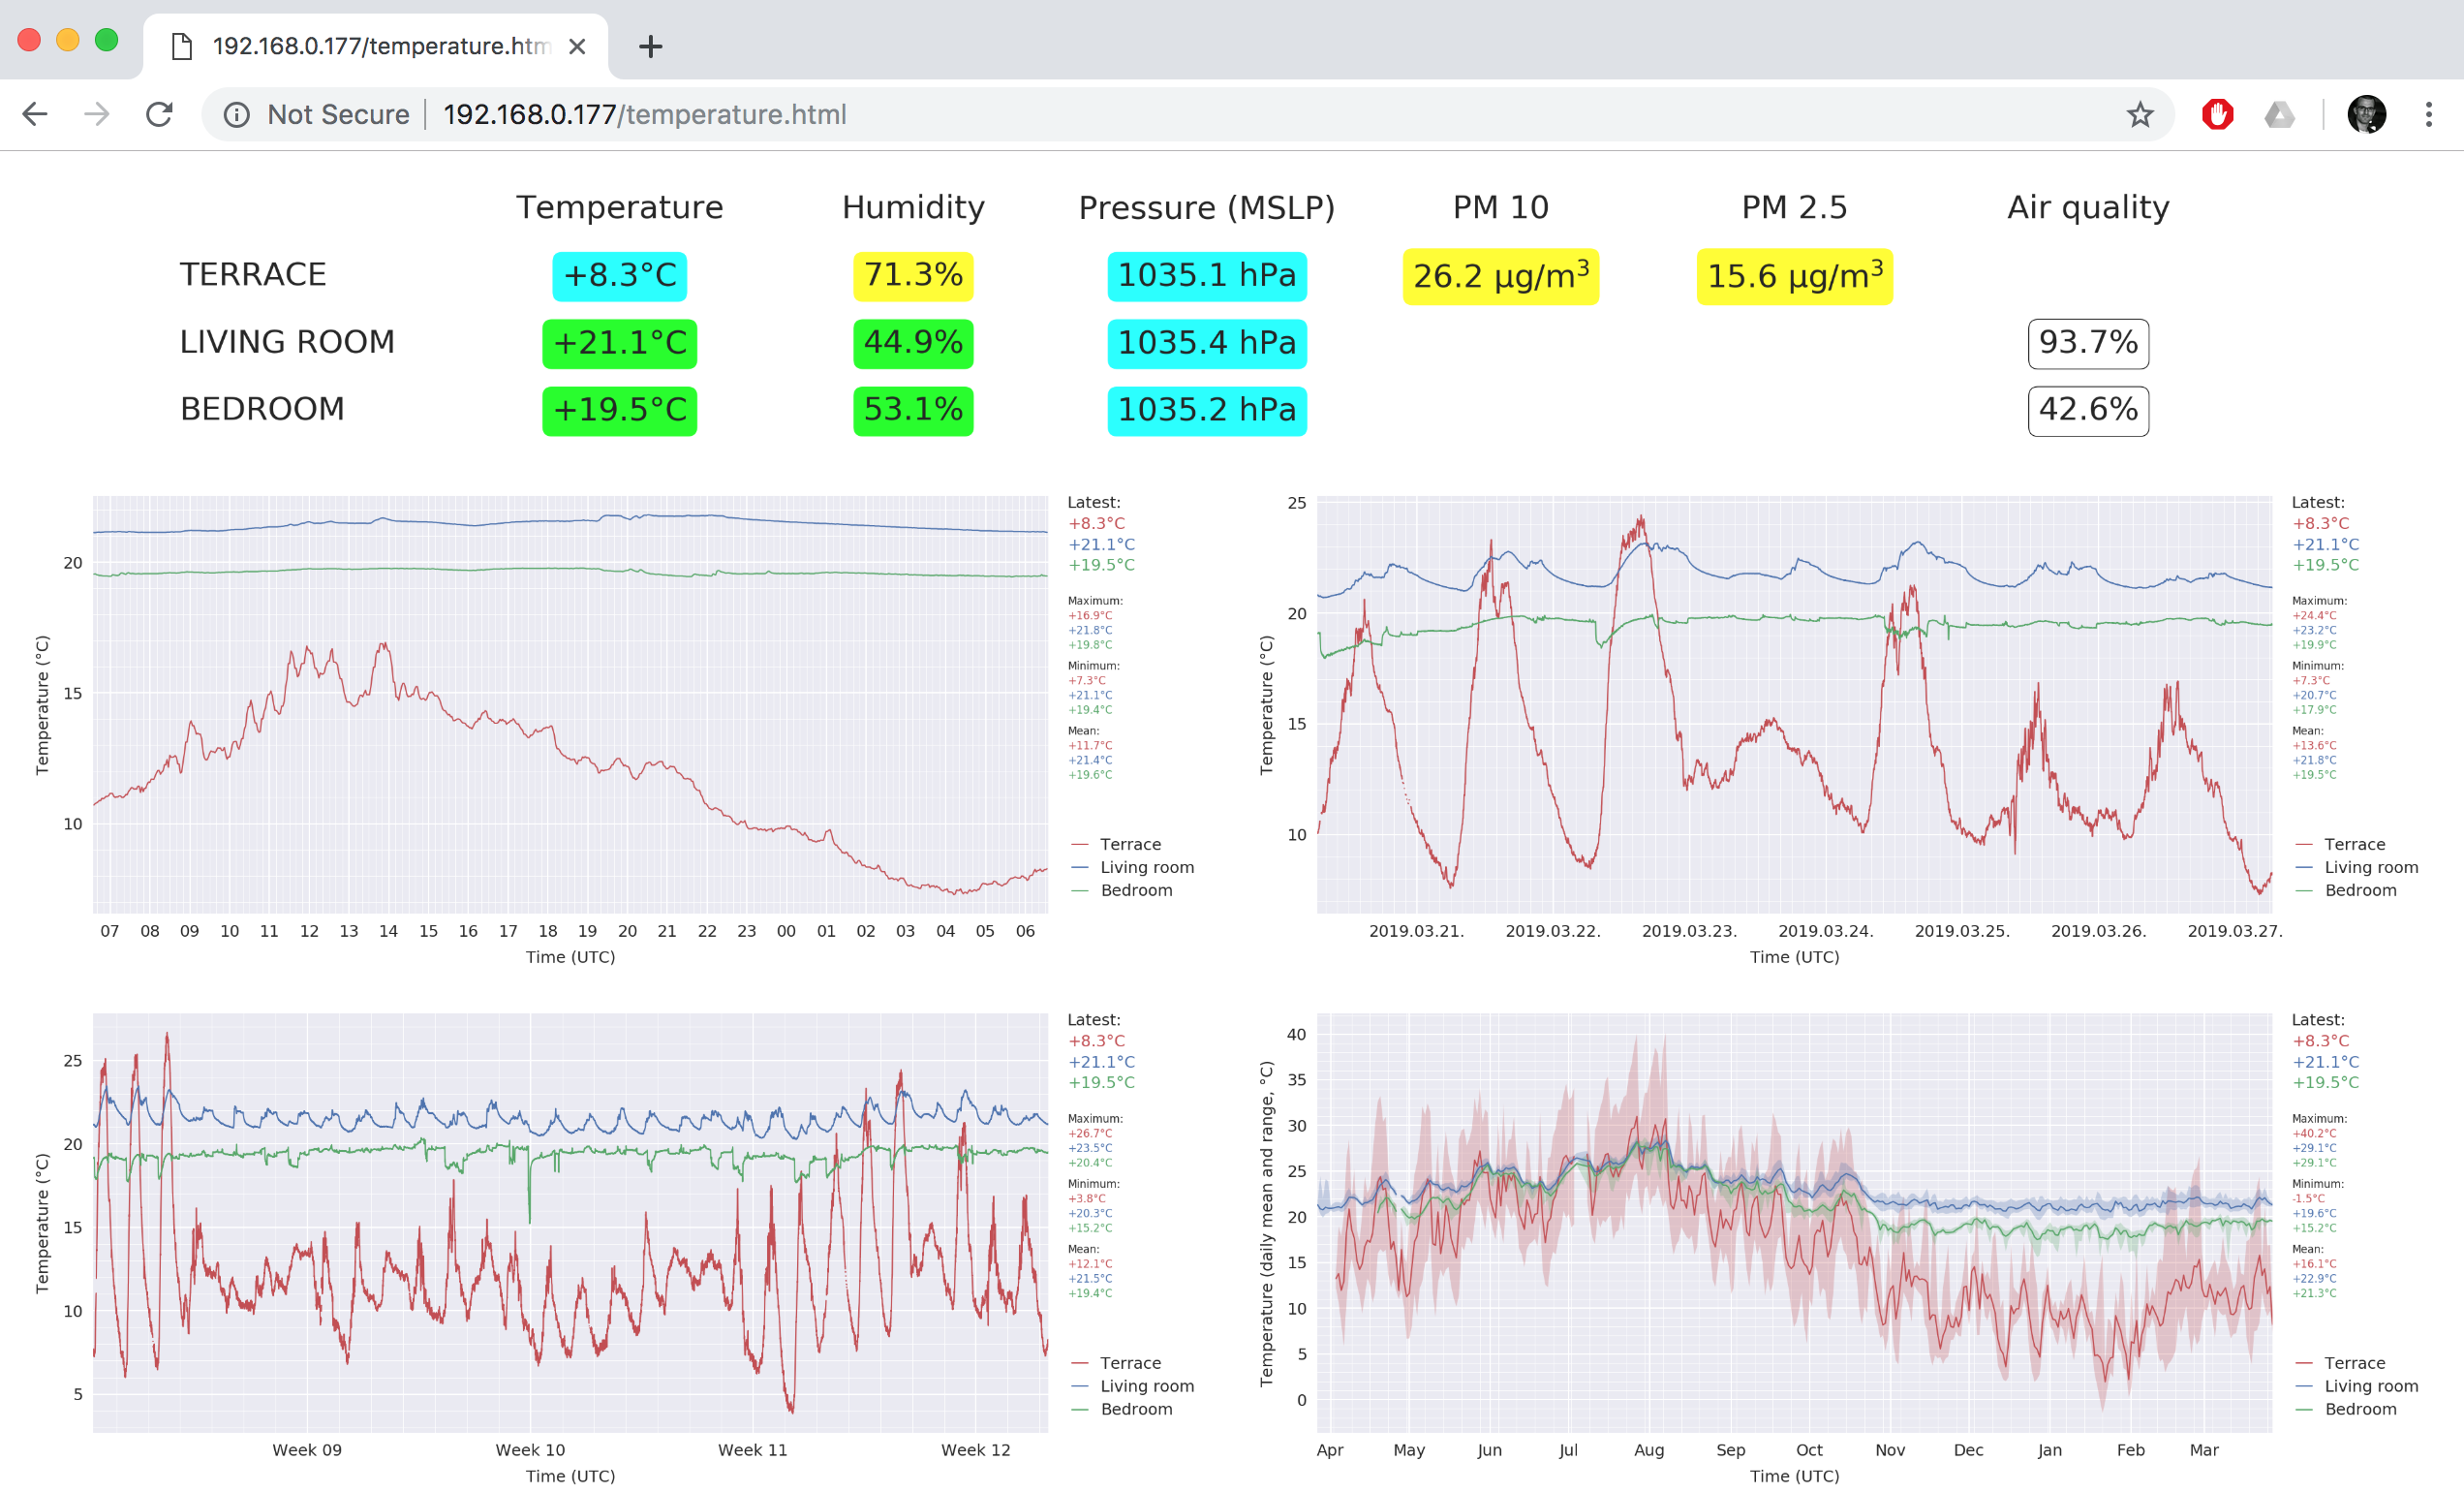
Those who still follow this blog (I am very proud of you, also, hi Mom and Dad!) might remember that a year ago I put together a small home-monitoring system. A few days ago it passed one year of recorded data on the longest active components (the fine dust concentration sensor and the indoor temperature and humidity sensor). Therefore I thought it might be interesting to give a small update on the status of the system, and how it performed on the long term. First of all, just for the show, here is the look of the monitoring dashboard after clicking on one of the temperature plots (by default the daily plots are shown for temperature, humidity, pressure, and fine dust concentration).
It is very satisfying that the ever-shringking gap in the beginning of the yearly plot is finally gone! So what are the main changes I made during the past 12 months? First of all, the “Wireless indoor sensor 1” in the living room got upgraded to the same model as the “Wireless indoor sensor 2” was in the bedroom, meaning that I replaced the DHT22 sensor in the living room with a BME680 sensor. Since then (12 September 2018) I have pressure and air quality measurements from the living room too, and most importantly, the temperature measurement is reported with a 0.01°C resolution (instead of the 0.1°C before). This actually makes a big difference in nicely recording the smooth cooling and warming cycle during the day.
On the plotting front I switched from displaying the raw data in the yearly plots to only plotting the daily averages and the minimum/maximum ranges, because the raw data was just too busy to look at. (Note below how the more-or-less stable indoor temperature of the heating-season differs from the warm summer months where outdoor temperature influences the indoor temperatures very strongly. Also, during the heating season there is a constant temperature difference between the living room and the bedroom – where we never turn the heating on and open the windows often even during winter -, while this difference disappears during the hottest months as the walls of the building get warm.)
Most of the time the system works perfectly fine with zero down-time. As you can see above, there was only one week in July when the system was down, as the result of a power outage just after we left on holidays. I think there was a conflict with the IP addresses distributed by the wireless router after the power came back online, so even though both the wireless sensors and the Raspberry Pi rebooted just fine, the RPi did not get its preferred IP address (something else got it instead – unluckily this can happen when you have a ton of wireless devices and a router from an internet provider that does not allow fix IPs). Therefore the wireless sensors could not connect to the RPi and that kind of screwed everything up, because the script running on the RPi can not handle not receiving any data from those (I know, bad programming). It still happens once in a few months that the wireless network needs a reboot, but most of the time the whole system just works, so overall I am satisfied with it.
Maybe the only real annoyance is that the data from the outdoor sensors is actually read from the server of https://luftdaten.info and not received directly via MQTT like it is done with the two indoor wireless sensors. This is because the outdoor sensor setup is not my own creation but part of a citizen science project with its own firmware that does not support the MQTT protocol, so setting up any kind of direct access would be way too complicated (for me, and for the amount of time I am willing to invest in this). As a result there are – although quite infrequently – periods when getting data from the server is difficult because the API becomes very slow (because of heavy load on the server), and that can result in missing some data points…

