As mentioned in the previous post, I got involved in the citizen science project called LeuvenAir a few months ago. This started out as simply setting up a low-cost fine-dust sensor on our terrace (following the description that can be found here) and connecting it to the LeuvenAir database. This was the first time in my life that I was connecting pieces of hardware together with jumper wires, and I found it interesting enough to want to do a bit more…
First I wanted to simply display (and log) the recorded values locally on a small screen, so I bought a Raspberry Pi 3+ (RPi) and a Sense HAT, and combining these I made a data logger that also displayed (scrolled) the recorded air pollution and weather measurements using the small led-matrix of the Sense HAT (colour-coded according to specific pollution/comfort levels). The RPi was running 24/7, while the display could be turned on and off by putting the RPi in an upright or horizontal position (using the accelerometer sensor of the Sense HAT). At this point life was easy, I got the fine dust data along with the outside temperature and humidity values from the LeuvenAir sensor (via the API of the original German project, luftdaten.info – which gave the idea to LeuvenAir -, as all LeuvenAir sensors are also sending data there), and the barometric pressure from the Sense HAT. All of this was handled by a small script that I wrote in Python.
Then I decided that I wanted better sensors outside, and that I wanted to measure inside too, preferably both in the living room and the bedroom. Of course these new units had to be wireless, and preferably everything had to work even after a power cut more-or-less automatically. Oh, and I wanted to push the data to an Internet of Things (IoT) platform and also make an only locally reachable website that displays live data and graphs for everything – a bit like the weather status page of the Mercator Telescope… This is where things became slightly more complex. Below I am going to give a description of the system as it is now, without discussing the timeline because a) you are not interested in that, b) I don’t remember all the details anymore…
Central computer
- Hardware: Raspberry Pi 3+ [with Sense HAT]
- Role: Data logger, data plotter, Apache web server, MQTT “server”, dot-matrix display
- Measurements: Processor temperature, barometric pressure
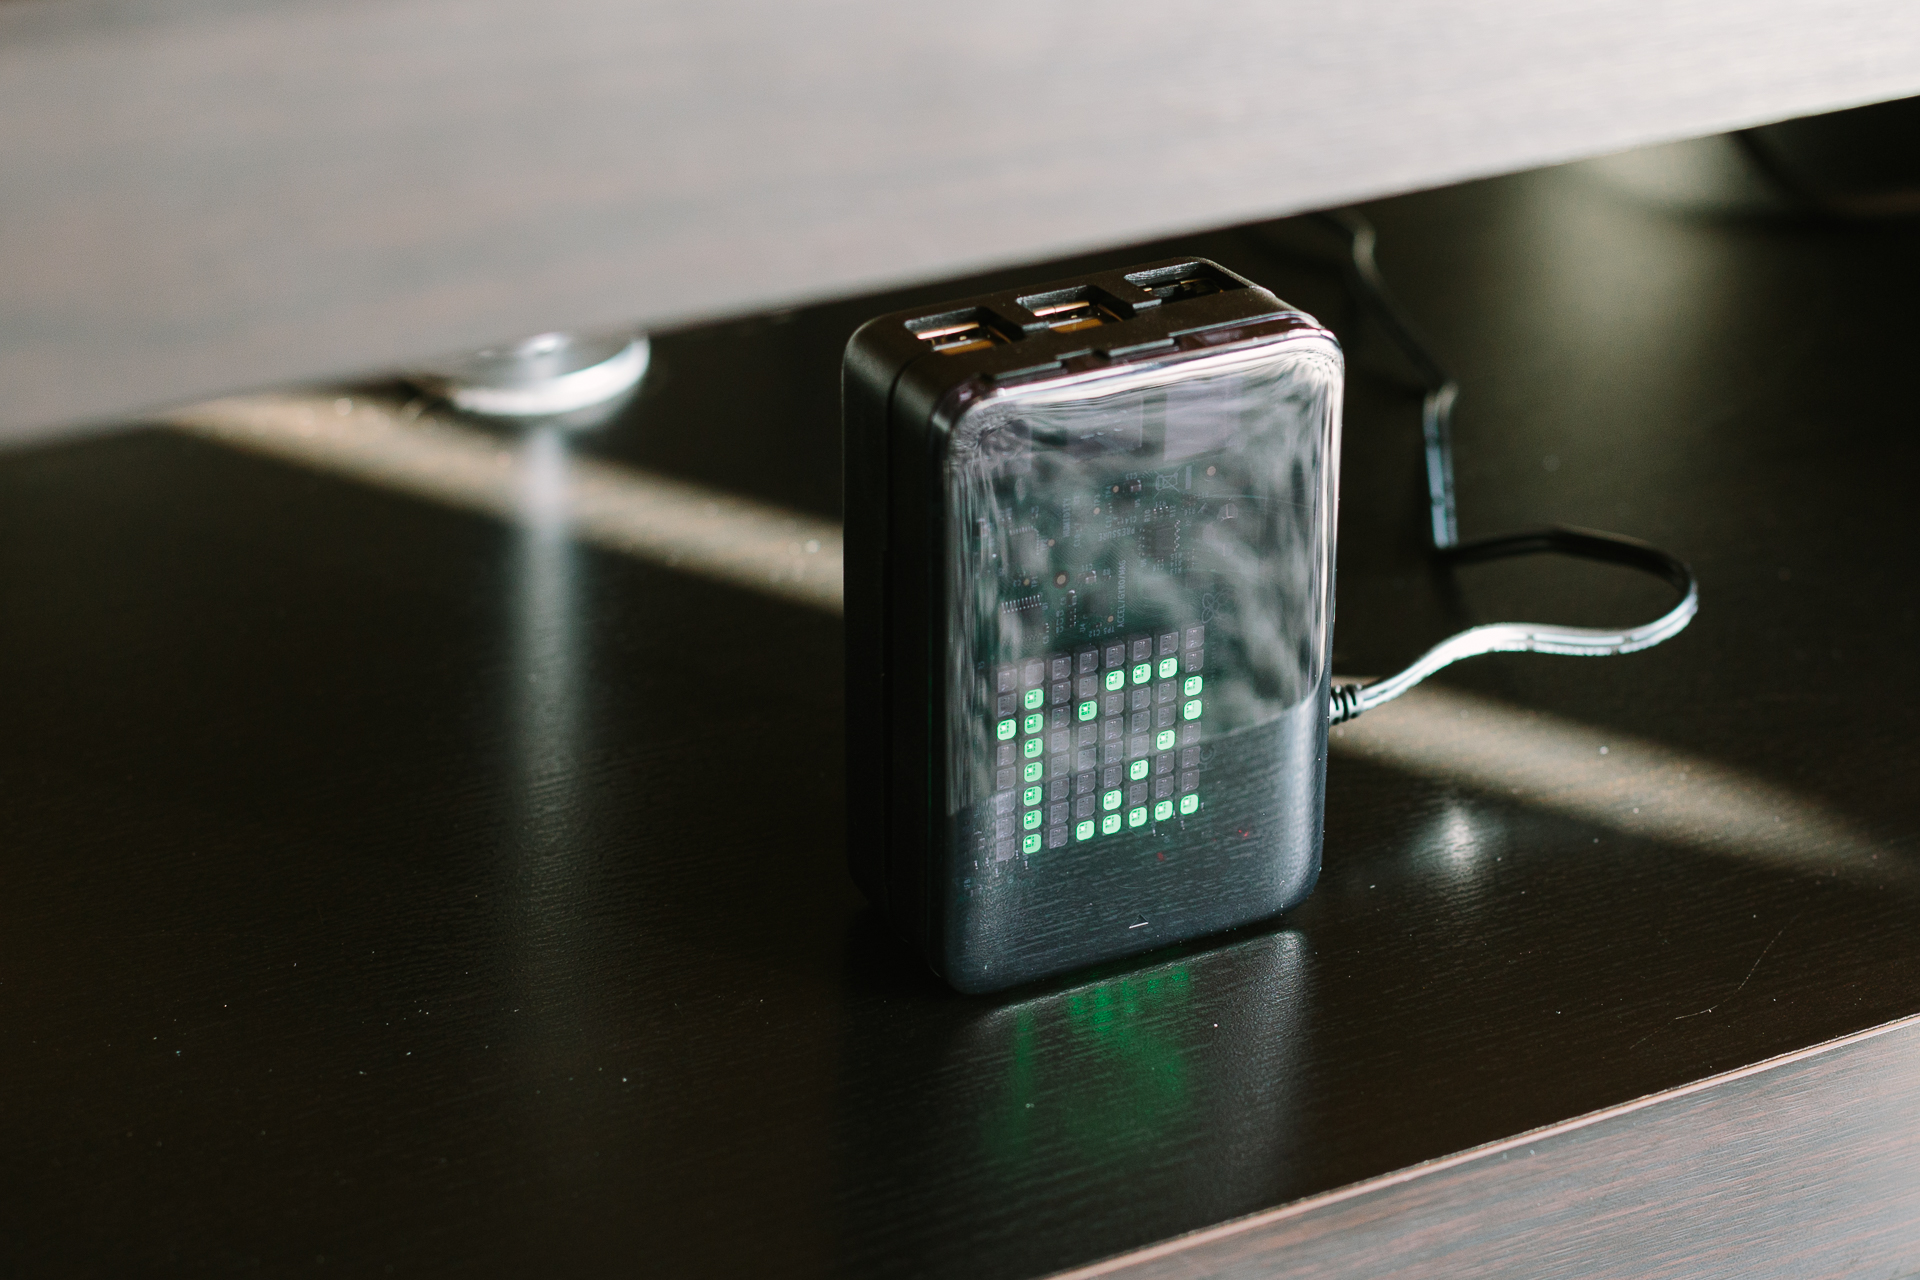
- Description: The Raspberry Pi is an extremely small (bit bigger than a card deck) computer that is running a Linux-based operating system. This is the main hub of my sensor-network. It is placed in a black Short Crust Plus case under the TV. On it there are two python scripts running continuously: 1) monitor_home.py taking care of the data logging (saving all measurements – read in from an internet API or received through the MQTT protocol – to daily .csv files once every ~2 minutes), feeding the current values to the matrix display of the Sense HAT (if it is in the on-orientation position), and publishing these to an only privately accessible IoT platform called Cloud4RPi so I can easily check the status of all sensors from anywhere. It does not use more than 1-2% of processor power, and most of the time it is simply idle – waiting for time to pass between two measurements. 2) grapher.py is responsible for an around-the-clock generation of plots that are displayed on a website that is placed on the Apache web server on the RPi (these pages automatically reload every minute in a browser). It runs in one minute intervals (using 25% of processor power when not idle) and creates daily, weekly, monthly, and yearly plots of (selected) temperature, humidity, pressure, and fine dust concentration sensor measurements. Besides these plots, it also creates a colour-coded overview table of the latest measurements. These processes are light enough that the RPi does not need any active cooling. The RPi has a preferred IP address, so if no other device on our network gets assigned this IP (after a network/power outage some devices need less time to restart/reconnect and I can not give fix IPs directly from the router of our internet provider, so in theory it can happen that by the time the RPi restarts its preferred IP is already taken), then the RPi has a practically fix IP. For full automation I would need to implement that these two scripts run automatically after reboot, but I can always reach the RPi using a virtual desktop using VNC Connect / VNC Viewer, so it is not such a burning issue right now.
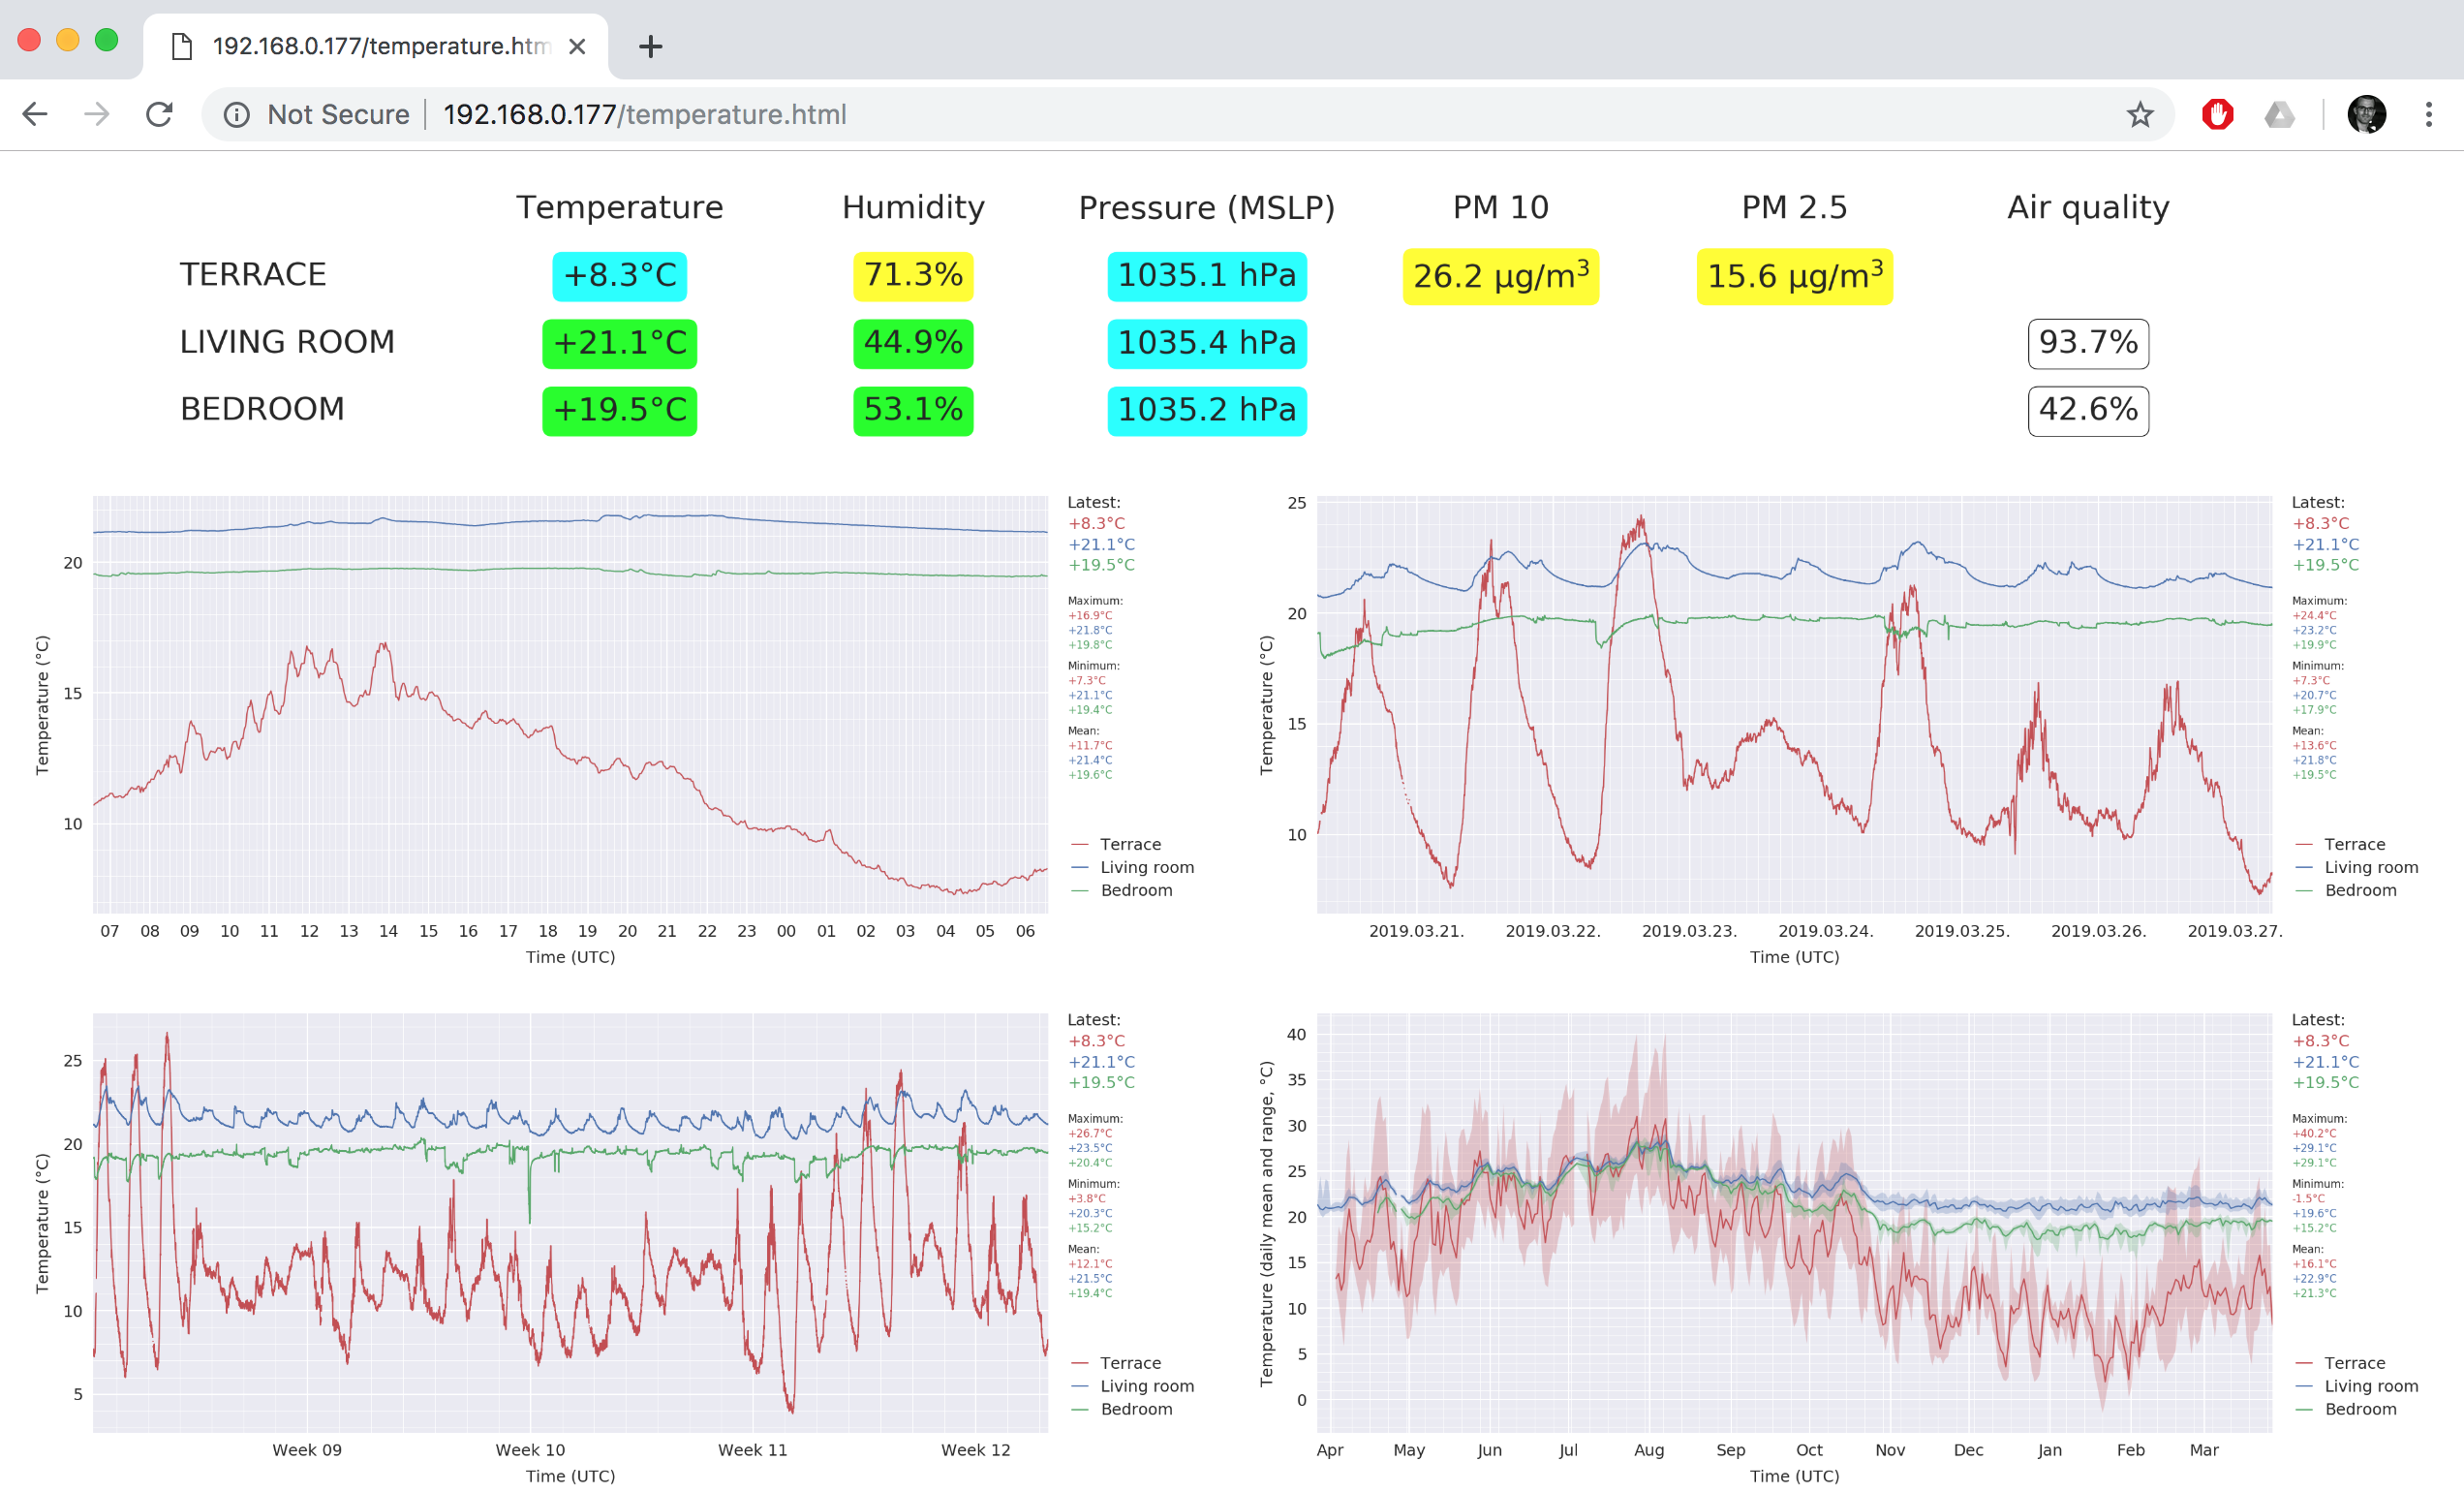
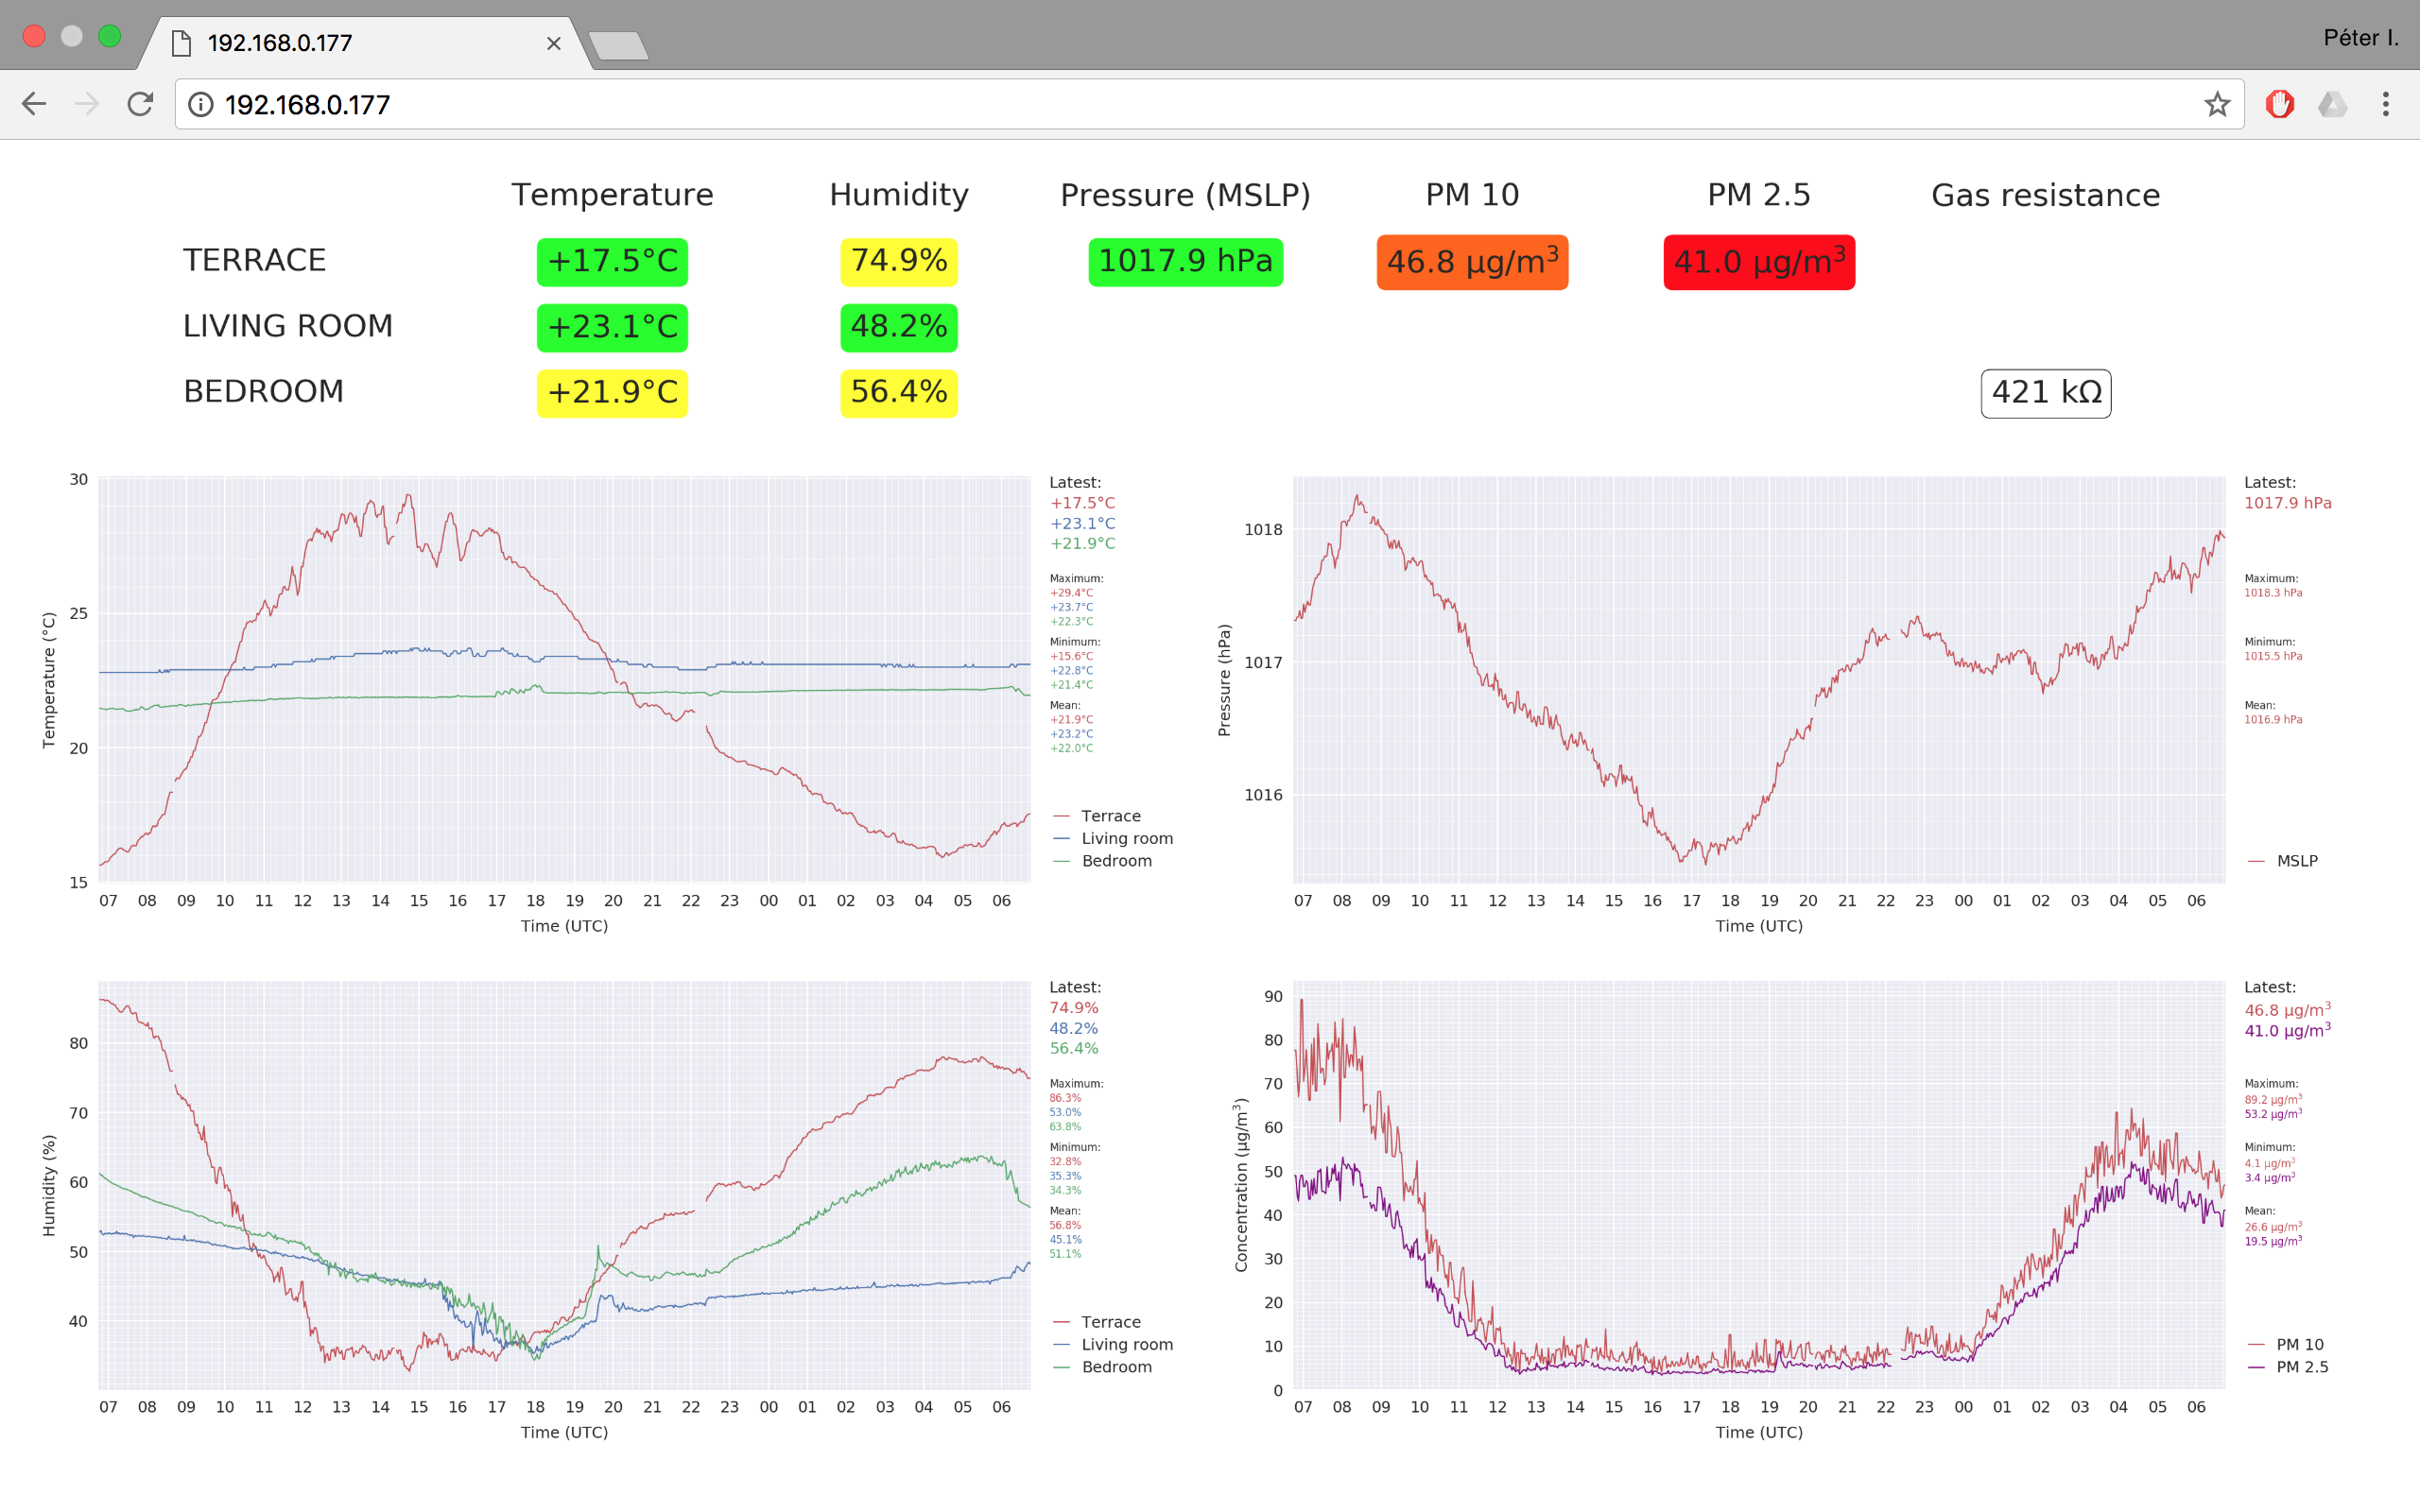
There is a video showing how the very simple colour-coded scrolling display works on my YouTube channel, while here below there is an image of the main local webpage that shows the daily plots, and an image of the page where you land after clicking on the humidity plot (which displays the daily, weekly, monthly, and yearly plots).
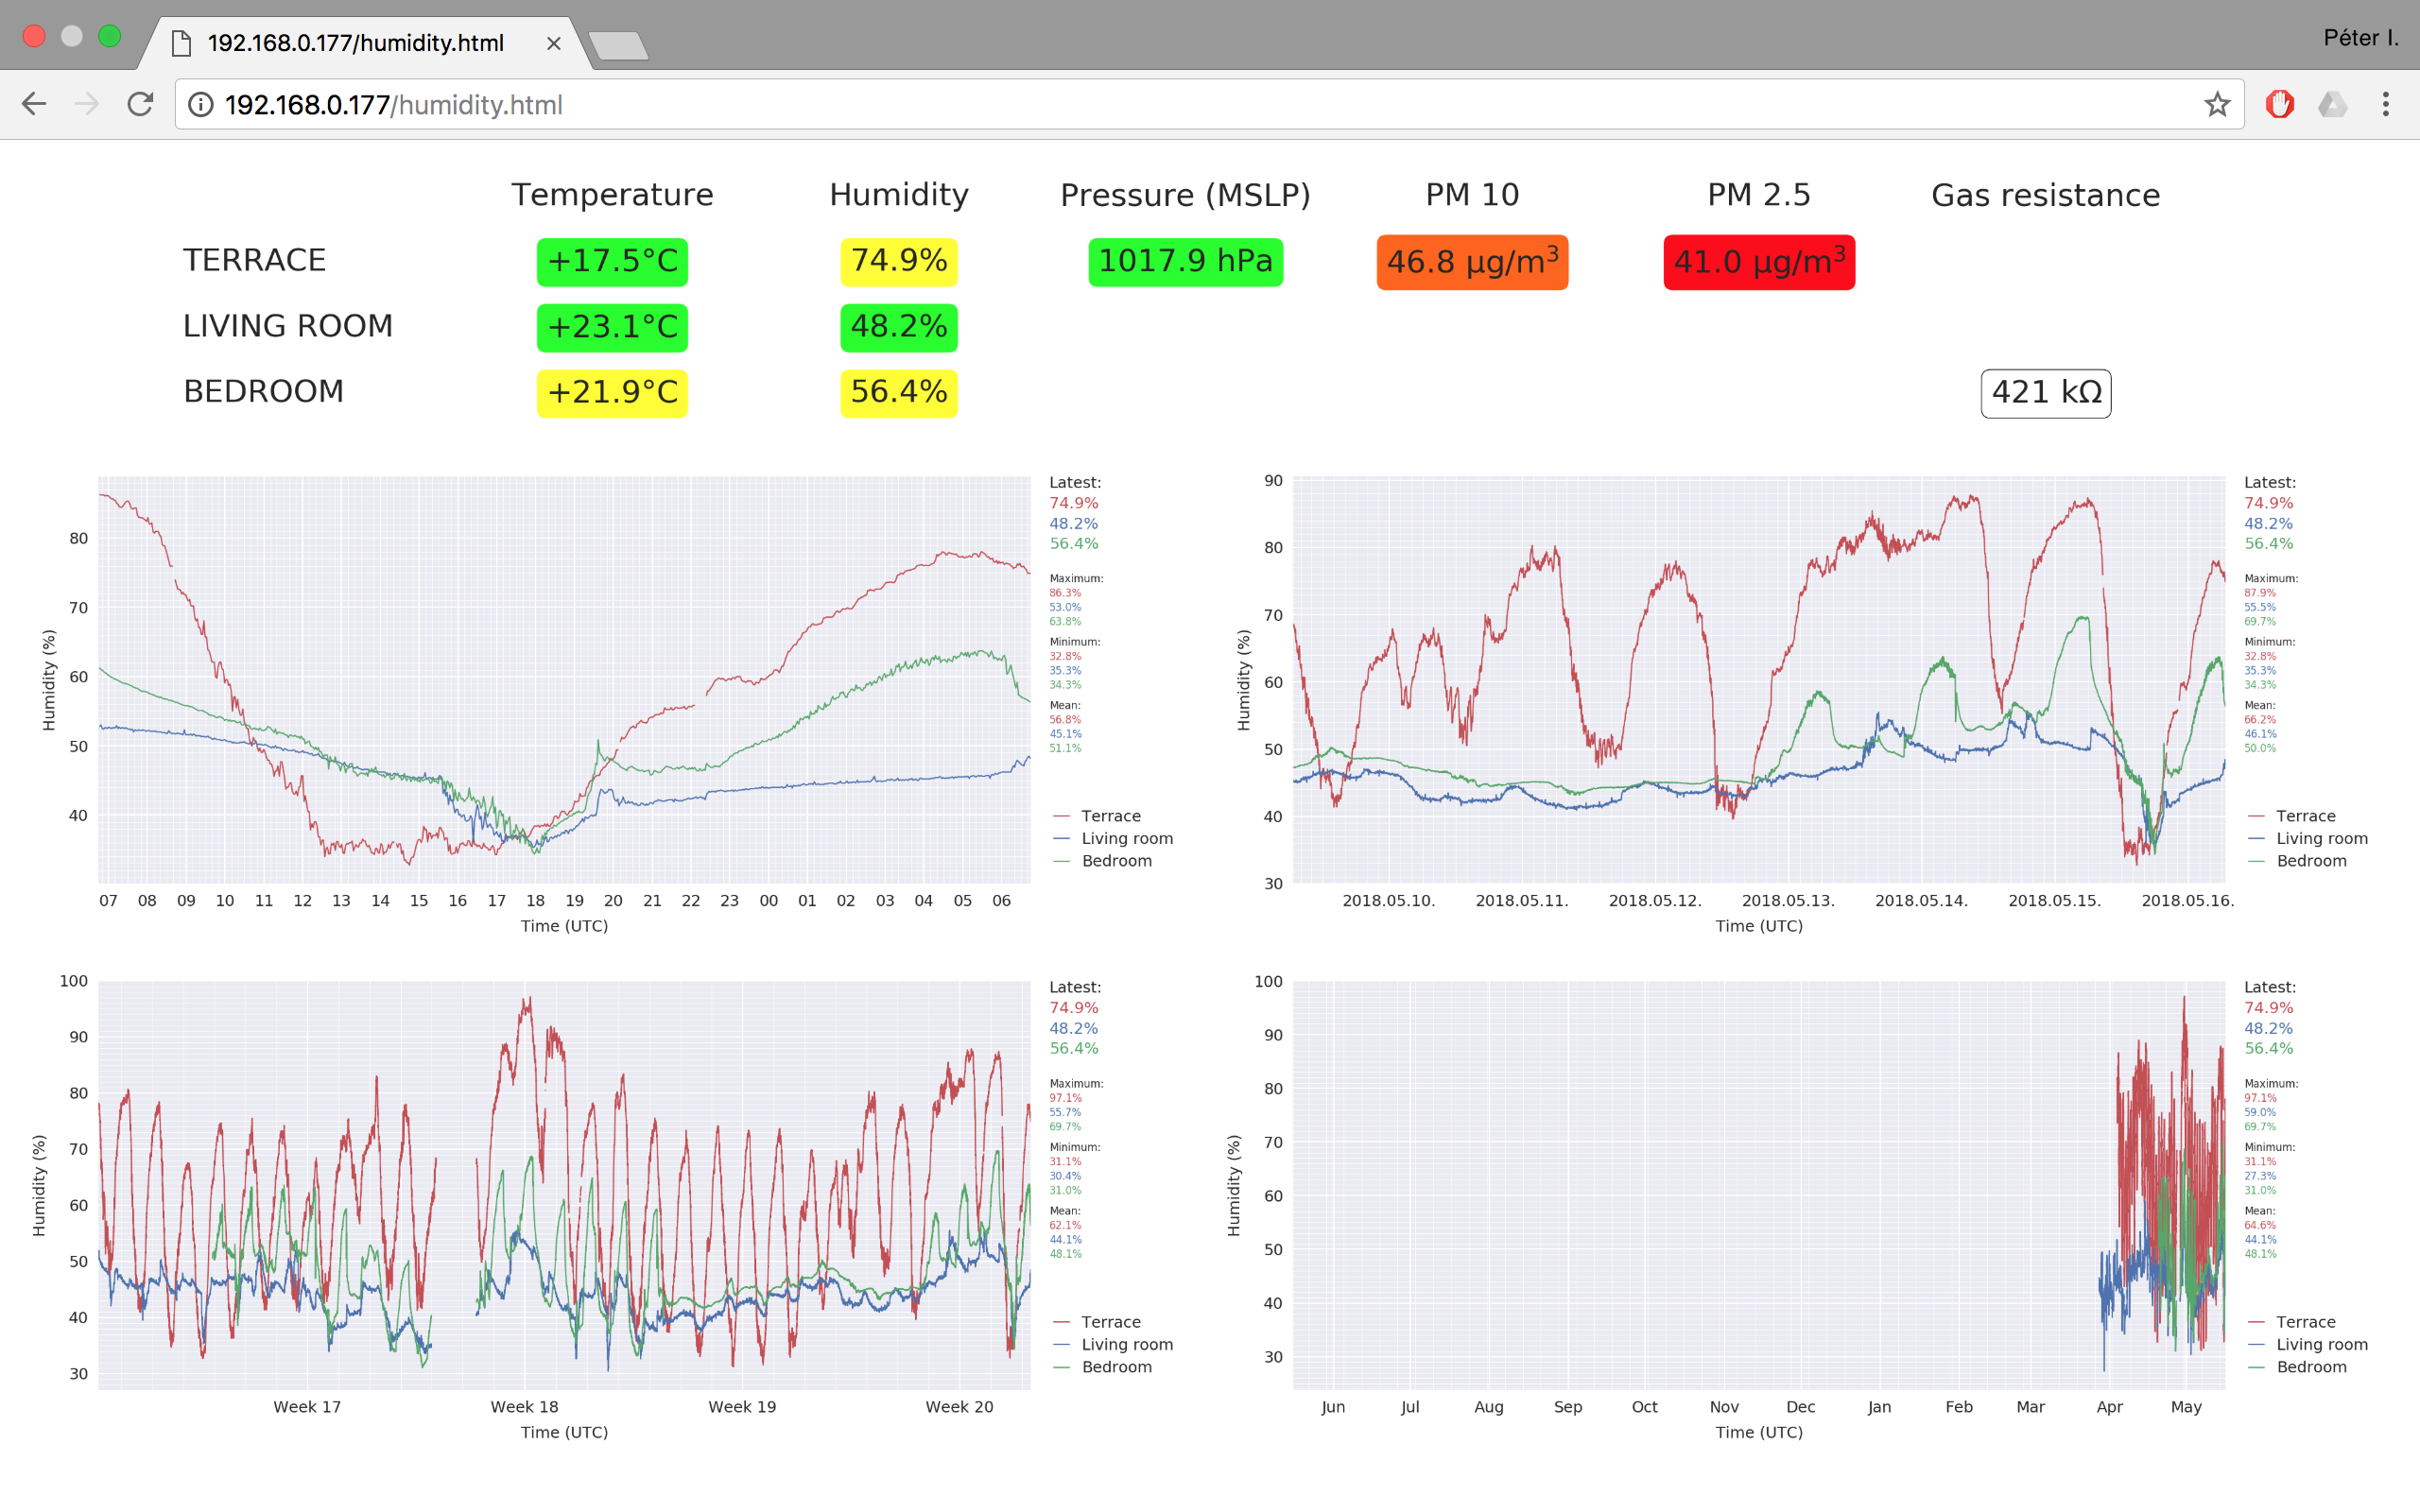
These are more than a month old screen shots, but at that time the fine-dust concentration was high, thus you could see a lot of different colours in the overview table ;) Also these were taken just 4 days after we came home from our holidays in France, so in the weekly plot you can see that while we were away the humidity in the bedroom stayed more-or-less constant throughout the day, then after we came home, it always went up during the night (we sleep with doors and windows closed most of the time, so there is not much air-circulation during the night).
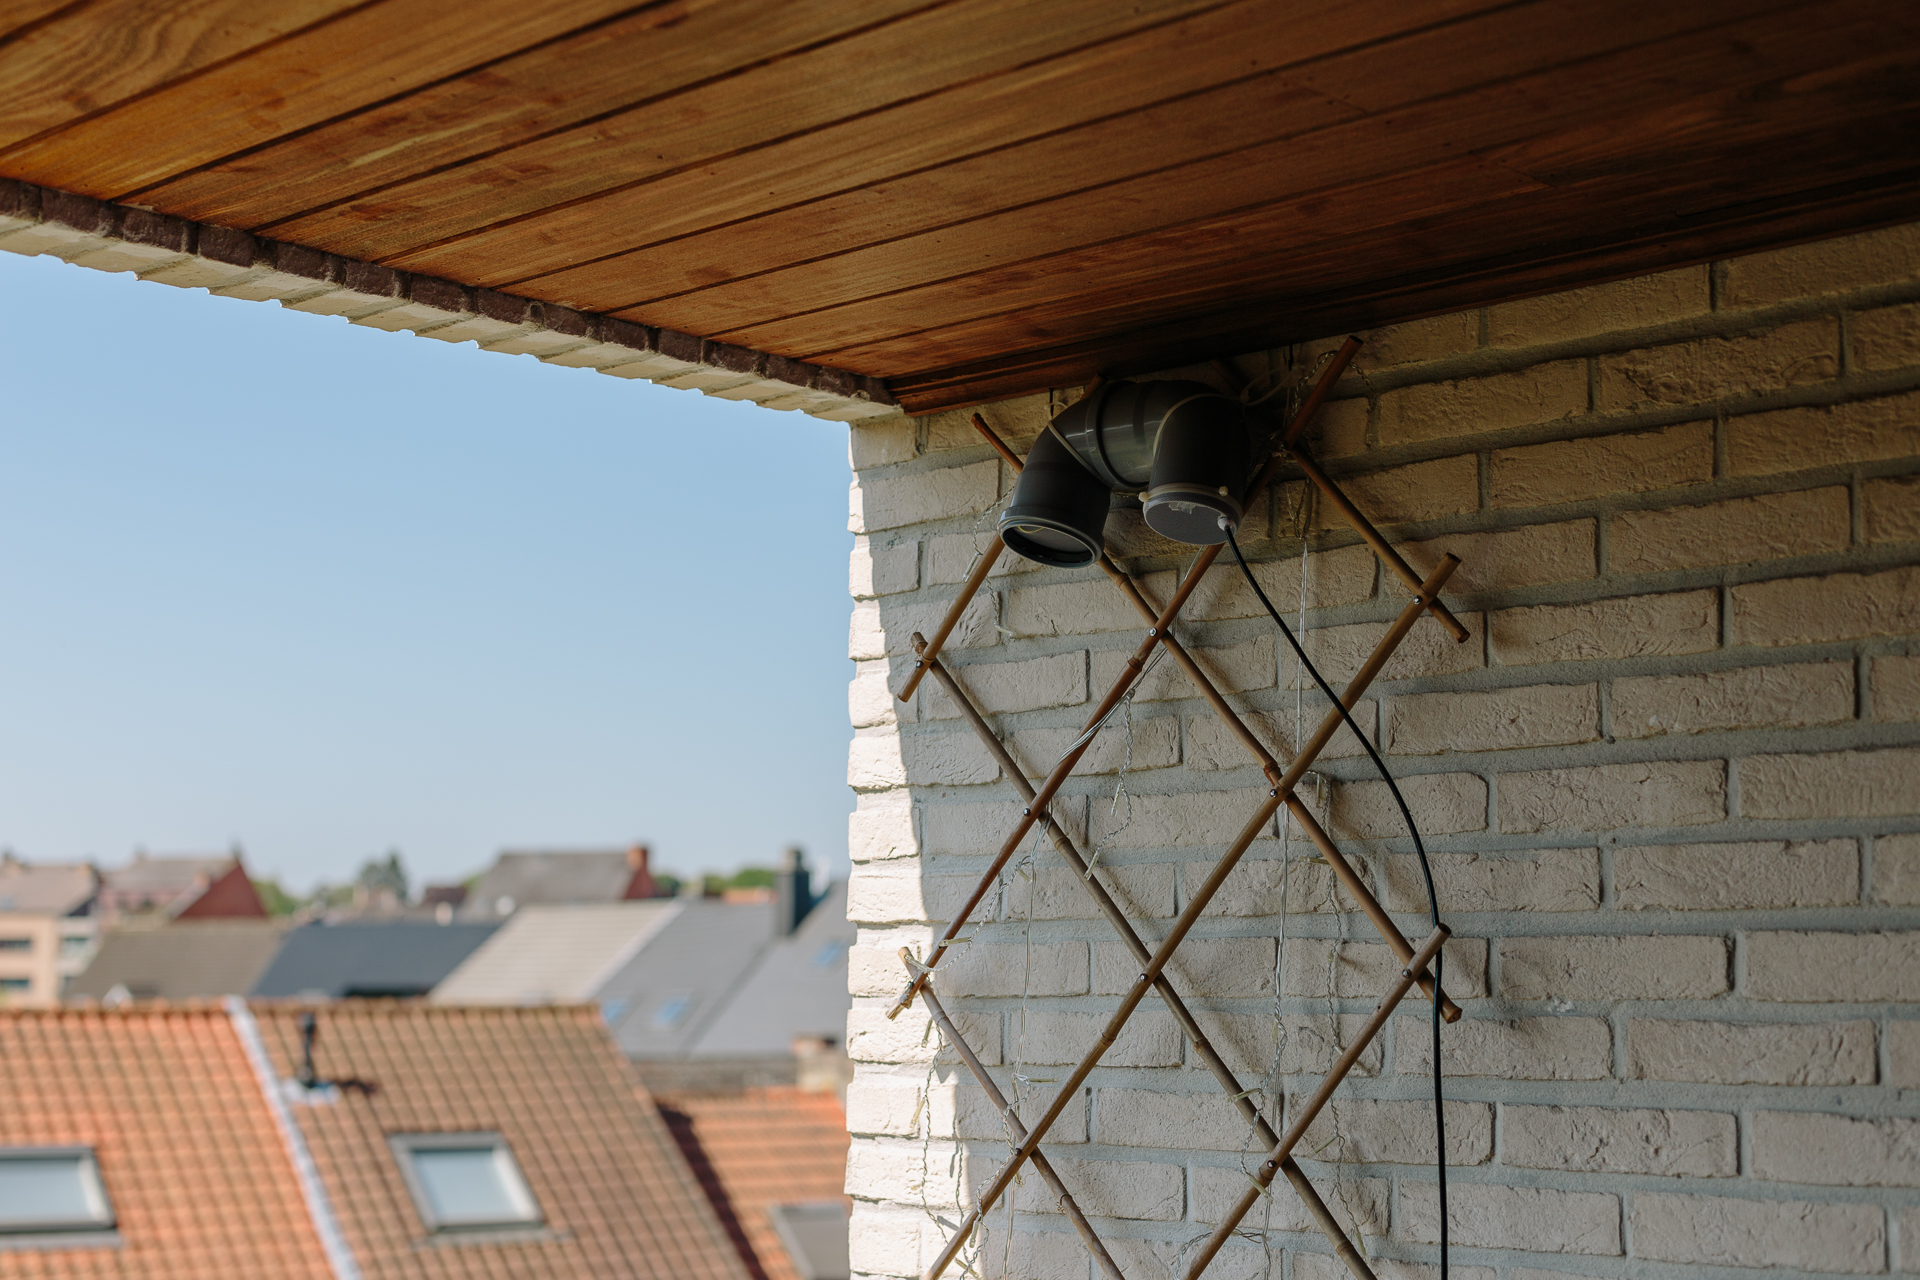
LeuvenAir sensor-cluster on the edge of the terrace
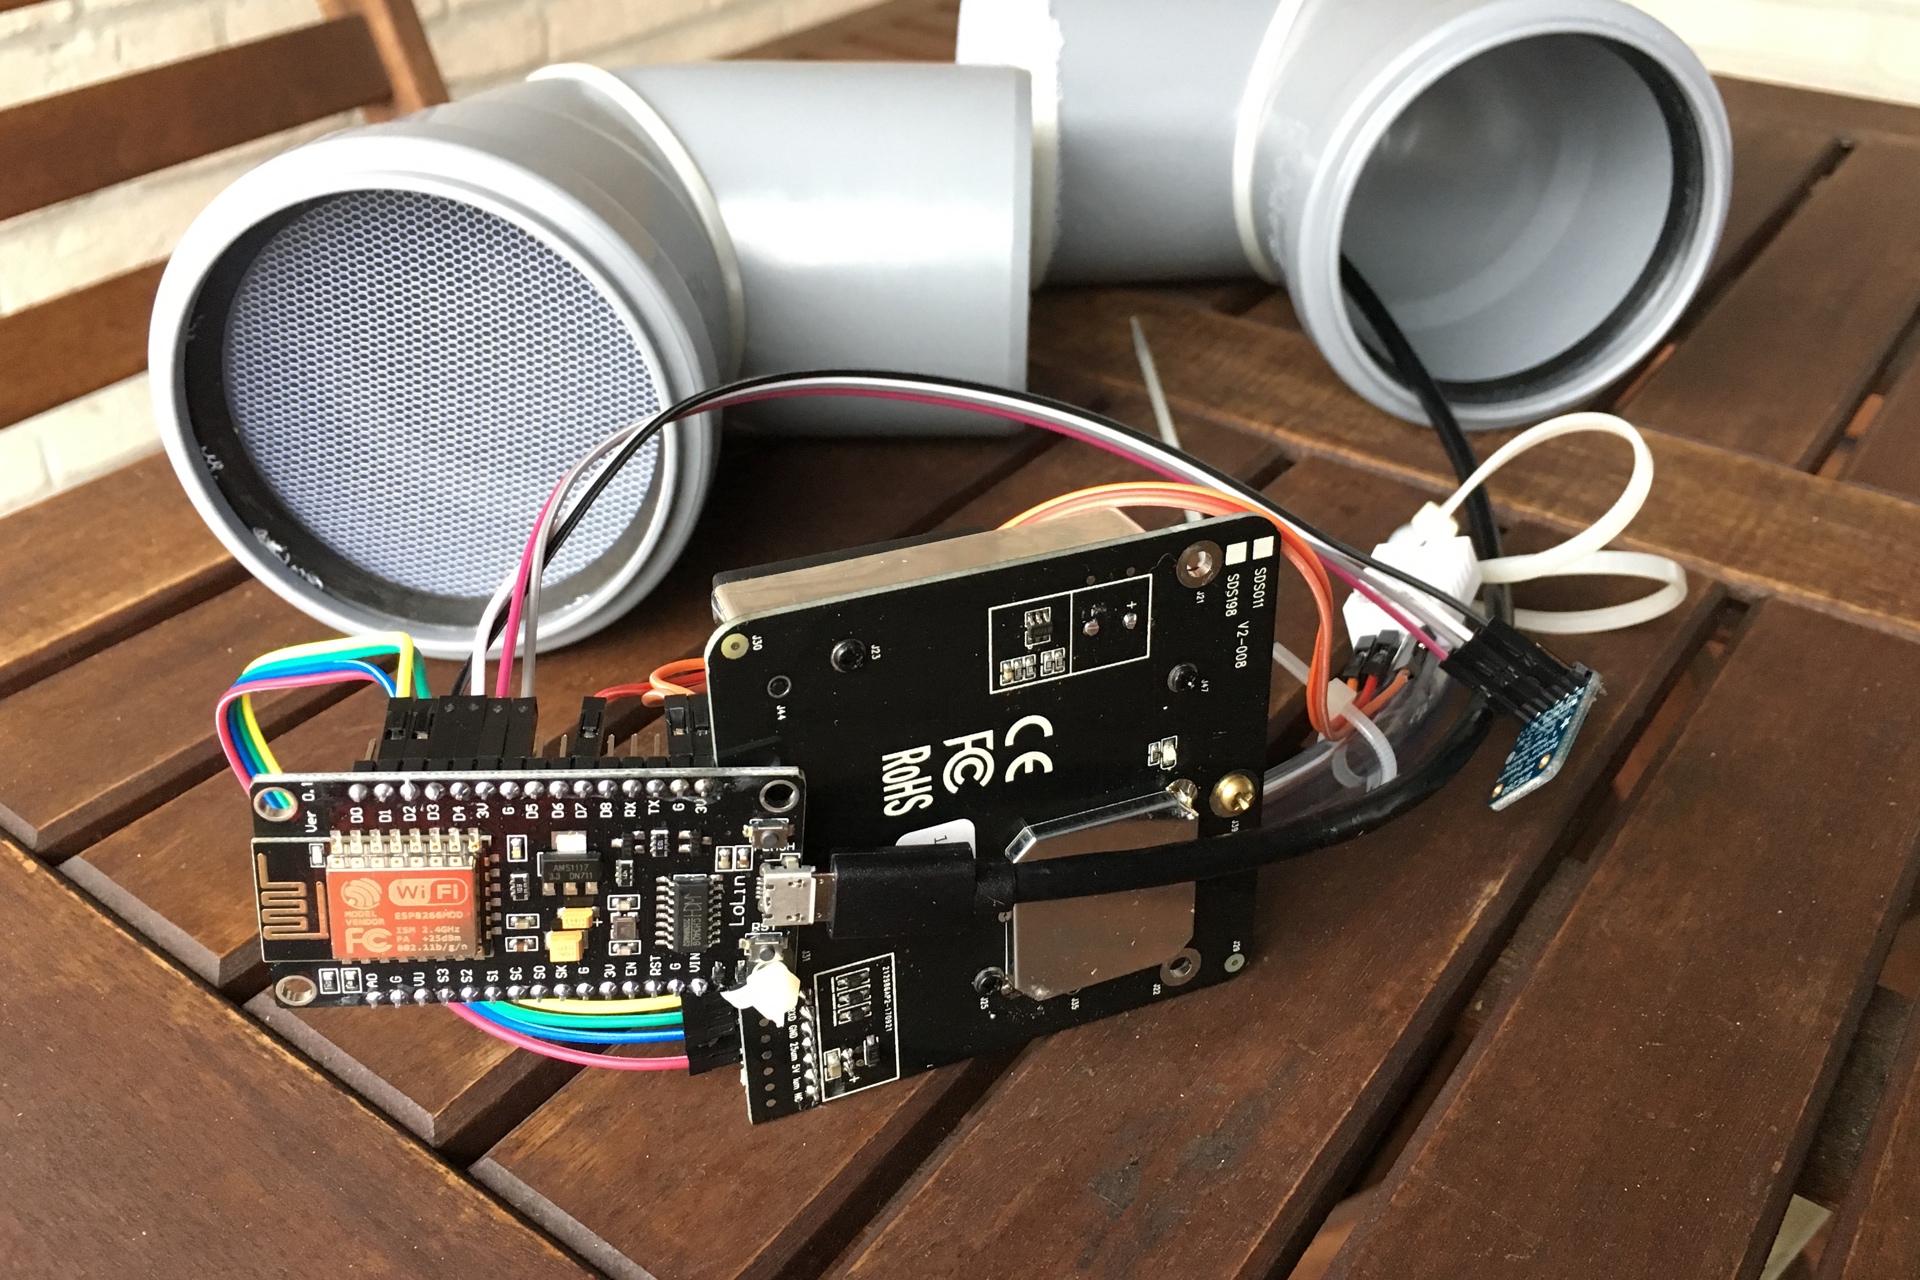
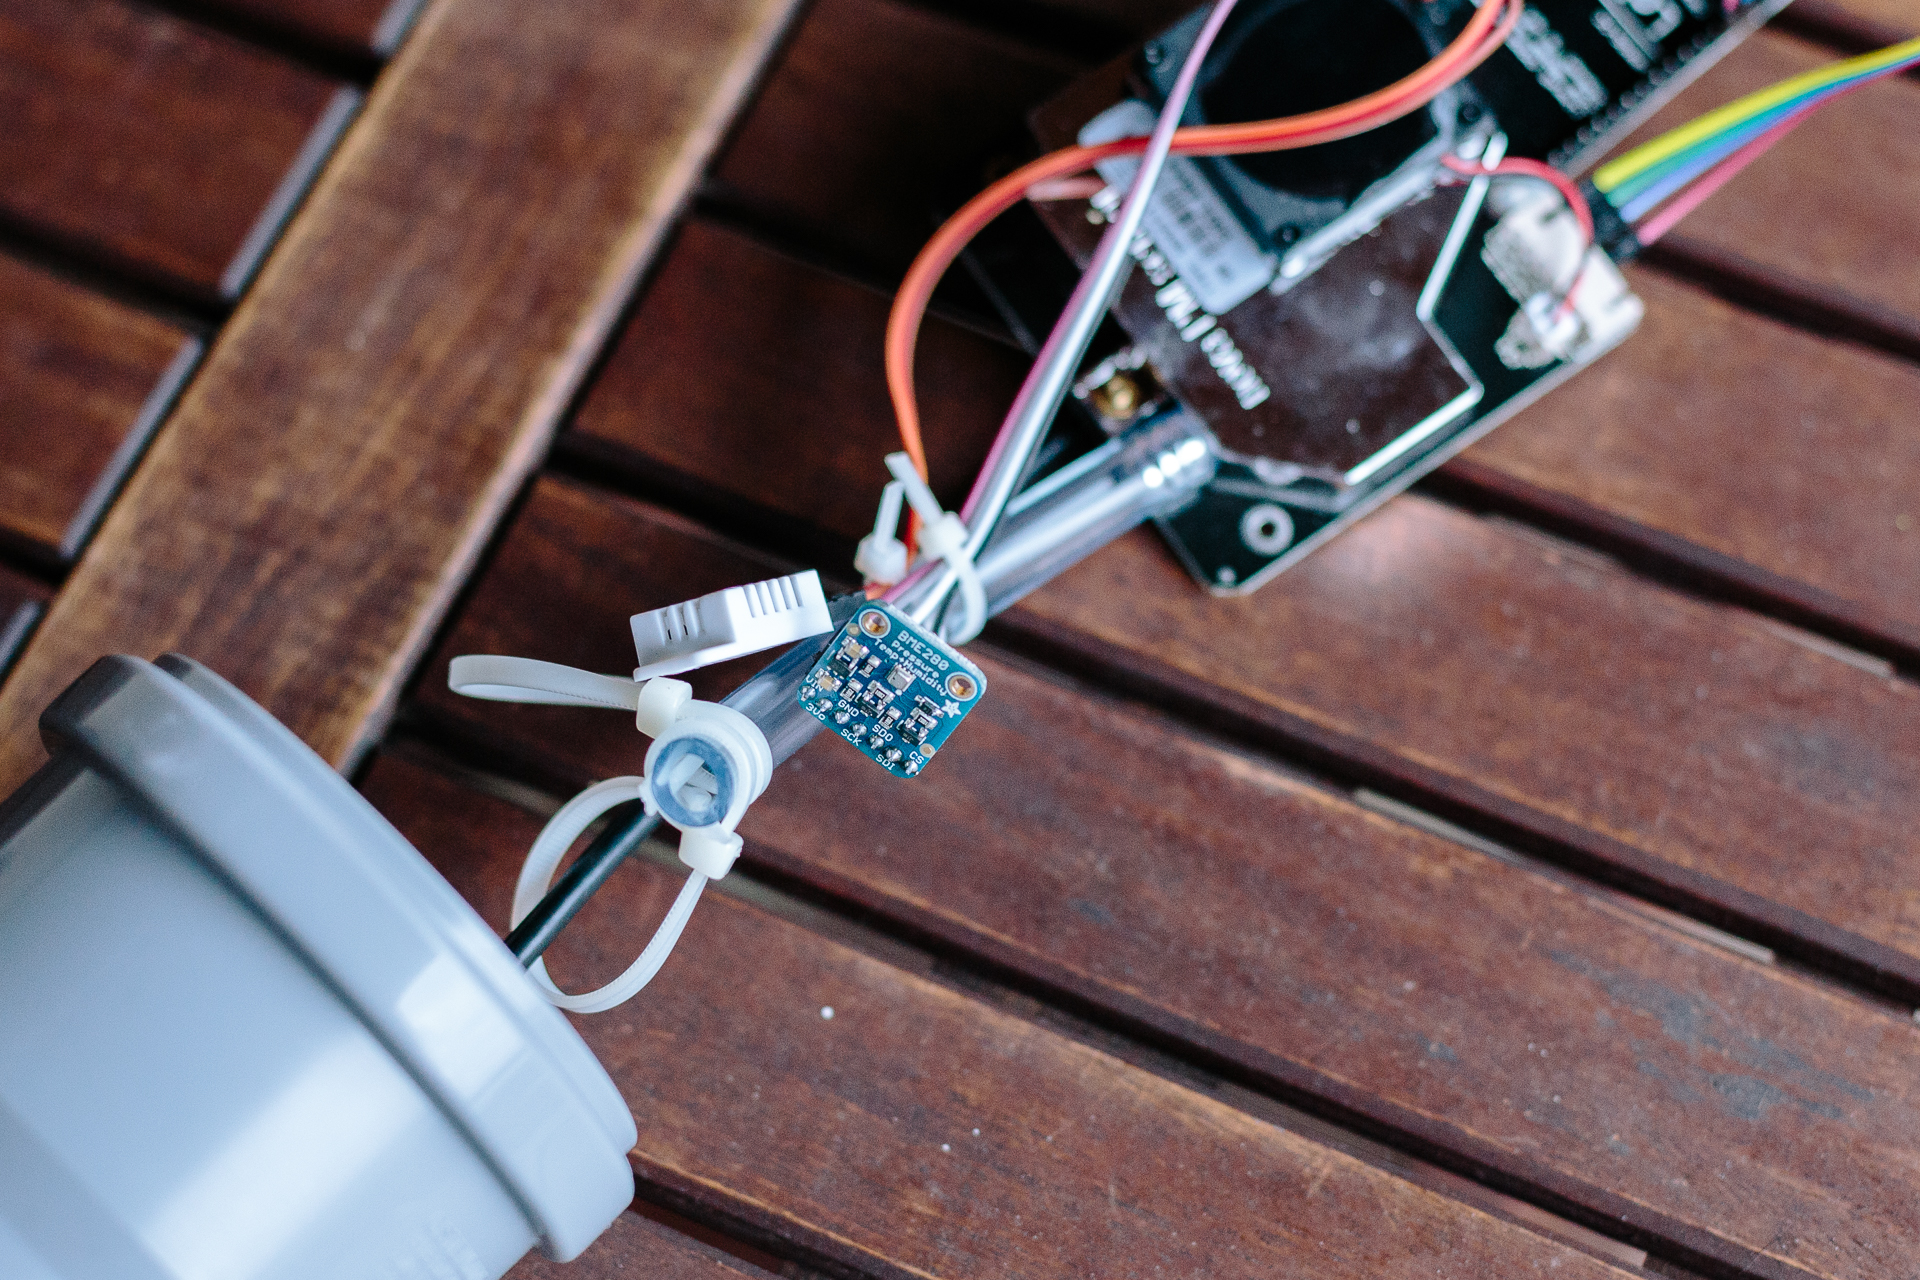
- Hardware: NodeMCU ESP8266 [with SDS011 fine-dust sensor, DHT22 temperature/humidity sensor, BME280 temperature/humidity/pressure sensor, jumper cables, transparent flexible tube, zip ties, USB power supply, plastic tube housing, netting against animals]
- Role: Monitoring outdoor fine-dust concentrations and weather
- Measurements: Temperature, humidity, barometric pressure, PM 10 and PM 2.5 concentrations
- Description: This cluster controlled by the firmware of luftdaten.info does its work without me having to program anything. The three connected sensors are recognised automatically (after an initial setup). Every 2.5 minutes (it is a default setting to extend the lifetime of the fine-dust sensor) it takes a measurement using the connected sensors and uploads these to the database of luftdaten.info and LeuvenAir. I am simply using the API of luftdaten.info to get these values onto the RPi. Normally it is possible to reach the latest values locally too (using an API that runs on the ESP8266 itself), but I found this route to be very unstable, depending on the wireless connection and the processor load of the ESP8266. It would be better if I could send data using the MQTT protocol directly to the RPi, but since I can not change the firmware here (without writing my own), I have to depend on the luftdaten.info servers being online instead… Originally only the DHT22 was connected, I bought the BME280 a bit later to get more accurate values, and to have pressure measurements too. The whole system boots up and starts working without any interaction after a network/power outage.
Wireless indoor sensor 1 in the living room
- Hardware: ESP32 Feather Board [with DHT22 temperature/humidity sensor, USB power supply, jumper cables]
- Role: Indoor weather monitor
- Measurements: Temperature and humidity
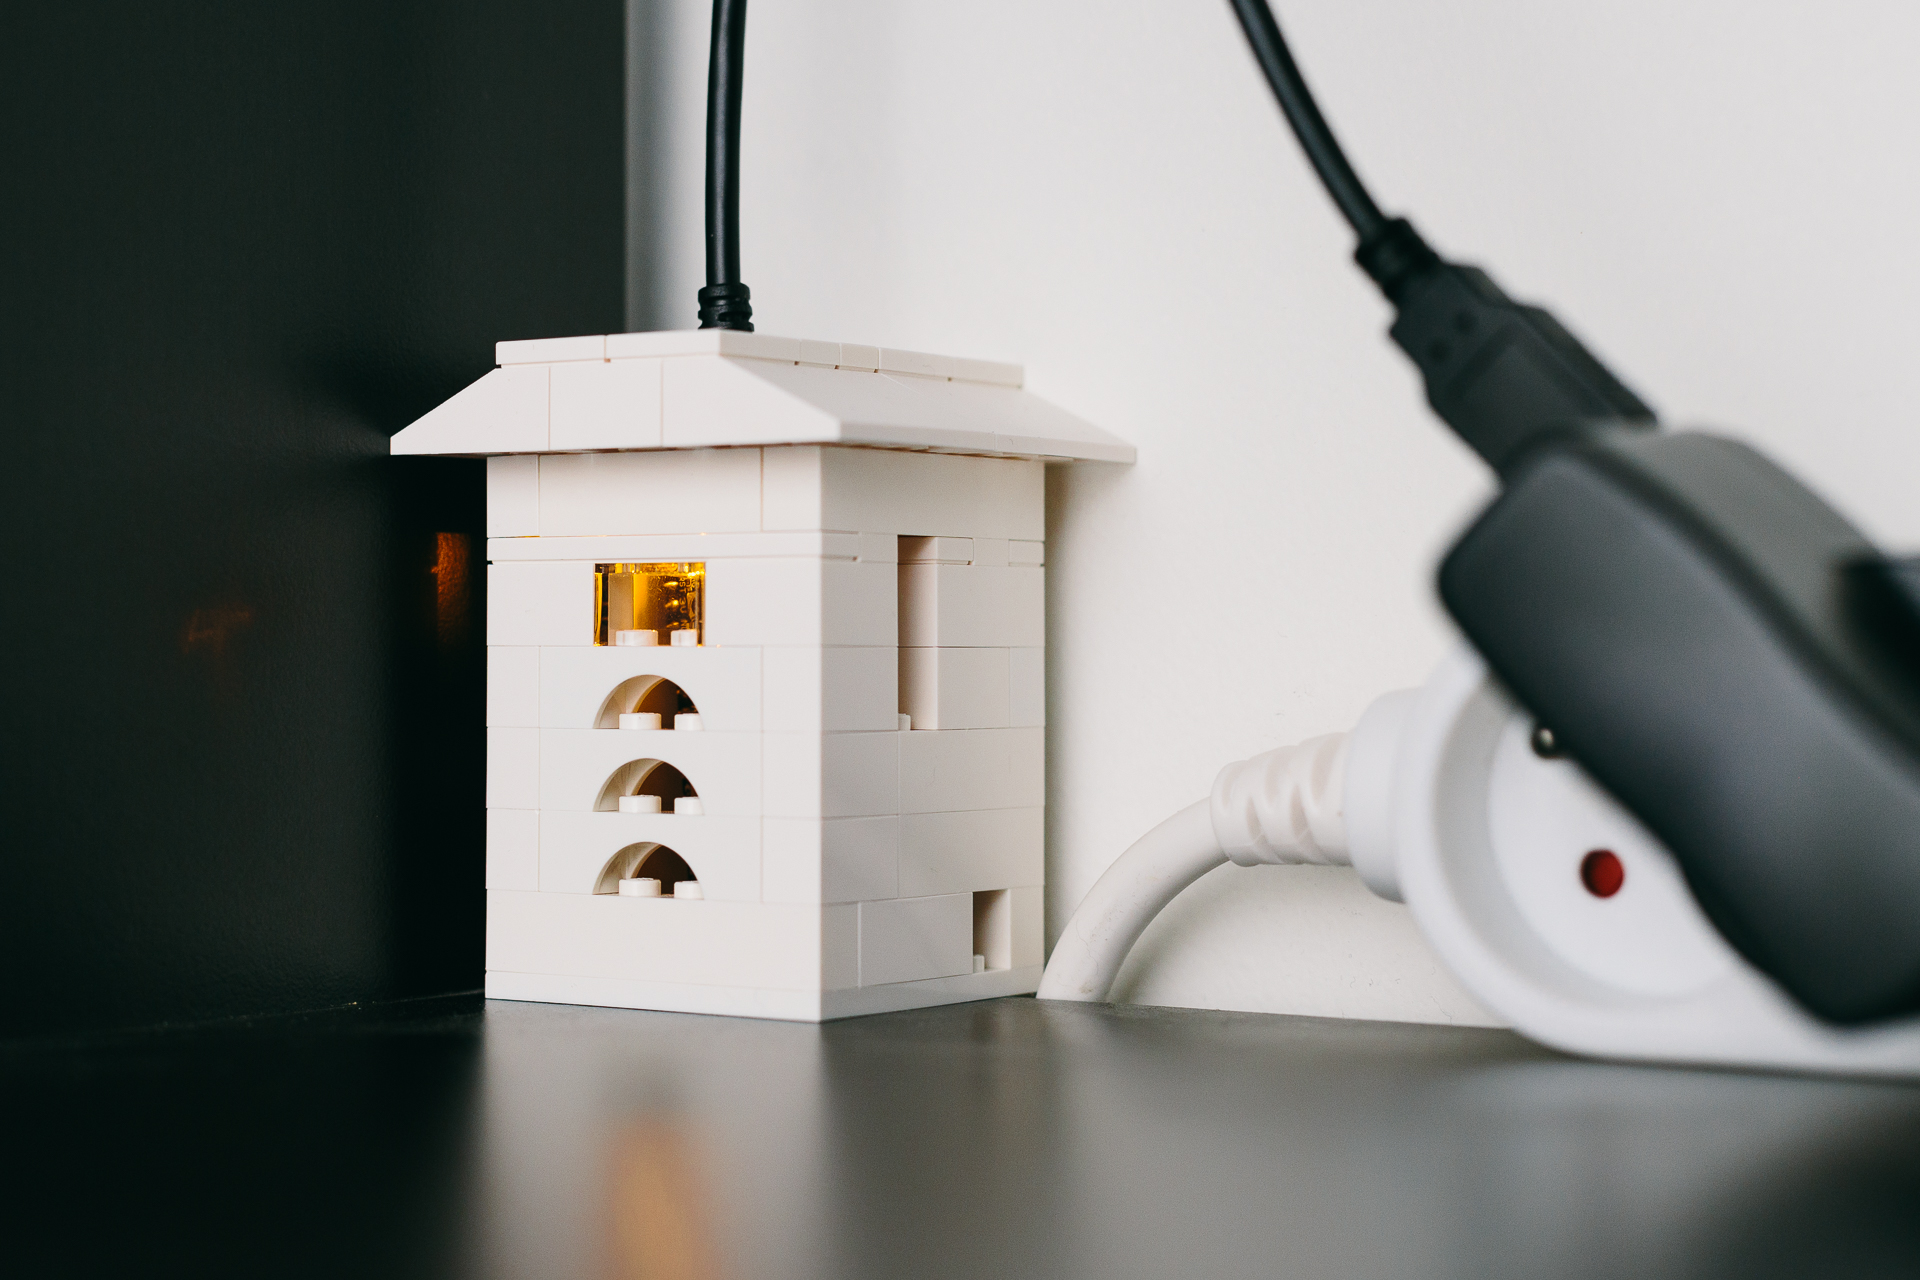
- Description: This was my first bigger extension to the system, also the first time I had to do the whole thing from scratch. I followed the description here, almost everything is exactly as it is written there. The script that is running on the ESP32 board is written in MicroPython (a compact version of Python for microcontrollers), and it simply polls the DHT22 sensor to take a measurement every four seconds and publishes the values to the MQTT broker (the RPi). I have written the code in a way that after a network/power outage everything reconnects and starts running again automatically. (In practice this does not always work, maybe because after a power outage it takes much longer for the RPi to restart, therefore there is no MQTT broker yet to connect to when this sensor restarts, so things fail, but this only happened twice in the past two months and it is difficult to debug…) For this sensor I even built a nice housing from LEGO and placed it on a bookshelf (behind some books).
Wireless indoor sensor 2 in the bedroom
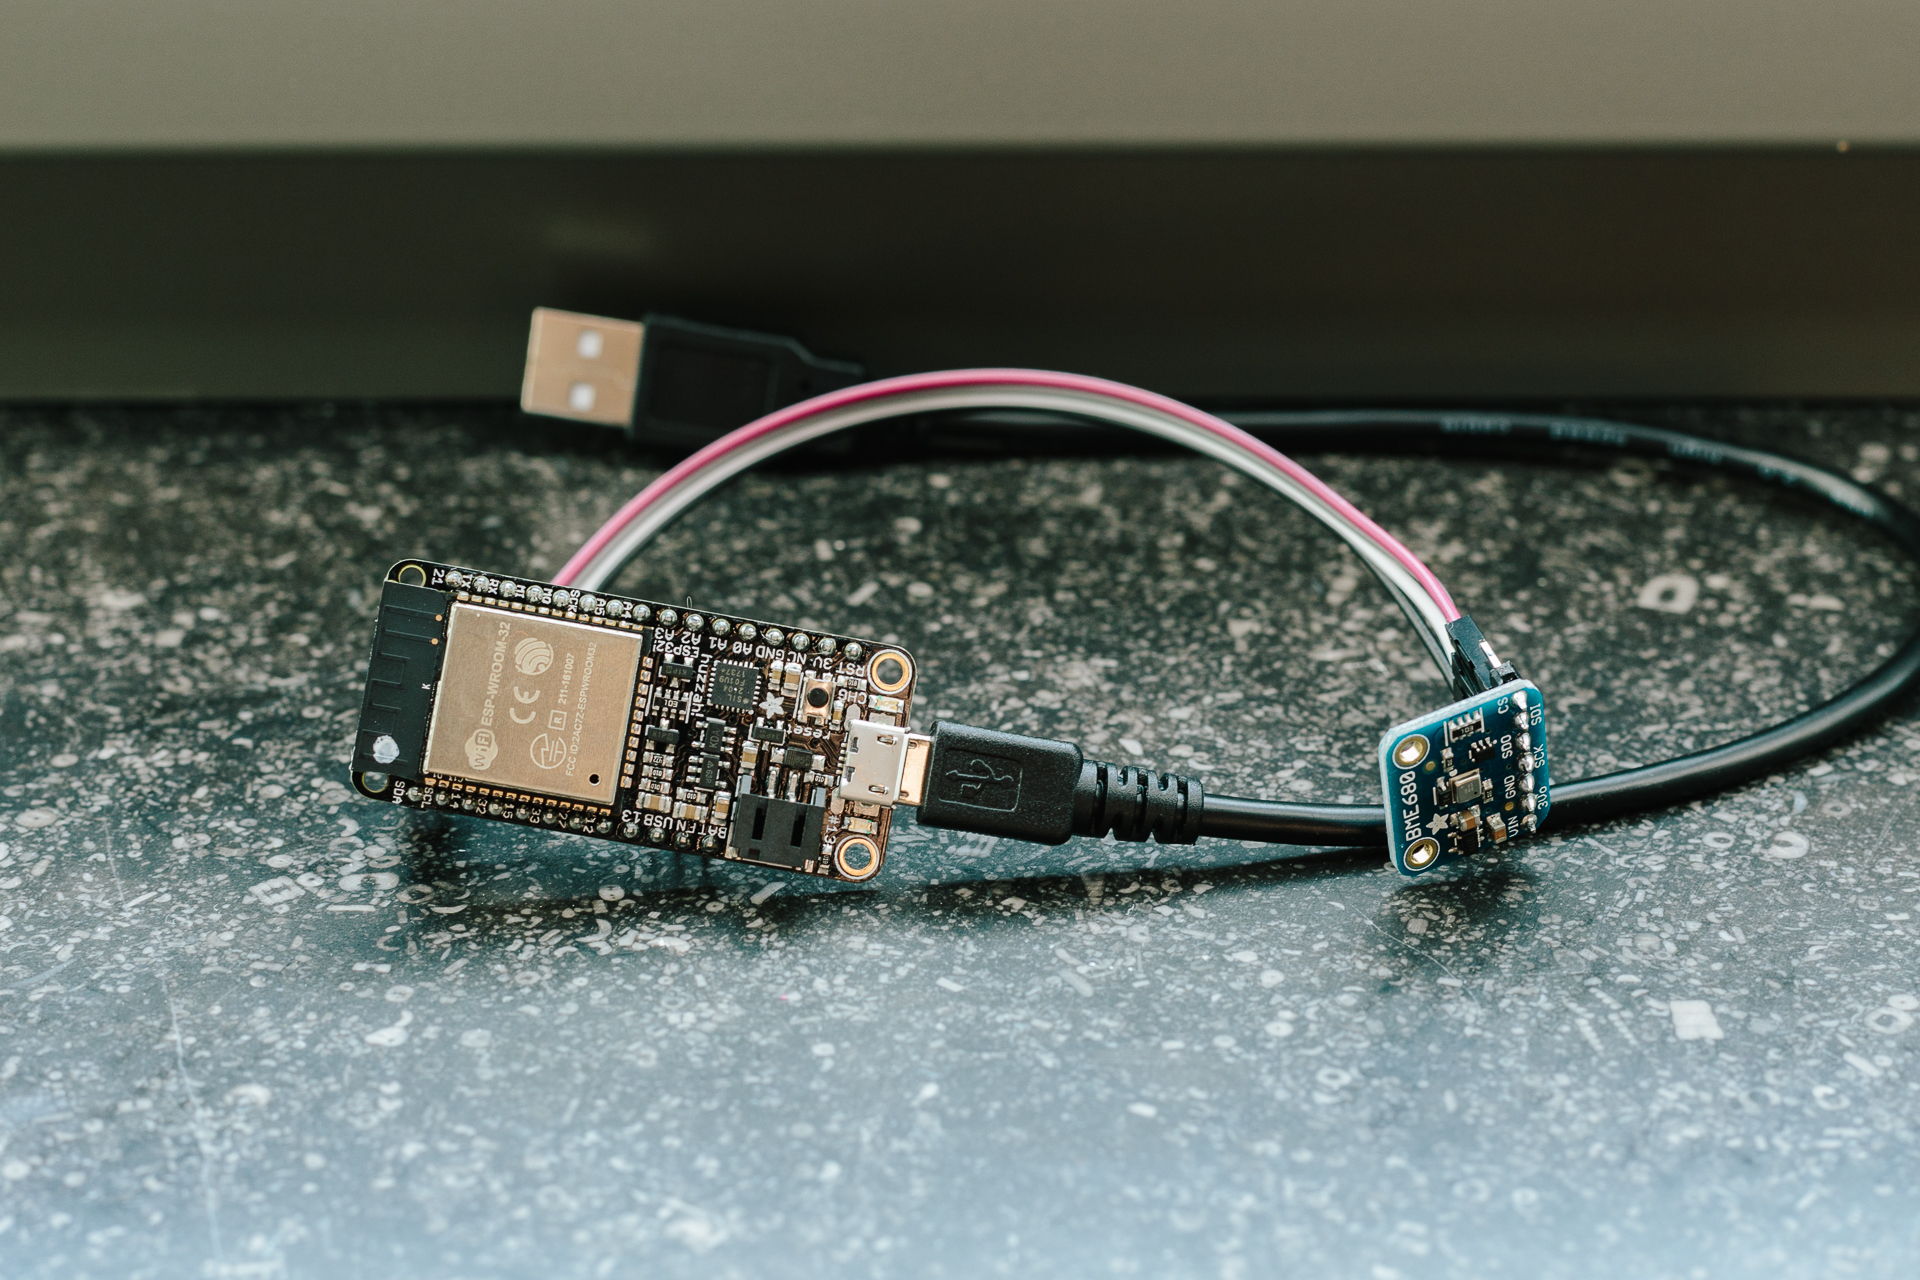
- Hardware: ESP32 Feather Board [with BME680 temperature/humidity sensor, USB power supply, jumper cables]
- Role: Indoor weather monitor
- Measurements: Temperature, humidity, and volatile organic compounds (VOC)
- Description: This was the last addition to the system, the setup is basically the same as for the other wireless sensor, except for some small changes in the coding and wiring due to the different sensing chip.
And what is the point of having this system? Nothing, I simply like gadgets data and plots :D But seriously, even though this is my number one reason (and my interest in weather), it is also quite handy that now I can see when it is worth opening windows to improve the indoor temperature/humidity. Also, it turns out, that blue-coloured haze on sunny mornings is simply high fine-dust concentration, a.k.a. air pollution :(