Tag Archives: maps

Trans Pyrenees 2020 – The Route

Four years after crossing the Pyrenees with Willem from East to West (see the relevant posts here), I am going to revisit the region, and bike from the Atlantic Ocean to the Mediterranean Sea with a colleague (Stef). After a few months of low activity levels and motivation, I finally got back into the sport around the Christmas holidays, and since then I have been commuting by bike again (I love my Brompton), and I have been doing some proper training both inside (Zwift training plan) and outside (when the weather permits, and lately it has been really wet and windy, so less often than I would like to). Of course I needed a proper goal too, because one of the reasons I had lost my motivation to ride last year was the apparent pointlessness of my training, so I definitely wanted to change that. And since I don’t like races and big busy events, what better is there to do than another self supported ride across the Pyrenees!

My planning technique has not really changed since 2016, I still used Strava (even though I had a look at Komoot too, but it had difficulties handling very long routes) and Google Street View to draw up the initial draft, then the availability of hotels set the final stage starts and finishes. I originally wanted to start from San Sebastián, but in the last minute it turned out that the one way extra fee for renting a car in France and dropping it off in Spain (that we need for the drive back to the start on the last day) would have been more than 2000 EUR, so at the end I had to settle with starting in Biarritz (where we finished four years ago).

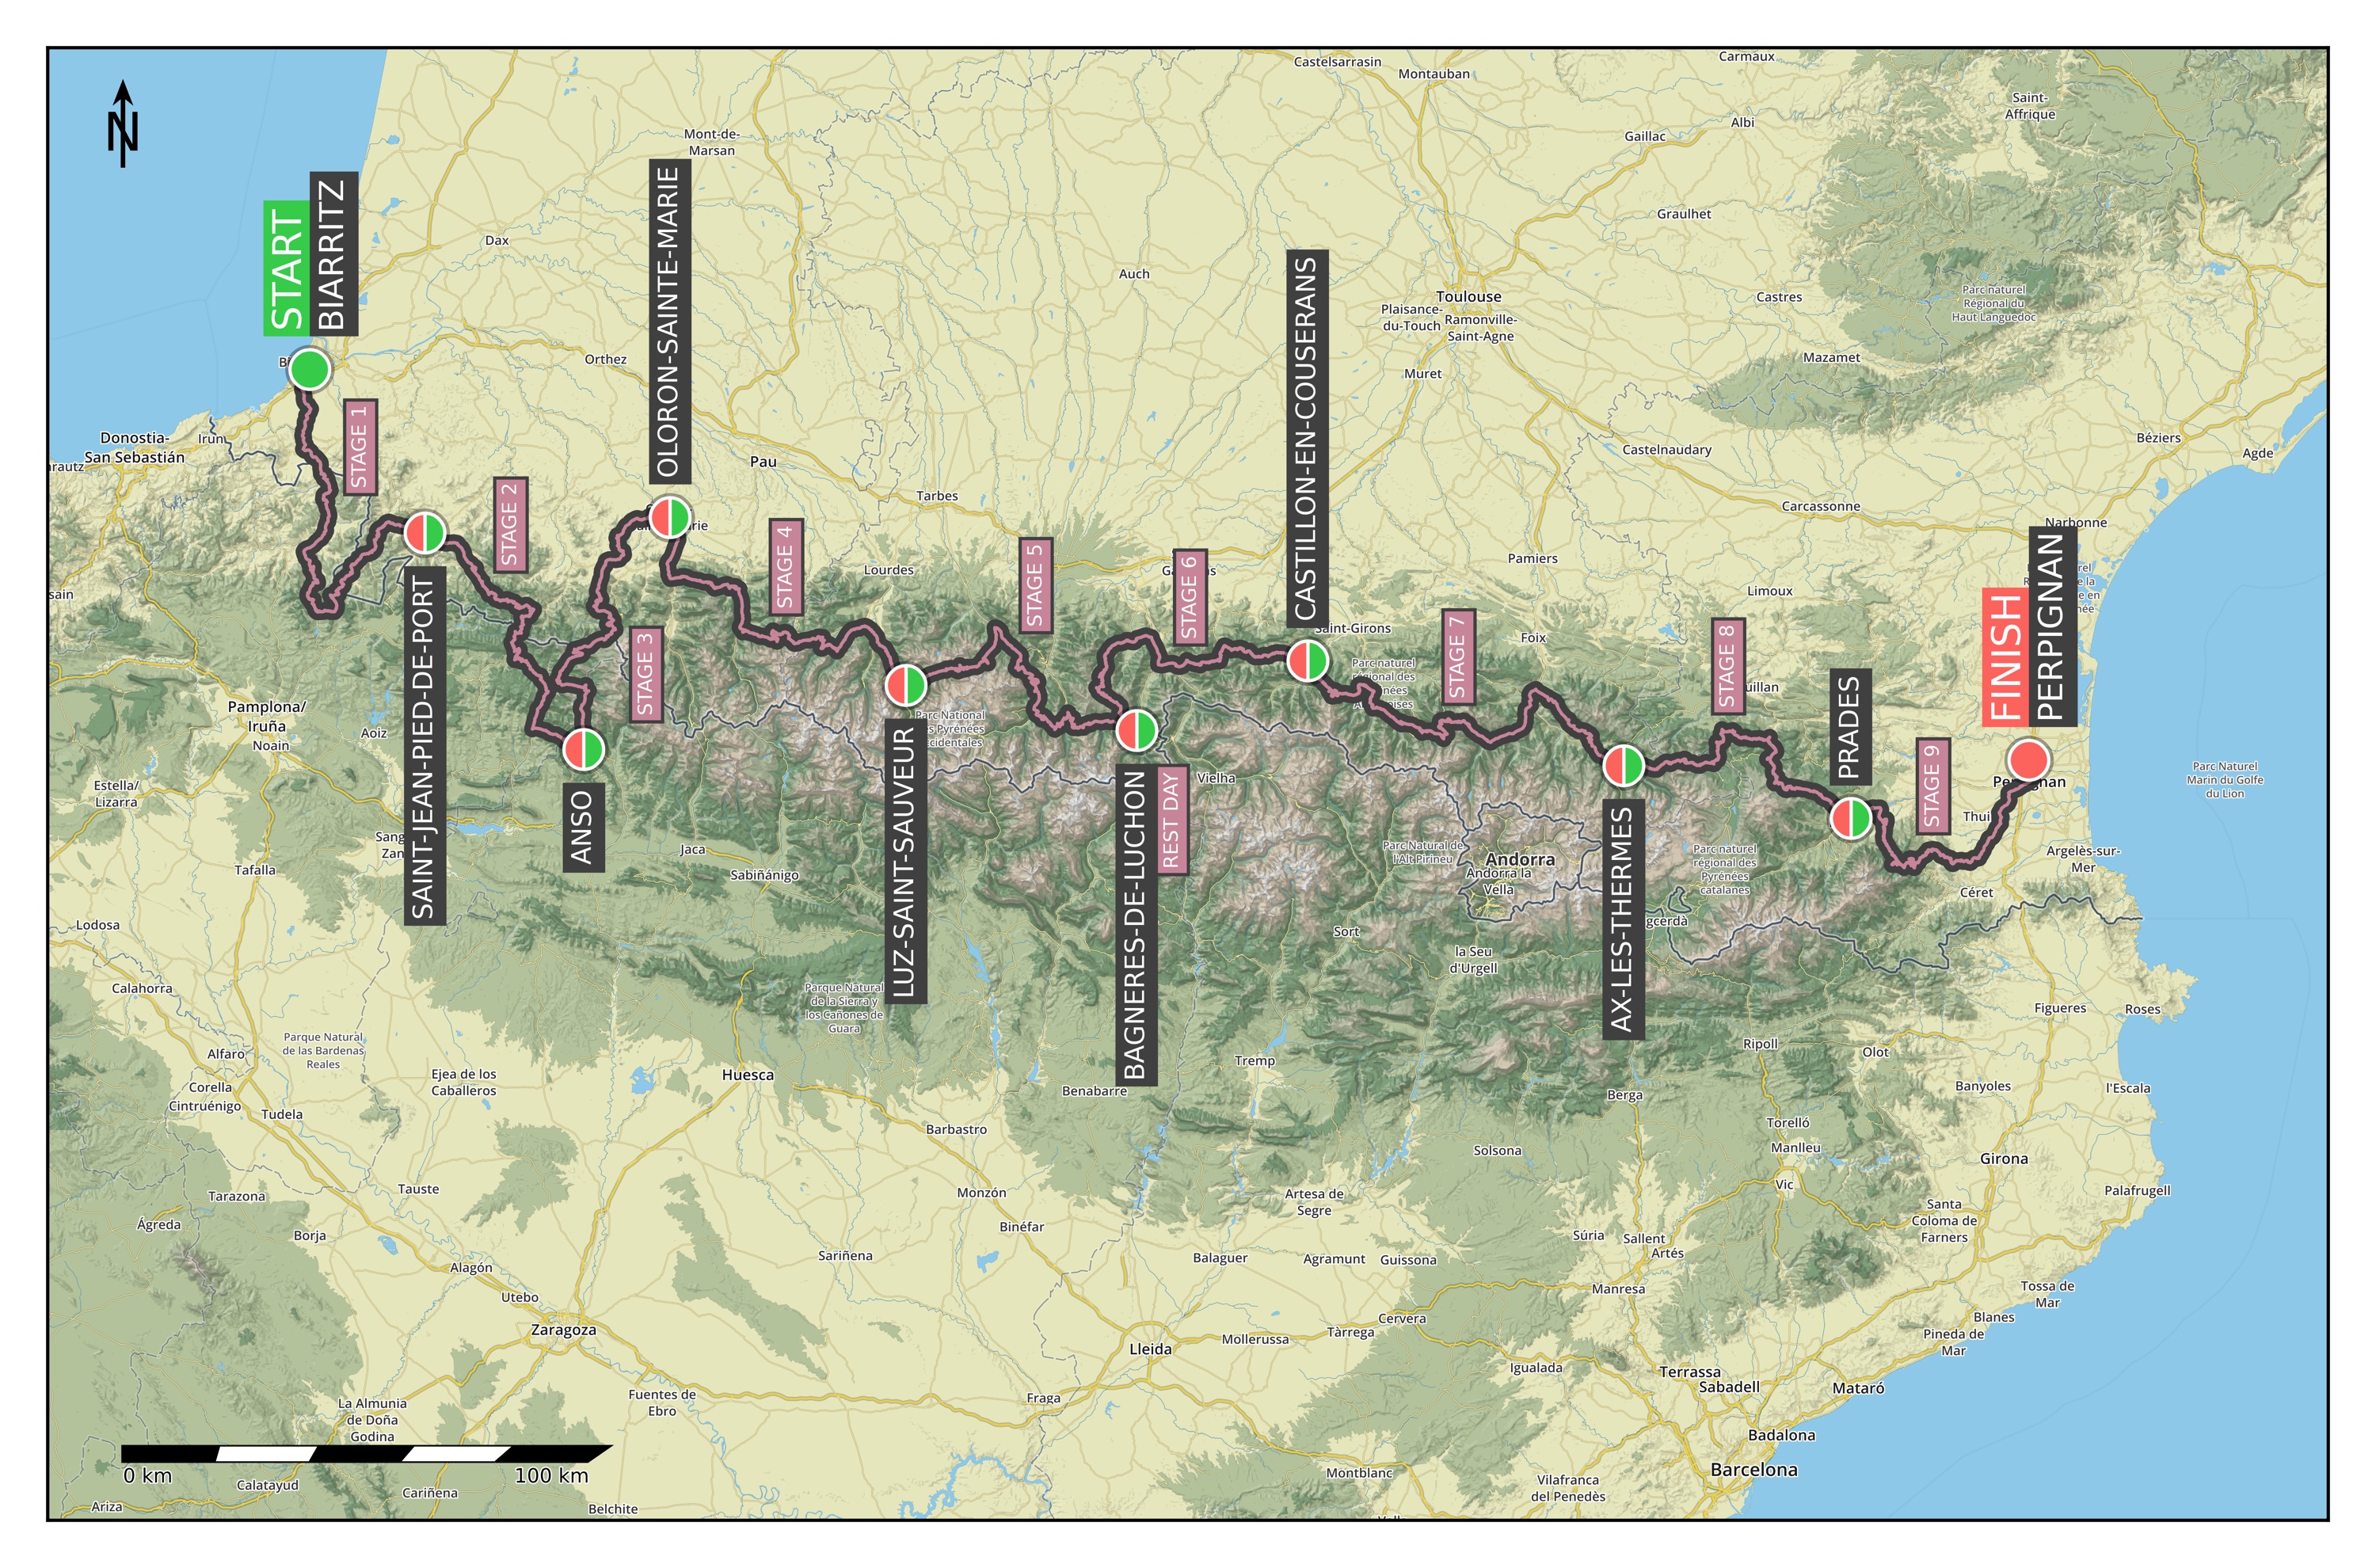
We have already booked everything (hotels, rental car from Perpignan to Biarritz, long-term parking in Biarritz), so now we just need to train. Being in a good shape will be definitely necessary, because while this time we will have a rest day in the middle, there will be much more climbing than the last time… The final route can be seen below.

It is a total of 993 km, and 25601 metres of elevation gain over 32 (+1) cols (excluding the rest day). An overview of the elevation profile of the whole route can be seen below. (The climb categories were calculated following the discussion presented here.)

Now here is a detailed overview of the planned stages with distances, elevation gains, maps, profiles, and a list of cols for each day:

  • June 10:
    Drive to Biarritz.
  • June 11:
    On the morning we drive to the airport, where we have long-term parking booked, and start from there.
    Stage 1) Biarritz – Saint-Jean-Pied-de-Port: 125 km | 2498 m+ (Map / Profile)
    – Puerto de Otxondo [570 m] Cat 2 (8.2 km @ 5.7%)
    – Puerto de Artesiaga [984 m] Cat 2 (12.8 km @ 5.7%)
    – Collado de Urkiaga [915 m] Cat 4 (6.9 km @ 3.2%)
  • June 12:
    Stage 2) Saint-Jean Pied-de-Port – Anso: 108 km | 3429 m+ (Map / Profile)
    – Col de Burdincurutcheta [1135 m] Cat 1 (9.0 km @ 8.8%)
    – Col de Bagargi [1327 m] Cat 3 (6.5 km @ 4.9%)
    – Port de Larrau [1578 m] HC (14.3 km @ 7.6%)
    – Puerto de Laza [1129 m] Cat 3 (3.4 km @ 6.1%)
    – Puerto de Matamachos [1148 m] Cat 2 (4.6 km @ 6.7%)
  • June 13:
    Stage 3) Anso – Oloron-Sainte-Marie: 104 km | 2158 m+ (Map / Profile)
    – Alto de Zuriza [1290 m] Cat 3 (13.8 km @ 3.2%)
    – Col de la Pierre St Martin [1766 m] Cat 1 (14.3 km @ 5.3%)
    – Col de la Hourcère [1440 m] Cat 3 (4.8 km @ 4.5%)
    – Col de Bugalaran [498 m] Cat 3 (3.3 km @ 6.9%)
  • June 14:
    Stage 4) Oloron-Sainte-Marie – Luz-Saint-Sauveur: 112 km | 3275 m+ (Map / Profile)
    – Col de Marie Blanque [1035 m] Cat 1 (9.1 km @ 7.8%)
    – Col d’Aubisque [1709 m] HC (17.0 km @ 7.0%)
    – Col du Soulor [1474 m] Cat 3 (1.9 km @ 5.0%)
    – Col des Bordères [1156 m] Cat 2 (4.2 km @ 6.9%)
  • June 15:
    Stage 5) Luz-Saint-Sauveur – Bagnères-de-Luchon ♛: 114 km | 3874 m+ (Map / Profile)
    – Col du Tourmalet [2115 m] HC (19.0 km @ 7.4%)
    – Hourquette d’Ancizan [1564 m] Cat 2 (16.6 km @ 4.3% – including a short descent)
    – Col de Val Louron-Azet [1580 m] Cat 1 (10.7 km @ 7.3%)
    – Montée de Peyragudes [1645 m] Cat 1 (9.6 km @ 7.3%)
    (- Col de Peyresourde [1569 m] practically in the descent)
  • June 16:
    Rest day: we will probably still bike, something short and flat, to keep the blood flowing and to get the total distance beyond the thousand kilometre mark ;) But the main plan is mostly staying horizontal, and eating as much as possible.
  • June 17:
    Stage 6) Bagnères-de-Luchon – Castillon-en-Couserans: 100 km | 2775 m+ (Map / Profile)
    – Port de Balès [1755 m] Cat 1 (18.8 km @ 5.9%)
    – Col de Menté [1349 m] HC (9.3 km @ 9.0%)
    – Col de Portet d’Aspet [1069 m] Cat 1 (4.3 km @ 9.5%)
  • June 18:
    Stage 7) Castillon-en-Couserans – Ax-les-Thermes: 137 km | 3667 m+ (Map / Profile)
    – Col de la Core [1395 m] Cat 1 (14.2 km @ 5.8%)
    – Col de Latrape [1110 m] Cat 2 (5.8 km @ 7.4%)
    – Col d’Agnes [1570 m] Cat 1 (10.3 km @ 8.0%)
    – Port de Lers [1517 m] Cat 3 (4.7 km @ 5.2%)
    – Pas de Souloumbrie [911 m] Cat 3 (6.3 km @ 5.5%)
  • June 19:
    Stage 8) Ax-les-Thermes – Prades: 102 km | 2717 m+ (Map / Profile)
    – Col de Pailheres [2001 m] HC (17.1 km @ 6.8%)
    – Col des Aychides [1008 m] Cat 3 (6.3 km @ 4.1%)
    – Col de Jau [1506 m] Cat 1 (17.9 km @ 5.8%)
  • June 20:
    Stage 9) Prades – Perpignan: 91 km | 1208 m+ (Map / Profile)
    – Col de Palomère [1036 m] Cat 2 (24.4 km @ 3.2% – including a short descent)
    Pick up the rental car in Perpignan and drive to Biarritz, where we stay for the night.
  • June 21:
    Drive home.

Trans Pyrenees 2016 – The Route

So here we go, it is less than a month till the cycling highlight of this year, an epic, self-supported duo-ride across the Pyrenees from the Mediterranean to the Atlantic coast. The idea came up on a training ride with Willem the past summer, more-or-less simultaneously, but I think Willem was the one who said it out loud first (I will make sure to remind him if necessary while we both suffer pedalling up on one of the numerous steep climbs).

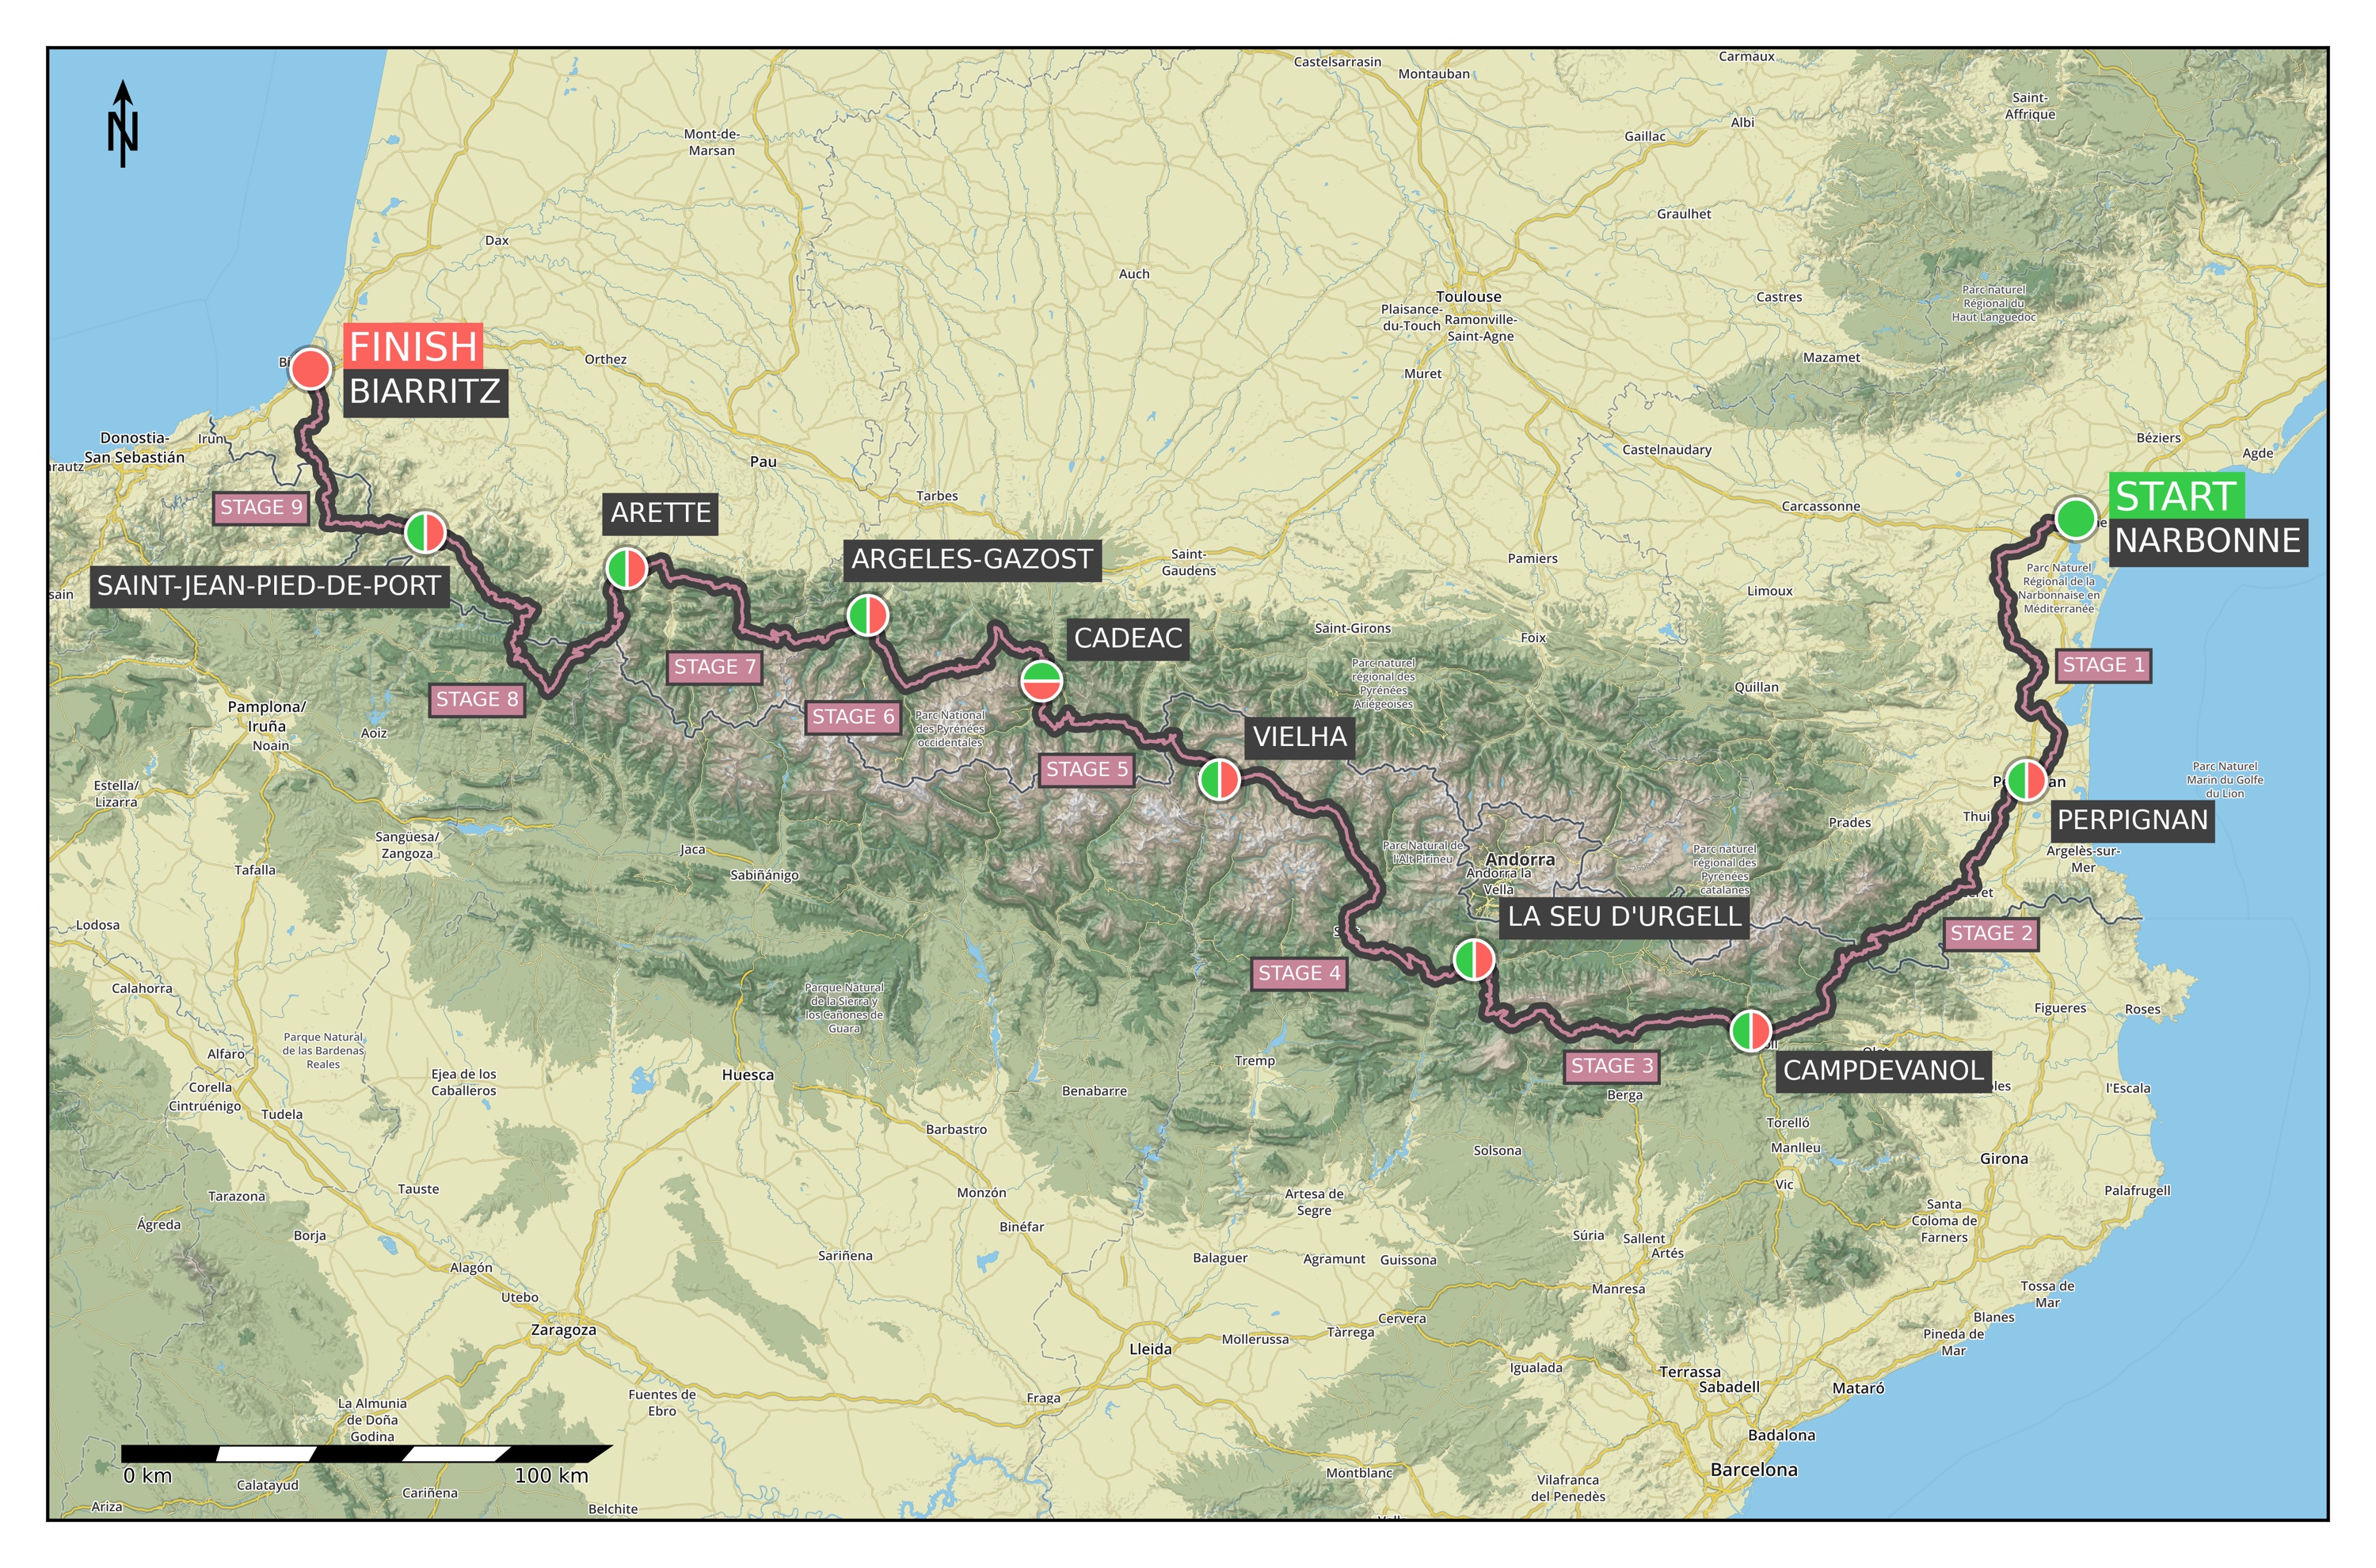
This post is about the planned route itself. I have designed the trajectory of the different stages mostly using the Global Heatmap of Strava and Google Street View on RouteYou (since the Route builder in Strava itself is horrible, it does not have Street View integrated into it, and the elevation gain is typically overestimated). Then I have used the exported .gpx files to make my own overview maps and elevation profiles with my custom-made python scripts ;) The main challenge of the planning was finding a balance between different factors, such as: crossing the Pyrenees over the highest number of epic climbs and cols, but without making unnecessary loops to keep the total distance (and the number of necessary days) at a reasonable level, plus preferably take low-traffic roads, and start and finish the day at locations where we can get a proper hotel for the night. This resulted in a preliminary plan, that was changed slightly when we booked all the hotels (a few start/finish villages were moved up/down along the route). This is how the final route was born before the end of January.

Overview_map

This is a total of 9 stages, 924 km, and 17635 metres of elevation gain over 22 cols (or 23, depending on how you count it). An overview of the elevation profile of the whole route can be seen below. (The climb categories were calculated following the discussion presented here.)

Overview_profile

Now here is a detailed overview of the planned stages with distances, elevation gains, maps, profiles, and a list of cols for each day:

  • June 3: Driving to Toulouse.
  • June 4: On the morning we bike to the train station from the hotel, and take the train to Narbonne, where it all begins.
    Stage 1) Narbonne – Perpignan: 91 km | 518 m+ (Map / Profile)
    – Col de Feuilla [250 m] Cat 4
  • June 5:
    Stage 2) Perpignan – Campdevanol: 122 km | 1757 m+ (Map / Profile)
    – Coll de Llauro [380 m] Cat 4
    – Col d’Ares [1513 m] Cat 1
  • June 6:
    Stage 3) Campdevanol – La Seu d’Urgell: 110 km | 1854 m+ (Map / Profile)
    – Coll de Merolla [1090 m] Cat 3
    – Coll de Josa [1620 m] Cat 2
    – Coll de la Trava [1480 m] Cat 3
  • June 7:
    Stage 4) La Seu d’Urgell – Vielha: 124 km | 2499 m+ (Map / Profile)
    – El Canto [1720 m] Cat 1
    – Port de la Bonaigua [2072 m] Cat 1
  • June 8:
    Stage 5) Vielha – Cadéac: 82 km | 2190 m+ (Map / Profile)
    – Col du Portillon [1293 m] Cat 2
    – Col de Peyresourde [1569 m] Cat 1
    – Col de Val Louron-Azet [1580 m] Cat 1
  • June 9:
    Stage 6) Cadéac – Argelès-Gazost: 82 km | 2034 m+ (Map / Profile)
    – Col d’Aspin [1489 m] Cat 1
    – Col du Tourmalet [2115 m] HC
  • June 10:
    Stage 7) Argelès-Gazost – Arette: 92 km | 2248 m+ (Map / Profile)
    – Col du Soulor [1474 m] & Col d’Aubisque [1709 m] Cat 1 (small downhill in between)
    – Col de Marie-Blanque [1035 m] Cat 2
  • June 11:
    Stage 8) Arette – Saint-Jean-Pied-de-Port ♛: 134 km | 3412 m+ (Map / Profile)
    – Col de la Pierre St Martin [1766 m] HC
    – Laza [1129 m] Cat 3
    – Port de Larrau [1578 m] Cat 1
    – Col de Bagargi [1327 m] Cat 1
    – Col de Burdincurucheta [1135 m] Cat 3
  • June 12:
    Stage 9) Saint-Jean-Pied-de-Port – Biarritz: 87 km | 1123 m+ (Map / Profile)
    – Col d’Ispeguy [672 m] Cat 2
    – Col d’Otxondo [602 m] Cat 3
    After the ride, we drive with a rental car to Toulouse, then bike or walk to the hotel where we left our car (as the drop-off for the rental car will be at the airport too), and drive to another hotel for the night.
  • June 13: Driving home from Toulouse.

That is it for now. In the next post I will go over the gear we are taking with us, with a detailed description of each piece we will/might need on the road.

Designing a better map for outdoor activities with MapBox

A few days ago Strava (probably the most famous activity tracking app/site) unexpectedly switched from Google Maps to OpenStreetMap (OSM). The switch was most likely done to save money, and since it was executed completely unprofessionally, basically replacing the Google Map layer with extremely badly styled OSM data using MapBox, many people (including me) got pretty mad about it. The change should have been carried out after a proper test phase, asking feedback from (at least the premium, paying) users, building proper map styles, and communicating it to the community in a detailed, timely manner. Also, the biggest problem is not the switch to OSM, because it is a very welcome option especially for off-road cyclists and trail runners (when the OSM data is presented in a proper way – and this is the main topic of this post), but dropping Google Maps, and especially the removal of Street View. Street View was used by many of us to plan our rides (check road surface, traffic levels, segments, etc.), and to check out rides/runs of our friends on Strava, to see where they went. Google Maps can be replaced by OSM as I will show below, but there is just no alternative to Street View… (And then I did not even mention how much worse the satellite data provided by MapBox than Google Maps.) This is not what I expected from Strava, especially not as a paying customer… Anyway, let’s move on.

What do I want from a map (for planning rides, and viewing activities afterwards):

  1. Road network and environmental data: all the different road types (from highway to path), vegetation (forests, grassy areas, agricultural areas, etc.), water bodies, and so on.
  2. Topographic data: contour lines and shaded relief.
  3. Proper colour coding and style: it should not be too vivid, but no nearly indistinguishable watercolours either. Differentiate between different types with colour and line style (e.g., road hierarchy with colour, paved/unpaved or accessibility with line style). When the GPS track of the activity is plotted over the map, it should not get lost in the details around it (thus don’t use the colour in the map that you later want to use for the track). Colour coding and line styles should be consistent across all zoom levels. Labels should be clear, well readable, not too busy, not too sparse.
  4. Adequate level of detail (LOD) on all zoom levels, with smooth transition between levels (no huge jumps in data content or style between levels, fade in/out data if necessary). Trails should not be visible when looking at the full continent, but as you zoom in, more and more data should appear. Low-resolution data should be properly replaced with more local, high-resolution data where possible.
  5. Useful information: display data that is useful for the intended use of the map: bike lanes, cycle paths, MTB tracks, forest trails, paved/unpaved surface information, etc. Some points of interest are more interesting than others, thus give more weight to the interesting ones.

Where Strava clearly does not meet my expectations right now is point 3. And without proper style, no map can be good, no matter how good the data behind the map is. OSM is a bit like Wikipedia. It’s open, it can be edited by anyone, thus it is very easy to collect immense amounts of very specific geo data thanks to the broad user base, but of course it will have its problems too. While Google might not have some specific hiking trails, etc., it has a full global coverage, with proper quality control. OSM have regions with extremely good coverage, and then other regions where even main roads might be missing. On the other hand, OSM indeed has cycle paths, hiking trails, road surface information, and every tiny possible detail what the users manage to give in. (I just added our building with house numbers, the driveway, and corrected some roads in the Observatory on La Palma, and these changes showed up within a few minutes on the map. That’s cool of course.)

Of course this also means that the OSM data base is huge, so if you need a custom lightweight map (and connected/mobile applications need these), MapBox comes in handy. After creating a free account (which will limit you to one custom map and 50000 monthly map views, which is plenty enough for a single user), and installing the MapBox Studio software, you get easy access to a huge OSM and terrain database in the format of vector tiles. Then with some very basic CSS knowledge (and/or after reading some manuals) you can easily change the stile of the different vector layers and elements. You can customise the line stiles, colours, labels, POIs, icons, the displayed data, and even add your own data if necessary. Starting and learning from the provided examples it is actually very easy to fine-tune a map to your own needs (and taste). There are some serious caveats though. First of all, not all OSM tags are preserved when MapBox creates the tiles, which means that, e.g., a footpath across a park and a sidewalk actually gets the same class and type. This is annoying, because I don’t want to show sidewalks, but I want the trails through parks. Also, if there is a cycle lane and a small road which also holds a cycle path, although bot have the highway=cycleway tag, because the second have other tags too, it is converted as a path (a.k.a. a trail). And since the road surface information is also not transferred from OSM, it is impossible to differentiate between such an actually perfectly good paved cycling surface and a gravel trail. Also, I have found some strange cases where canals are nicely drawn in OSM, but in MapBox, they show up with a line… There are a few similar problems (elevation contour data around our place is like 100 m off, while it seems ok at other places), but the platform is really great.

I started from the Mapbox Outdoors layer, and modified that to end up with my custom style. In short, I have changed most of the colours, the contour lines and the topographic shading, made the road hierarchy more clear, cleaned up some zoom level transition issues, road constructions, added in glaciers, mountain peaks (with custom icons from another style), extra agricultural land use data, one way street signs, refined how water lands are displayed, and separated the island names from the common POIs. Here is an interactive version, feel free to zoom in and out and check out other places (especially some mountains, because we don’t have those here) too!


To make things even better, the creator of Veloviewer has added the option of having such a custom MapBox style on the site, so now I can actually see my cycling/running/hiking routes on this map! Awesome. That’s what I call great customer service. I use Strava for its social aspects, that I can see what my cyclist/runner friends are doing (which also helps me to discover new routes), and because I can compare my efforts on different road sections to others and to myself (which is always a nice motivation to train more), but when I want to track my yearly progress, I always go to Velowiever. It is a great extension to Strava. Now I am doing that more often to just look at my activities too, since it hurts my eyes to look at the dull maps on Strava. I hope the situation will improve, because one of the first reasons why I started using it was the nice, clean design of the site, and that it had everything I needed, but with ugly maps, I am not sure I should pay for the premium membership anymore. It is not giving me much extra anyway, as for the detailed analysis, I use Golden Cheetah anyway. For the yearly subscription fee I would expect innovation and new features, not loosing features like Street View. So they better start doing something besides optimising their profit…