Tag Archives: plots

Weather and air-quality monitoring system (an update after 1 year of operation)

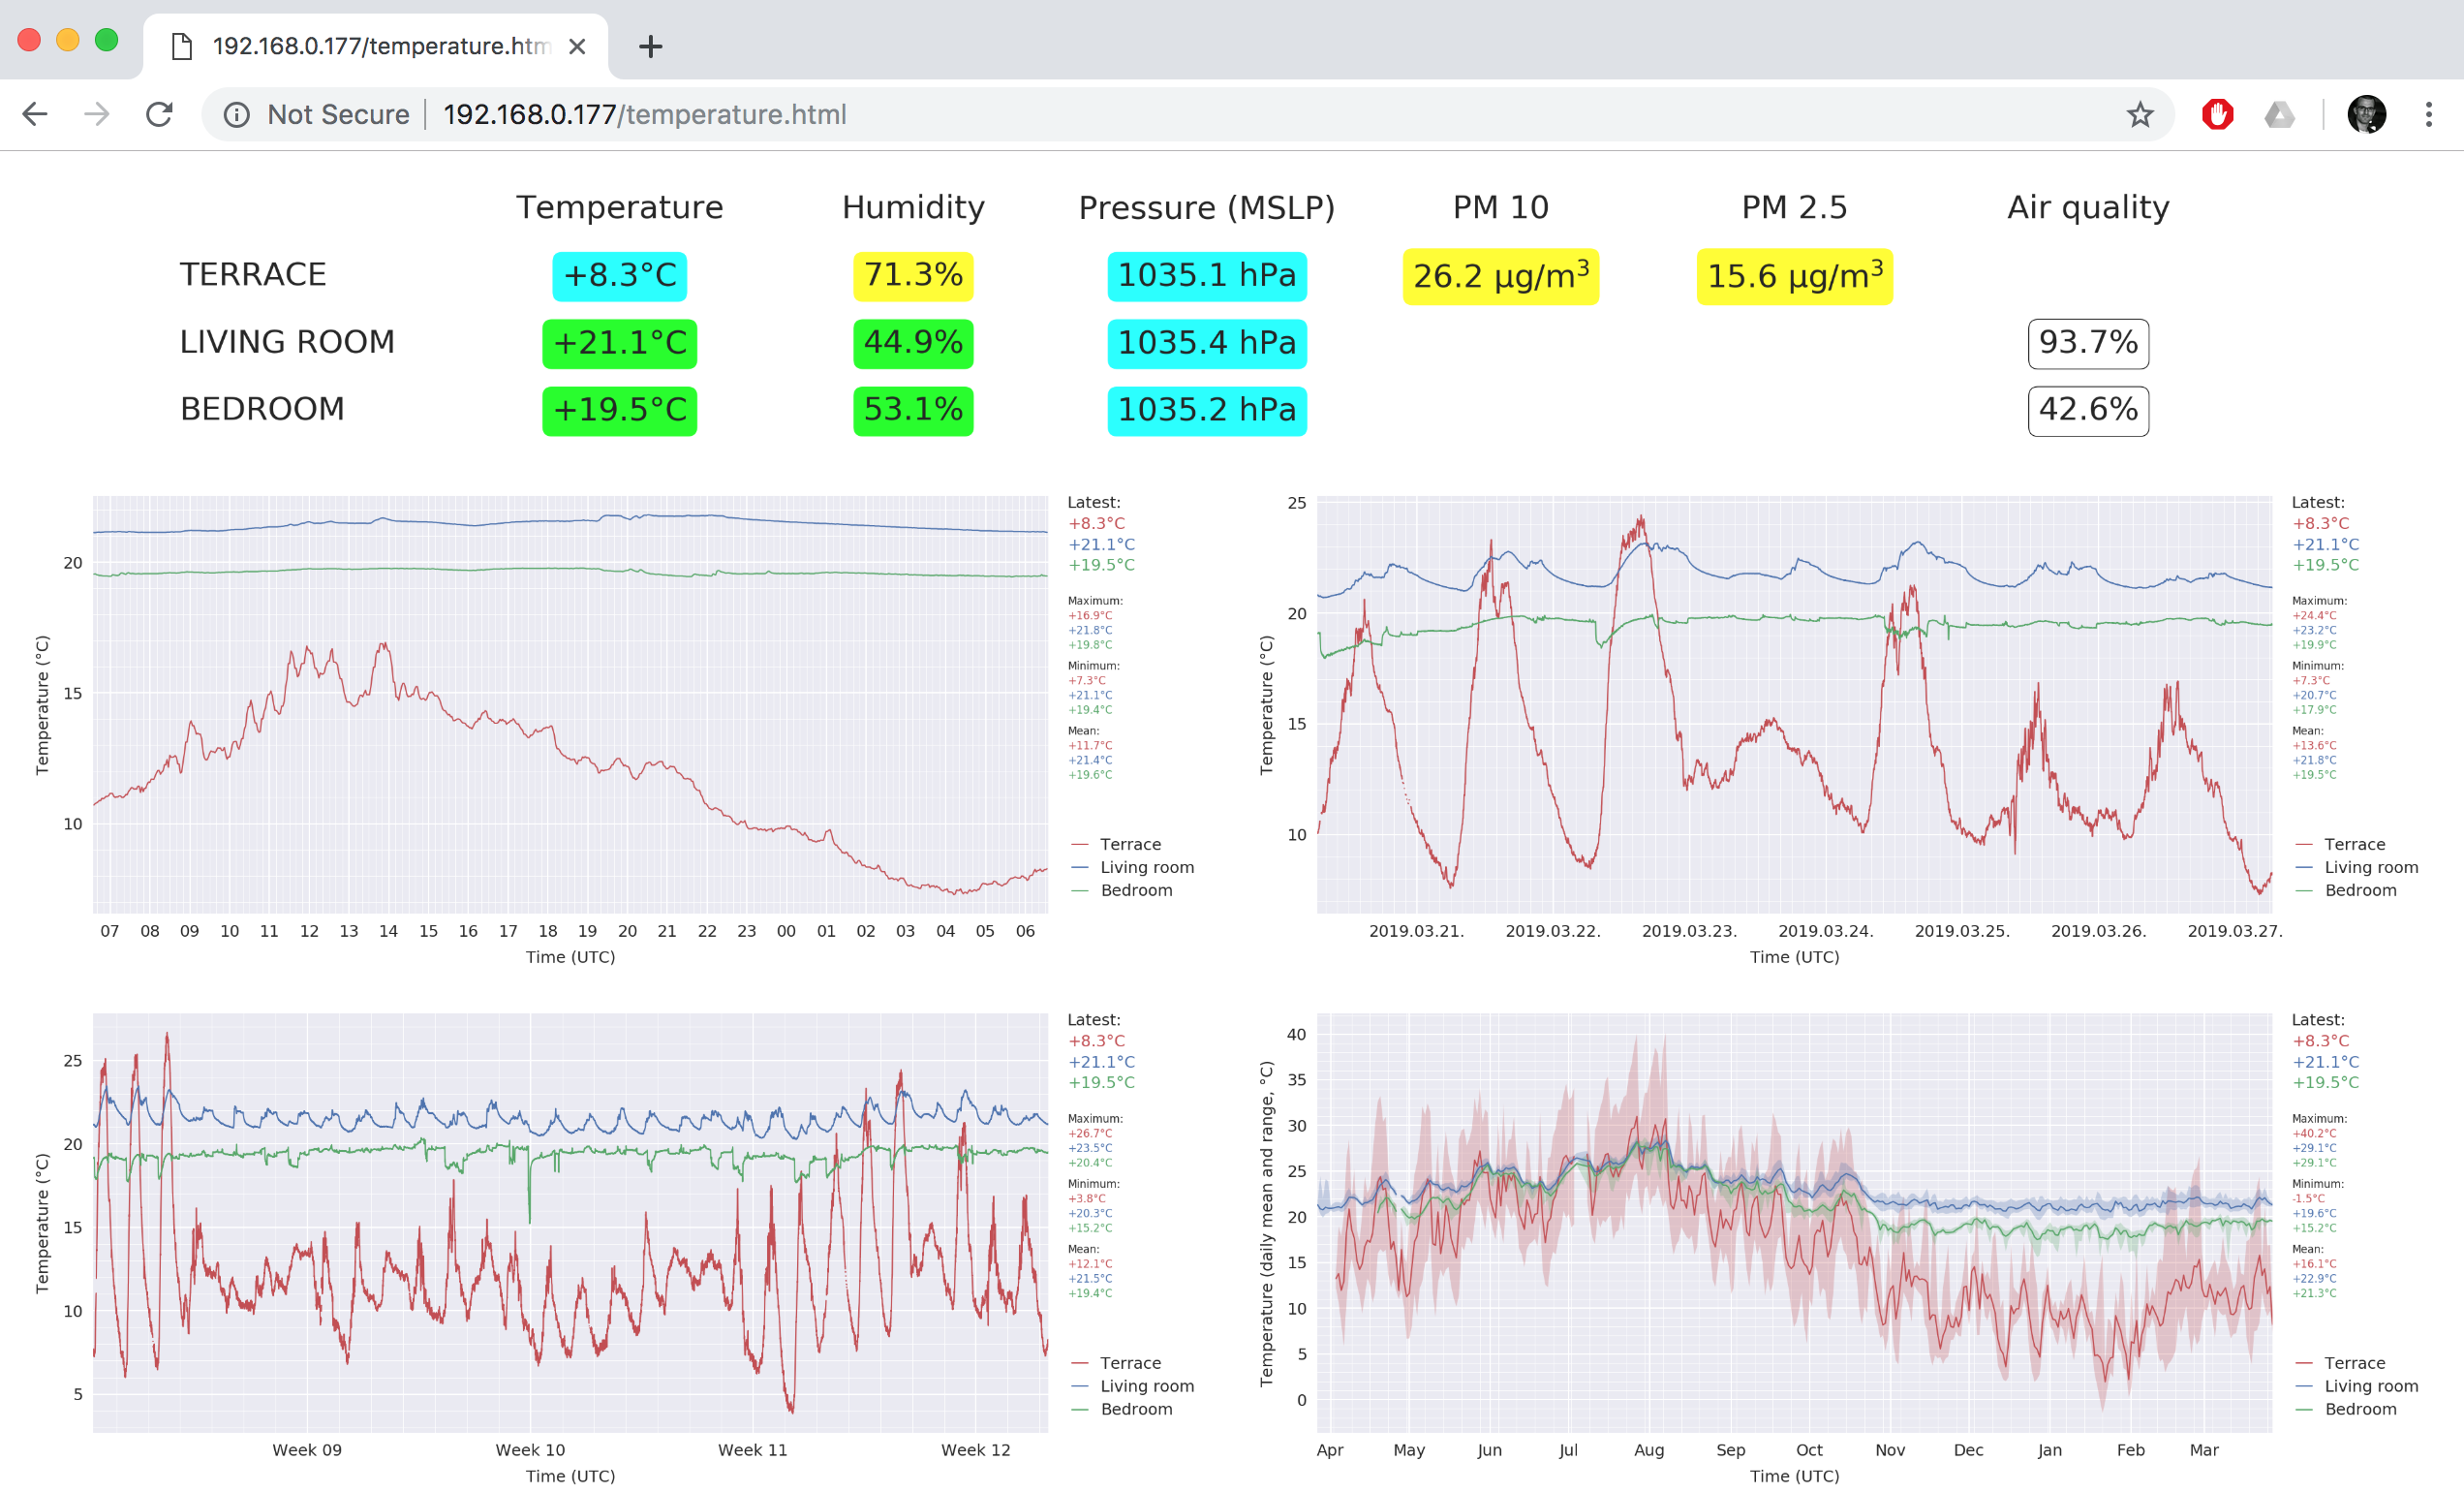
Those who still follow this blog (I am very proud of you, also, hi Mom and Dad!) might remember that a year ago I put together a small home-monitoring system. A few days ago it passed one year of recorded data on the longest active components (the fine dust concentration sensor and the indoor temperature and humidity sensor). Therefore I thought it might be interesting to give a small update on the status of the system, and how it performed on the long term. First of all, just for the show, here is the look of the monitoring dashboard after clicking on one of the temperature plots (by default the daily plots are shown for temperature, humidity, pressure, and fine dust concentration).

It is very satisfying that the ever-shringking gap in the beginning of the yearly plot is finally gone! So what are the main changes I made during the past 12 months? First of all, the “Wireless indoor sensor 1” in the living room got upgraded to the same model as the “Wireless indoor sensor 2” was in the bedroom, meaning that I replaced the DHT22 sensor in the living room with a BME680 sensor. Since then (12 September 2018) I have pressure and air quality measurements from the living room too, and most importantly, the temperature measurement is reported with a 0.01°C resolution (instead of the 0.1°C before). This actually makes a big difference in nicely recording the smooth cooling and warming cycle during the day.

On the plotting front I switched from displaying the raw data in the yearly plots to only plotting the daily averages and the minimum/maximum ranges, because the raw data was just too busy to look at. (Note below how the more-or-less stable indoor temperature of the heating-season differs from the warm summer months where outdoor temperature influences the indoor temperatures very strongly. Also, during the heating season there is a constant temperature difference between the living room and the bedroom – where we never turn the heating on and open the windows often even during winter -, while this difference disappears during the hottest months as the walls of the building get warm.)

Most of the time the system works perfectly fine with zero down-time. As you can see above, there was only one week in July when the system was down, as the result of a power outage just after we left on holidays. I think there was a conflict with the IP addresses distributed by the wireless router after the power came back online, so even though both the wireless sensors and the Raspberry Pi rebooted just fine, the RPi did not get its preferred IP address (something else got it instead – unluckily this can happen when you have a ton of wireless devices and a router from an internet provider that does not allow fix IPs). Therefore the wireless sensors could not connect to the RPi and that kind of screwed everything up, because the script running on the RPi can not handle not receiving any data from those (I know, bad programming). It still happens once in a few months that the wireless network needs a reboot, but most of the time the whole system just works, so overall I am satisfied with it.

Maybe the only real annoyance is that the data from the outdoor sensors is actually read from the server of https://luftdaten.info and not received directly via MQTT like it is done with the two indoor wireless sensors. This is because the outdoor sensor setup is not my own creation but part of a citizen science project with its own firmware that does not support the MQTT protocol, so setting up any kind of direct access would be way too complicated (for me, and for the amount of time I am willing to invest in this). As a result there are – although quite infrequently – periods when getting data from the server is difficult because the API becomes very slow (because of heavy load on the server), and that can result in missing some data points…

February, March, April…

Again more-or-less three months without blogging. It is getting more and more difficult to find time or motivation to write, but there are so many things I would want to remember later, and my blog is the best diary, so let’s see what you missed. (Also, since most of my written English practice comes from this blog, I have to admit that I felt quite bad about my language skills while writing this post… Another reason to write more often. Then again, there is this thing about promises and not being able to keep them, so, whatever…)

LEGO: After my mountain bike, I got myself another – much cheaper – present for my birthday: the NASA Mars Science Laboratory Curiosity Rover from LEGO! It gave me a nice evening of assembling, and now it is on display below our TV. Undoubtedly, LEGO was the best toy of my childhood – even when we got our first computer, I kept playing with it. Among my favourite constructions were a suspension bridge, and an astronomical telescope in a proper rotating dome, but I always enjoyed simply following the instructions too. Ah, those were the days! I don’t think I will ever be too old for LEGO. Maybe at one point I should get all my LEGO from Hungary, since I don’t think my brother wants to play with it… The only problem is, that 1) we probably have no space for all that LEGO, 2) there is no way we could fly them over without paying extra for the overweight bags. It is really a lot of LEGO :)

2014_spring-1

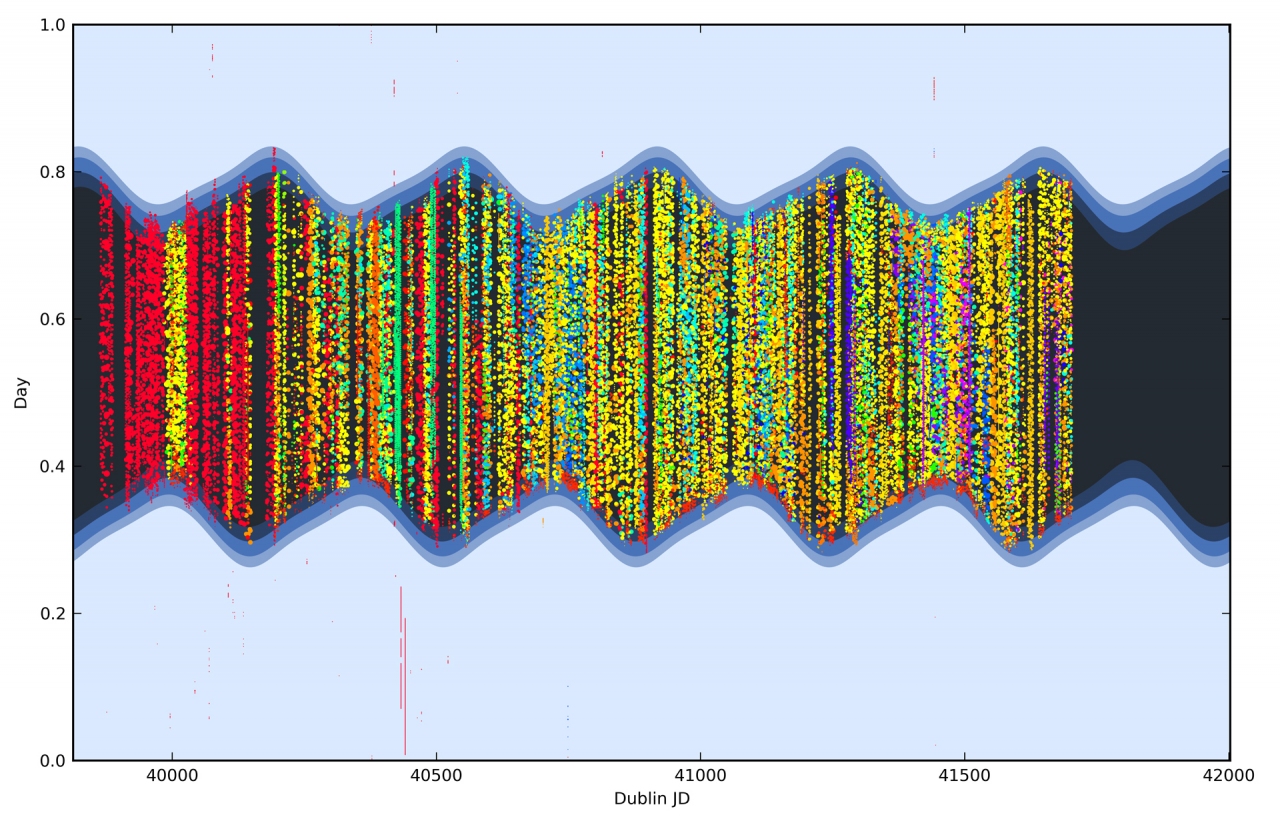
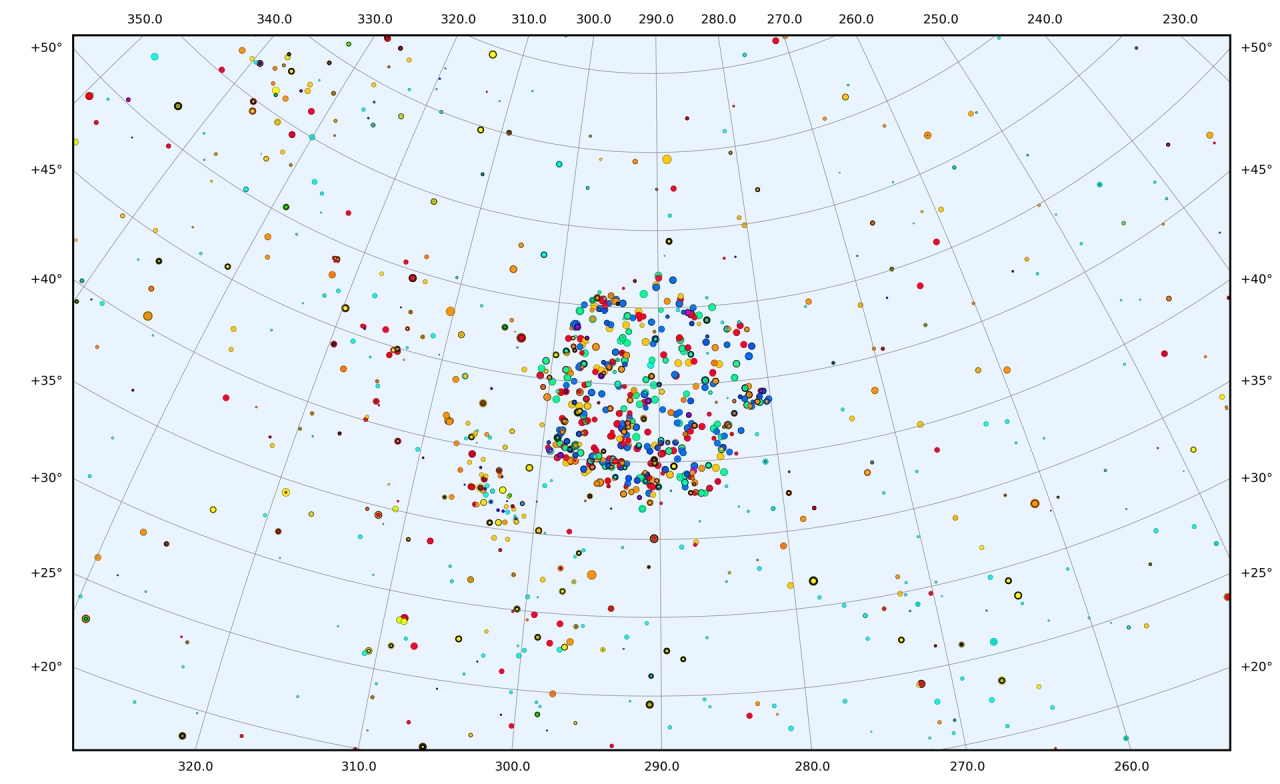
Plots: Anyone who has been reading this blog for a while must know, that I am a data-freak. While preparing my annual seminar talk for the institute I also spent some time on data-mining and visualisation using the database of observations made with the HERMES spectrograph (at the Mercator telescope on La Palma). It turned out, that I have the 3rd highest amount of observing time at the instrument. (Even without counting the time I spent there with the master students as support astronomer – if one was to add those nights to my sum, then I would be winning with quite a landslide.) As an example, here is a plot showing the distribution of all HERMES observations throughout the first 5 years of HERMES, and a plot showing their distribution on the sky near the original Kepler field (different colours mean different observing programs, the dark blue area on the first plot represents the night time, and the symbol size is connected to the exposure time).

2014_Mercatorplot-1

2014_Mercatorplot-2

You can see – among many other things – how seasonal some observing programs are, and how well covered the Kepler field is. This was a nice exercise with python to learn a few new things about projections and calendar-data visualisation.

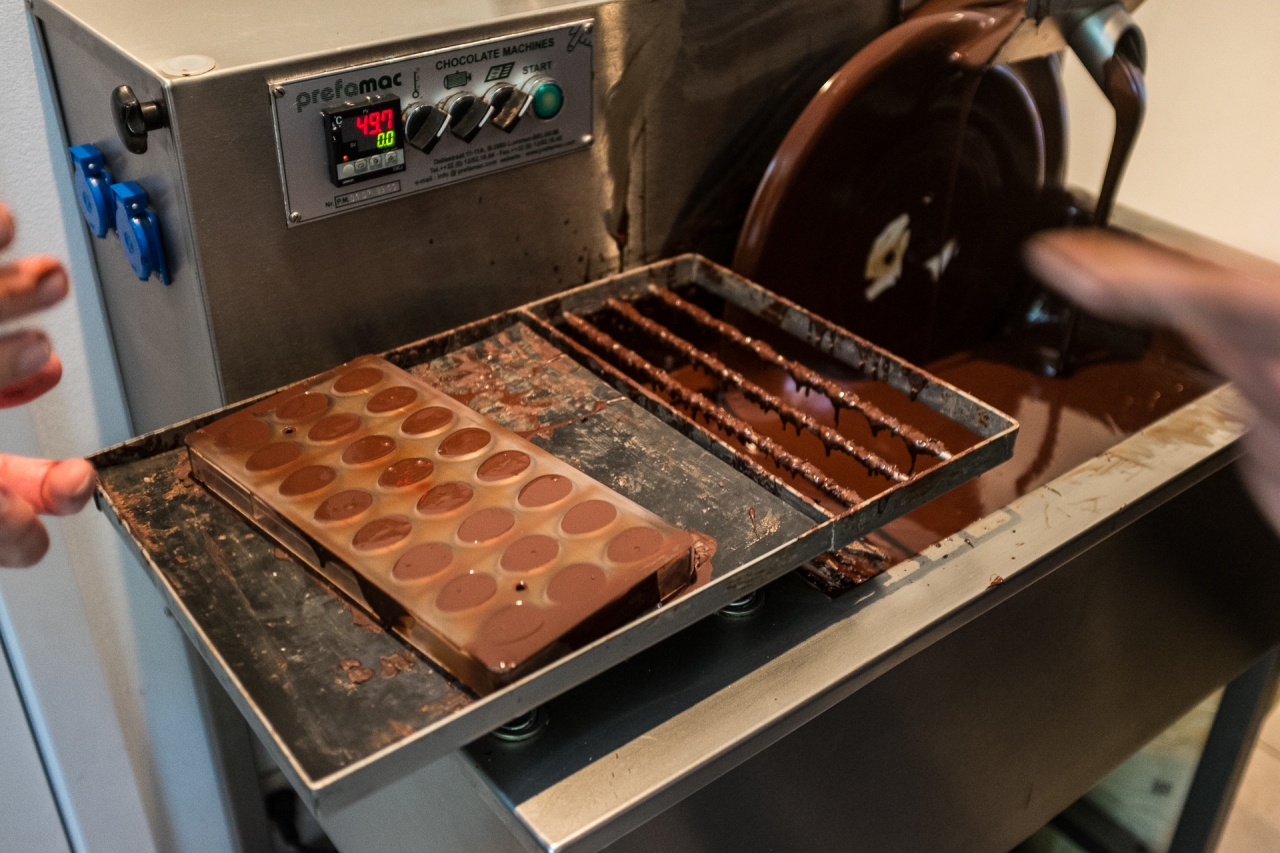
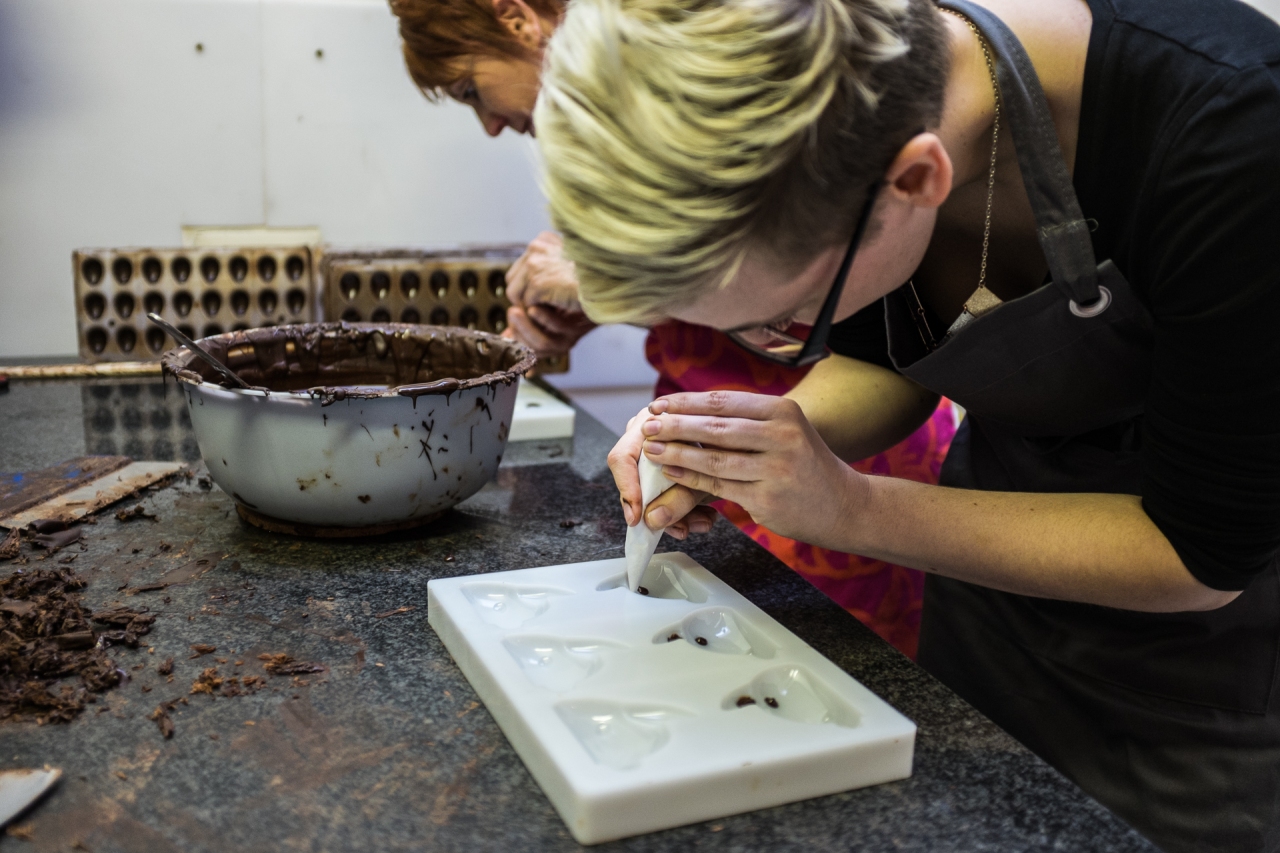
Making Belgian chocolate: After my public PhD defence I got a voucher for a chocolate workshop from my colleagues, but we only managed to go and do it now, at the end of March. It was a two hour session in the Bittersweet Chocolatier in the centre of Leuven, and we got to make small praline filled chocolate easter eggs, larger chocolate figurines, and pistachio balls covered in chocolate. It was a very nice experience, even without mentioning the half kilogram of – both self made and original Bittersweet – chocolate each of us got to take home afterwards :) I think it was definitely the best PhD defence present I have seen so far.

2014_spring-6

2014_spring-2

2014_spring-3

2014_spring-5

2014_spring-4

2014_spring-7

Royal Greenhouses of Laeken: Last week my mother came for a visit, and this time she finally got to enjoy the Belgian sunshine for a bit longer than a few seconds. Her only wish was to visit the coast and take De Kusttram between a few of the coastal towns, which we did on our first full day. The weather was warm, but we still got to use our umbrellas in a short thunderstorm which caught us while walking through the dunes. I also brought along my kite, but this time there was basically no wind at all (which is extremely rare on the coast), so I could not play much with it. There were other people with kites desperately waiting for stronger winds too…

On the next day, we went to Brussels to visit the Royal Greenhouses of Laeken, which is only accessible to the public during a short, three week long period each spring. It was very beautiful, despite being a little bit crowded. Although I think that the variety of plants in the – much smaller – botanic garden of Leuven (which we visited just a few days earlier with Clio, and on the following day with my mother) is larger, there is no doubt that the architectural beauty of this place, and the amount of blooming flowers there was truly exceptional.

2014_spring-8

2014_spring-9

2014_spring-10

2014_spring-11

2014_spring-12

2014_spring-13

Work: Research usually takes more time than originally expected, but this time I really underestimated how much of it would take me to finish my latest paper. When I discovered something particularly interesting during the conference in Sydney last year, I though I could be finished with the necessary analysis before the end of the year (2013). Then we ran into various unexpected problems (shit happens when you do thing which were never done before), resulting in a delay of several months… But now, just before leaving to Chile (more about that later), I finally submitted the manuscript to the usual journal (A&A). Let’s hope the referee will find our work worthy, and I can show you (or at least post about) the results in a few months!

The Performance Management Chart

Now that I can analyze and plot my workouts in detail, and I can estimate the Training Stress Score (TSS) of each ride, it is time to make use of all the statistics. It is nice to have numbers quantifying my trainings one-by-one, but how nice would it be to track my form and fitness during the season based on the volume and intensity of my rides. This is the concept behind creating the Performance Management Chart. I will write down (partly quote, or just rephrase) here the most basic things, but again, everything is based on the following two articles (take time to read them, they are very interesting):

What is the Performance Management Chart in TrainingPeaks WKO+?, by Hunter Allen
The scientific inspiration for the Performance Manager, by Andrew R. Coggan, Ph.D.

Andrew R. Coggan defines form as a combination of fitness and freshness (Form = Fitness + Freshness). You will have a really good day in the saddle when your fitness level is high, and when your fatigue level is low. Fitness is a response to training stress (or training load); the more you train the better you will be. Freshness is simply a result of rest. As TSS quantifies training load, knowing TSS values of workouts from the past enables us to determine the rider’s fitness in the present, and see how much training is needed in the future to raise this level higher.

The Performance Management Chart is based on Banister’s impulse-response model (see 2nd article for details), and we define the following components:

1) Chronic training load (CTL) provides a measure of how much an athlete has been training historically (chronically). It is calculated as an exponentially-weighted moving average of daily TSS values, with the default time constant set to 42 days. CTL can be viewed as analogous to the positive effect of training on performance in the impulse-response model. It is a relative indicator of changes in performance ability due to changes in fitness.

2) Acute training load (ATL) provides a measure of how much an athlete has been training recently (acutely). It is calculated as an exponentially-weighted moving average of daily TSS values, with the default time constant set to 7 days. ATL can be viewed as analogous to the negative effect of training on performance in the impulse-response model. It is a relative indicator of changes in performance ability due to fatigue.

3) Training stress balance (TSB) is the difference between CTL and ATL, i.e., TSB = CTL – ATL. TSB provides a measure of how much an athlete has been training recently, compared to how much they have been training historically. It can be viewed as an indicator of how fully-adapted an individual is to their recent training load, i.e., how “fresh” they are likely to be.

In the Performance Manager concept, an individual’s CTL determines their performance potential, but their TSB influences their ability to fully express that potential. Their actual performance at any point in time will therefore depend on both their CTL and their TSB, but determining how much emphasis to accord to each is now a matter of trial-and-error/experience, not science. (Really go and see more details in the original article.)

Some other interesting quotes before I tell you about my progress in the topic:

“The following approximate guidelines may prove useful when analyzing prior data: a TSB of less than ‑10 would usually not be accompanied by the feeling of very fresh legs, while a TSB of greater than +10 usually would be. A TSB of -10 to +10, then, might be considered neutral, i.e., the individual is unlikely to feel either particularly fatigued or particularly rested. The precise values, however, will depend not only on the individual but also the time constants used to calculate CTL and ATL, and therefore should not be applied too literally.”

“The optimal training load seems to lie at a CTL somewhere between 100 and 150 TSS/d. That is, individuals whose CTL is less than 100 TSS/d usually feel that they are undertraining, i.e., they recognize that they could tolerate a heavier training load, if only they had more time available to train and/or if other stresses in life (e.g., job, family) were minimized. (…) On the other hand, few, if any, athletes seem to be able to sustain a long-term average of >150 TSS/d.”

“In addition to the absolute magnitude of CTL, considerable insight into an individual’s training (and/or mistakes in training) can often be obtained by examining the pattern of change in CTL over time. Specifically, a long (e.g., 4-6 week) plateau in CTL during a time when a) the focus of training has not changed, and b) the athlete’s performance is constant is generally evidence of what might be termed training stagnation – that is, the individual may feel that they are training well, by being very consistent and repeatedly performing the same workouts, but in fact they are not training at all, but simply maintaining, because the overload principle is not being applied. On the other hand, attempting to increase CTL too rapidly, i.e., at a rate of >5-7 TSS/d/week for four or more weeks, is often a recipe for disaster, in that it appears to frequently lead to illness and/or other symptoms of overreaching/overtraining. Of course, since changes in CTL are driven by changes in ATL, this means that any sudden increase in the training load (e.g., training camp, stage race) must be followed by an appropriate period of reduced training/recovery, so as to avoid too great of an overload.”

So now that I have all my rides processed with my python script (even the indoor ones, so really all cycling workouts), I only had to write a script which grabs the TSS values from every statistics file (then calculates daily values if there were more rides on a given day), calculates the ATL, CTL and TSB values for every day in the given period, and plots them (plus saves the data as a table). This was not too hard ;) There is even an option to change the default time constants in the parameter file (the same parameter file which is used by the workout analyzer and plotter script), and to define a start date and end date for the plotting in the command line. Then after giving the

>python plotgarmintcx_makePMC.py 20101201 20110920

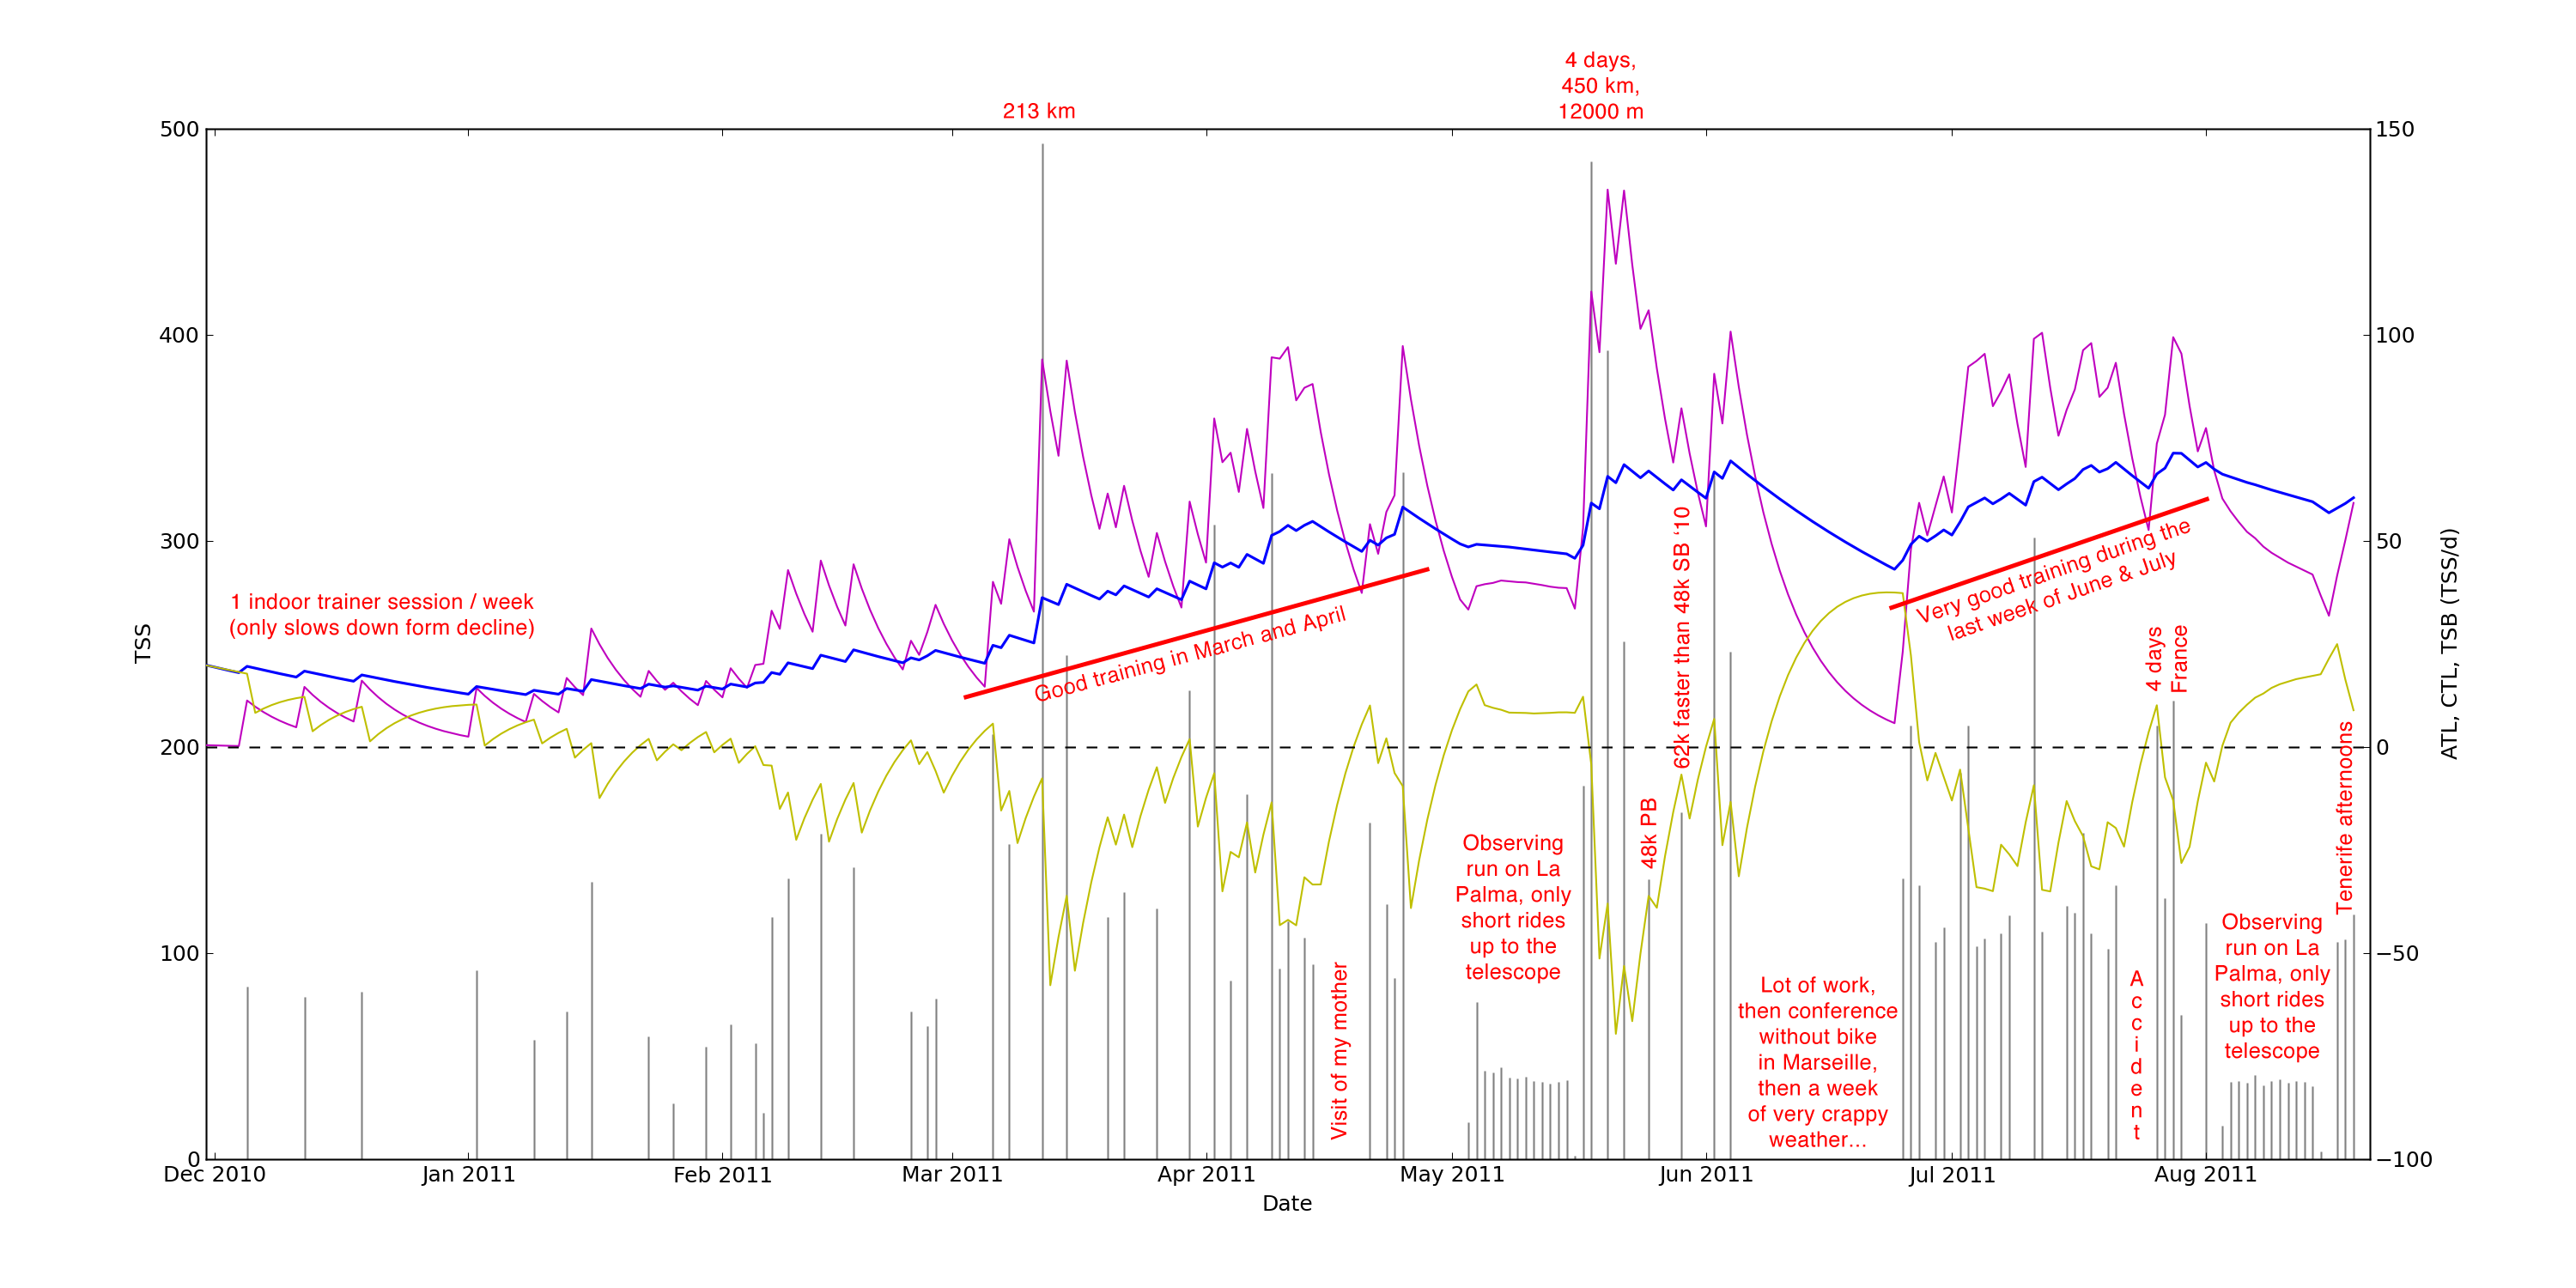
command (where the dates are optional and only affect the plotting limits, while the calculations are always done using all the data), you have your Performance Management Chart plotted and all the data saved in an ASCII file too. Let’s see how the result (with some additional comments photoshopped over in red) looks like (click and it will be bigger)!

You can see that I came into the season with some residual CTL (in blue) from last year, but one 1 hour trainer session per week was not enough to keep that on a steady level… Then as the spring was exceptionally warm and sunny I had some quite good trainings in March and April raising my CTL from 20 TSS/d to 55 TSS/d, which then dropped because of no training and very low training load during my observing run. Then the four hard days of cycling on La Palma gave a huge amount of training load (ATL in magenta), my CTL jumped from 45 TSS/d to 68 TSS/d, but my TSB (in yellow) fell to -87 TSS/d, which is extremely low, if you keep riding there then the chances are high that you will get an injury… It also resembles well that I was extremely tired after that week… Then, only after two days of rest, with a still pretty negative TSB I rode my personal best on the standard Leuven-Mechelen-Leuven route. Probably I should have waited a bit more, because another 4 days later I did a ride where I easily had a better average speed on 62 kilometers than my personal best on 48 kilometers from 2010. I was extremely surprised about my performance on that day. It is not such a surprise anymore when you look at this plot. My CTL was still very high, and as I was resting a lot in the days before, my TSB became almost zero. This is the perfect combination (high CTL, zero or slightly positive TSB – remember, actual form is a combination of fitness and freshness) for record breaking rides (or races), this is an example of a sweet spot on the Performance Management Chart. Unluckily after this really good period I could not ride for almost three weeks (work, work, and weather…), which had a huge impact on my CTL (dropping all the way down to 43 TSS/d). From this point, I started a quite systematic and serious training, as I wanted to finish July with at least 1000 kilometers. You can see that my ATL is almost always above my CTL, which leads to the increase of CTL. Then I crashed into a car just days before I was about to climb the Mont Ventoux, which gave me some time to rest (and a bit if pain in my right knee, which is missing from this chart…), so again I had a high CTL and an ~zero TSB when I went to France. And I was again very surprised how easy the first ride felt there, especially after an accident. But now from this chart, it is not so surprising anymore. My TSB was still only -13 TSS/d when I climbed the Mont Ventoux, so it was close to optimal, but I could have done better with a bit less riding on the first two days in France. It was also the day of my highest CTL with 71.3 TSS/d this year (till now). Then during my observing run, it dropped again (to 57 TSS/d), so now I am working on getting it back up to the region where is should be :) Next year I want to be at 100 TSS/d at this time. At least. Especially if I am serious about my plans for the summer…

As a conclusion, I think it is a very nice visualization and an extremely useful tool for a cyclist!

Estimating cycling power and training load

Updated 1: I modified the script slightly to perfectly match the estimation method of Joe Friel (see below), and as this had a small but clearly positive effect on the results, I have also updated the last plot and the paragraphs describing it at the end.

Updated 2: I have also tested the power estimate on very low intensity efforts with known average wattages (check out the bottom of the post).

You might remember that I have written a python script earlier this year, to analyze my cycling workouts and besides the calculation of detailed statistics, also create all kinds of fancy (multidimensional) plots. If you do not remember, or you would like to refresh your memories, please click here before reading this post further.

The most important thing missing from my script was the ability to directly compare different workouts. Of course you can tell that a 150 km ride with 5000 meters of elevation gain is more difficult than an easy 50 km Sunday afternoon ride, but how much more difficult? And what about an easy 75 kilometer training and a short but hard interval session? How do these compare? How tired am I going to feel myself after these? I really wanted to create or find a metric which tells me how much I did on a training. Of course this is only a problem when you don’t have a power meter installed on the bike, because that would directly tell you the amount of work in SI units for every workout. But power meters are expensive, and most importantly I don’t have one. This situation might change in the future, but till then let’s see what can we do.

I kinda forgot about the problem (and I did not even start dealing with it earlier, I just simply made a note on my To Do list), but some days ago Strava (a similar site to Garmin Connect, but with competitive – social media based – extras, unluckily with basically no users in Europe, so it is not an alternative for me) introduced a so called suffer score on their website, basically giving a rating to every ride based on its intensity (estimated from heart rate – HR – data) and duration. I knew that the algorithm behind this will be quickly decoded on one of the blogs I frequently read, and indeed it did happen very quickly, go and have a look there. First I wanted to implement this into my script, but then I got some extra motivation from the post and the comments there, so I looked a bit into the literature, and thus I got to know about the Training Stress Score, or simply TSS (among others, but this is the most important thing for us right now). To save some space here, check out the following three sites, so I can skip retyping things which are already on the Internet.

Estimating Training Stress Score (TSS), by Joe Friel
Normalized Power (NP), Intensity Factor (IF), and Training Stress Score (TSS), by Andrew R. Coggan, Ph.D.
What does 100 TSS mean, and the connection to Functional Threshold Power (FTP)

Though TSS and all these metrics are used in and based on power measurements, you can see that it is possible to give a good estimate (as good as estimating the realtive power on climbs from the slope gradient and VAM, which my script already did before) of it from time spent in HR zones using the scaling values from Joe Friel. We have seen that by definition a TSS of 100 equals to a one hour ride at FTP (so as hard as you can go for one hour). This means that rides shorter than one hour can have a TSS/hour higher than 100, but longer rides will have a lover value. So the TSS value tells you how big the training load of a given ride was (and it is related to the amount of post-ride fatigue), and the TSS/hour value gives you the intensity of your workout. The way it’s calcualted, TSS varies by the square of intensity. That means if you’re only going at 90% for an hour then you’re only accumulating 81 TSS per hour (90% = 0.9, which squared is 0.81, then you multiply by 100 to get TSS). So from the TSS/hour you can calculate an intensity factor, which gives you your average power output in units of your FTP power for the whole workout. Given that you know your FTP power, you can have a good estimate of the average power of any of your training rides! Now that is pretty cool. So that is what I have built into my script, this way now the TSS, TSS/h, average power and total work estimate values are also given in the summary file. And I also performed some test calculations and comparisons – because you should never forget, these are estimates! You need to know your FTP, and your HR at FTP, and then you might even get a reasonable value…

First of all, I wanted to see what is the intensity factor of my personal best ride to Mechelen and back. It was an approximately 1 hour 20 min all out effort, and the script gave an intensity factor of 1.00, meaning that I was riding on FTP. Though the ride was a bit longer than one hour (when it should not be possible to ride on FTP anymore), but I had a small 10 min break between the two legs in Mechelen, so it might still be a valid approximation, but for sure it should be extremely close to reality. Also, though it was a very tough ride, because it was short, the TSS value is ‘only’ 135.0, meaning that in 24 hours I might have probably almost fully recovered. In comparison, a normal ride (in my terms, so an average of 32 km/h instead of the record 35.7 km/h) on the same route gives a TSS around 110, while a recovery ride is probably below 100, and my epic ride (147 km and a bit more than 5000 meters of elevation gain) climbing twice up from sea level to the highest point of La Palma had a TSS of 483.7, which – as you have already guessed it probably – is in the epic category. Just as comparison, the last short  (46 km and 400 meters of ascent) and recovery paced ride from France had a TSS of 69.5 (which is approximately half the TSS of my personal best ride which was done on an almost equally long, but completely flat route, so this really shows how easy this French ride was). So as I got an IF (intensity factor) of 1.00 on a ride which is very close to the definition of FTP I was already quite happy with the result. (If for such a ride you get something like 1.05 or even higher as IF, then that is a sign that your threshold heart rate is now higher, so you should change it accordingly in the parameter file.)

As a second test I wanted to see how does this power estimate compare to the power estimate from VAM and average gradient, which is a widely accepted and used relation for climbing sections. If the power values from the two methods match, then it is OK to use the power estimate from the hourly TSS value on rides even with no climbing at all. So first I took my recent ride up to the Mont Ventoux, where I did 1 hour and 40 minutes of all out riding, so I expect to get an IF around 0.95 and of course I am very interested to see how the two different power estimates will differ from each other (if they will differ at all). So here is the statistics file (recent additions marked with a grey background):
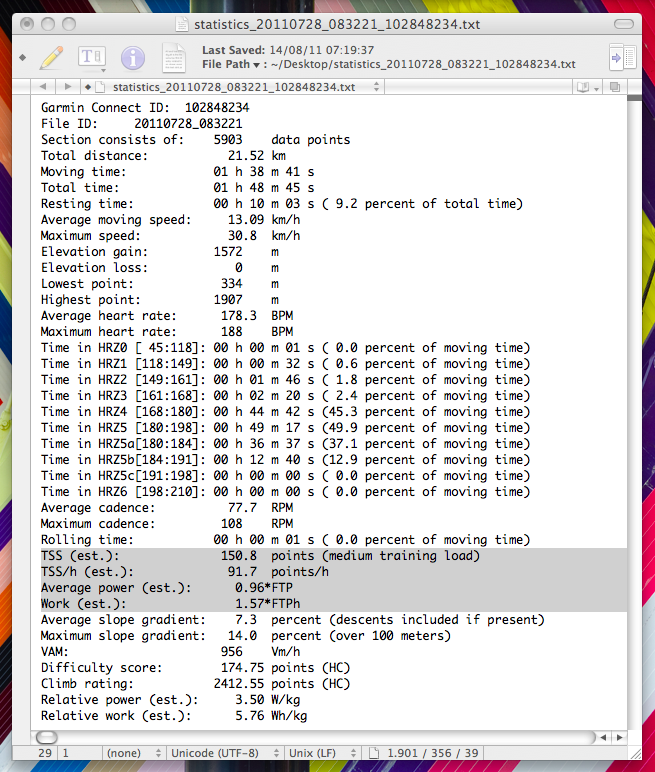
So from the IF of 0.96 you can see that indeed I did all I could in this time frame. Now we can estimate the average power from my FTP, which is somewhere around 300 W (or maybe a bit more, but I have to admit I don’t have a recent measurement, so I can only guess this from my workouts on the trainer back in the first months of the year). The result from this is 288 W. What about the value from the other method? I was ~70.5 kg and my bike + drink and food + clothes is an extra ~11.5 kg, then with a total weight of 82 kg and the relative power estimate from the VAM and gradient you get an average power of 287 W. These values are surprisingly almost perfectly identical! This means that I can most probably trust the TSS based method, and use it for complete rides, while the VAM and gradient based method only works on climb sections. This is quite nice! Of course one measurement is not a measurement, so I wanted to check this on other climbs as well. Unluckily I don’t have to many climbs (as Flanders is pretty flat), but I still managed to put together a sample of 18 climbs from this year, mostly from my rides on La Palma in may, and some others from later (so there is a chance that my FTP was not the same at the time of the different rides, but I still calculated with the same value, while for my total weight – with equipment included – I could make small changes based on me having a backpack with 2 extra liters of water or not). The sample has climbs from short explosive hills to the long ascents of La Palma, steep climbs and not so steep climbs, climbs where I was really fit and well recovered, and also climbs where I was tired, to see what is the effect of these on the relation. So all these climbs are displayed on the plot below (the size of the circles is related to the length of the climb, while the colour resembles the steepness).
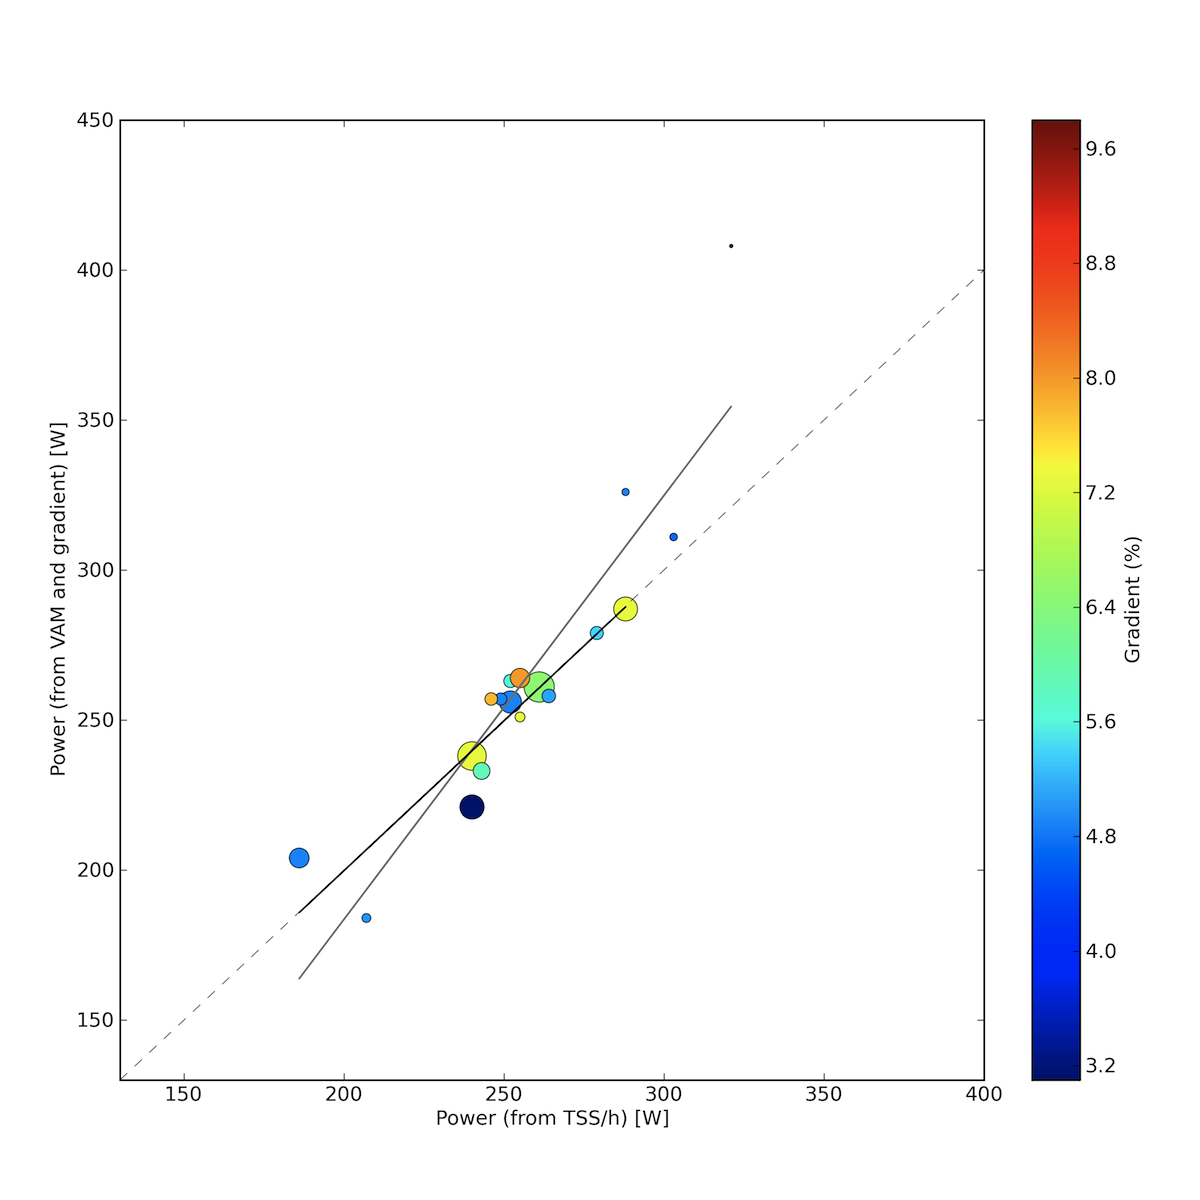
With a perfect 1:1 relation between the two different power estimates we expect the climbs to fall on the x=y linear (which is the grey dashed line here). The correlation is well visible, with of corse some noise, but the trend seems to be pretty clear. The biggest outlier is the Smeysberg on the top right, which is a very short (430 meter) but very steep (an average of 9.8%) climb, and the reason why it is an outlier is that it was a sprint effort well above threshold, but starting with a very low heart rate, so it took some time till my HR got up into the regime which really corresponds to the level of my power output, and this time was in the order of the full length of the effort, so of course the TSS based metric is lower. For such sprint efforts the heart rate based estimated TSS will be always lower than the power based, because 1) the already mentioned lag of HR behind the sudden raise of power output, 2) that much above FTP the HR will not get higher, it does not matter if you maintain 400 W or 600 W for 30 seconds, your HR will be probably stuck at you maximum HR value. But these problems only arise when you do very short above threshold sprints. This is also why one of the small blue dots is also a clear outlier. Still, in the region where most of my training rides are (~220 W to 300 W) the match is almost perfect. Fitting a linear [y = f(x) = mx + b] to all the climbs (solid grey line) or only climbs which were longer than 3 km (a.k.a. efforts where there was a significant heart rate lag were dropped, thick black line) gives the following equations:

a) m = 1.41±0.16, b = -99±41, but we don’t really care about this
b) m = 1.00±0.12, b = 0±31, which is a perfect 1:1 match (with some noise of course)!

The other problem with HR based power estimates, that your heart rate at, e.g., 250 W will not be the same for two workouts which were ridden in different conditions, as for example dehydration and the level of residual fatigue strongly affects the heart rate. So again, these can significantly change the resulting estimated power. Like in case of the medium sized light blue circle slightly above the 1:1 line in the bottom left – this was a very slow paced ride (I was not alone), but I was extremely fit (after more than 1000 km ridden already in the same month, but basically no hard workouts in the previous one week), so probably my heart rate zones were a bit shifted. On the other hand, the two other climbs where the difference between the two values is larger than 5% (the small blue circle and the larger dark blue circle slightly below the 1:1 line towards the bottom left) were the last climbs of my two hardest days on La Palma, so at those ascents I was already very tired, which led to the shift of my HR zones – but now to the other direction. (At least this is my explanation.) Furthermore, small ascending sections can effect the estimate from overall VAM and slope gradient, and to convert relative power to power you need to know your total weight with bike, clothes, and everything included. Taking all these factors into account it is easy to understand why there is a scatter around the 1:1 relation.

To see what happens when you go to lower power – so the region of true recovery workouts – I have modified the script to be able to handle TCX files which do not contain GPS position information (so files which contain indoor trainer workouts). I have only three rides where I maintained a constant power instead of doing intervals (where the heart rate based method is clearly off, but we know that already), but in case of these, I can compare the ‘real’ average power (from the Tacx Flow) to the estimate. So for these three rides, the real average power values were 156 W, 140 W, and 200 W, while the estimates for the same rides are 133 W, 136W, and 220 W (assuming an FTP of 290 W as these were done very early in the season). The difference between the measurements and the estimates is in the order of ~10% (of the trainer values), which is OK for an estimate.

Conclusions: we can say that indeed the TSS based method can be used to estimate the average power (and workload) of workouts (even from HR data) if they do not consist of (only) short sprint efforts (so sections where there is a significant lag in the change of heart rate compared to the power output), as it scales well with another widely used power estimation method, and as it is consistent with wattage data from indoor trainer workouts (though the latter is only tested for low intensities). As a second conclusion: I really need a power meter (to test these estimates, and to have real power data, damn it)…

And oh, this was my 500th post!
Visualizing cycling workouts (a.k.a. I love plots!)

Fasten your seat belts, you are about to read one of my best posts ever. (Honestly, it is true.)

I am a bit of a nerd, there is no need to try to deny this fact. I love gadgets, I love technology, and especially, I love plots. I love if they have more than two dimensions, if there is also color or even symbol shapes or sizes used to represent a third or fourth dimension. Moreover, I love GPS devices. At the moment I have a hiking GPS (Garmin GPSMap 60 CSx), a smartphone with built in GPS, and a cycling GPS (Garmin Edge 500), and I had three other ones (two hiking GPS devices, and a bluetooth GPS receiver with my previous Nokia phone) before these… But I am not the nerd who just sits in front of the computer, because I also love sports. I mean, I love doing sports, and not just watching them on TV (which I also like, but this is not the point). If you are not completely new to my blog, then you know that these days I am especially into cycling – this is also the reason why I own a special cycling GPS (which I bought basically on the morning of my first ride with my – back then new – racing bike). With Garmin (and even with other brands), you have the option to upload your workouts to the Garmin Connect website, which gives you some nice overview plots, a calendar, reports, some statistics, and maybe most importantly the ability to share what you have done with the on-line community. The plots and statistics are nice and detailed enough if you are an average – or so called hobby – user. In that case, there is no problem. But if you are such a plot-fetishist as I am, or you need professional analysis, and you have a desire for more, than you will like what I am just about to show after the break. (If you have no food and drinks with you, go and grab something before clicking on continue…) Continue reading