Memories from the past half year

Well, keeping this blog alive beyond the occasional holiday pictures and yearly sport summaries is getting more and more difficult. Still, simply for my records, I like to quickly flip through the memories from the past few months once in while. Because I might be lazy to write, but I still like to look back from time to time, and it feels better to do it here, than on any social media platform.

Soon after our holidays in Bretagne the Belgian team finished third on the football world cup, and it was really nice to experience the daily buzz that surrounded the team progressing through the tournament. Following the traditions we had a (super serious) competition at work about predicting the scores of the games (as we have a few others each and every year, e.g., for the cycling spring classics, and the Tour de France), where I managed to grab the prestigious first spot, meaning that I actually got my name on the coveted TML Cup! This was a much needed success after my horrendous performance surrounding the spring classics…

We have been to Budapest for a week as usual, Clio got her annual portion of kürtőskalács, I read an actual book (the “new” Dan Brown, which was not as much of a let down as the previous one), and my parents were happy to just have us around. On one of the evenings I met up with a bunch of old classmates from high school, most of whom I have not seen for at least ten years.

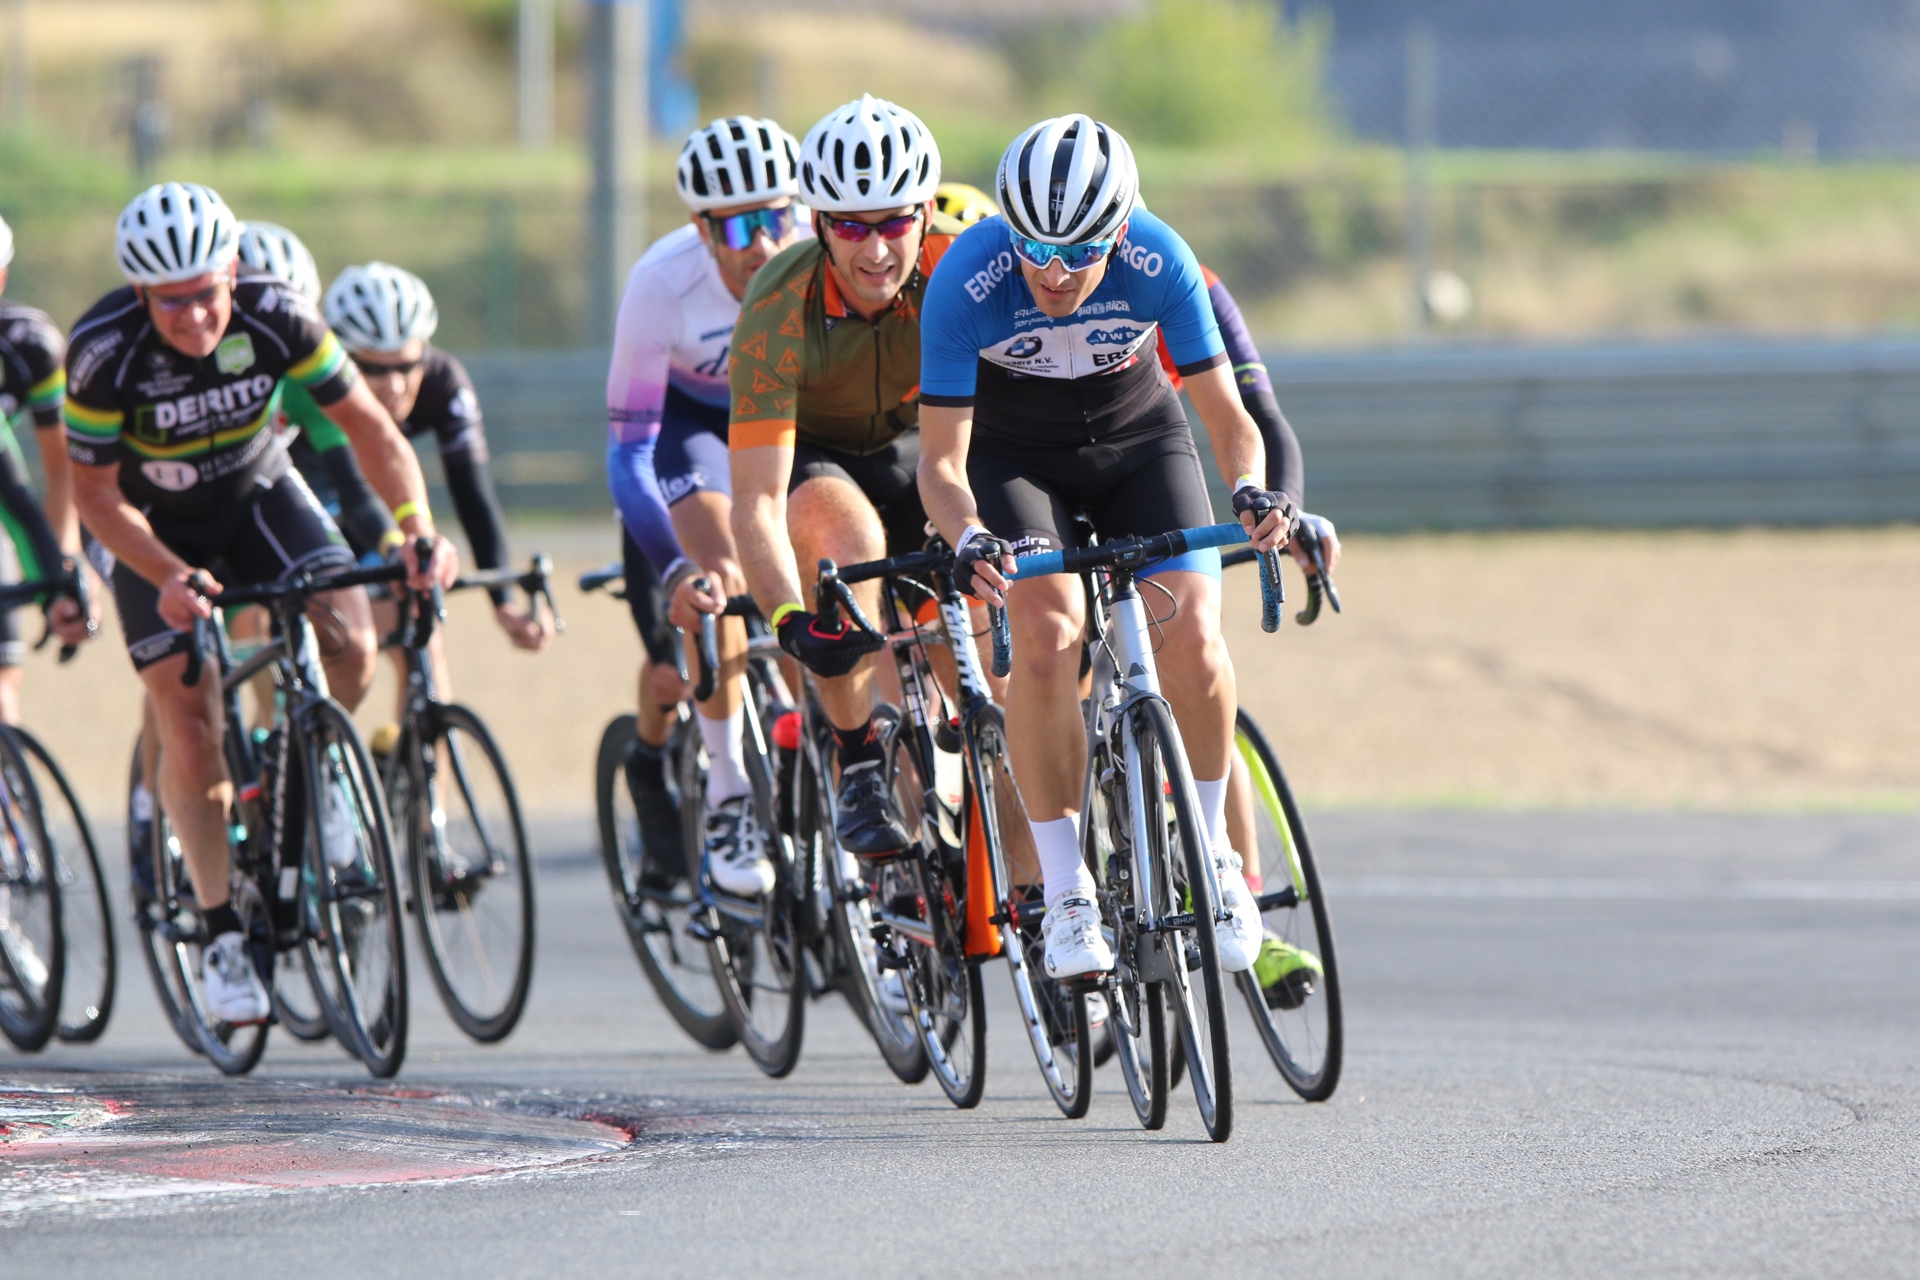
Motivated by last year’s success (and by the fact that our team was short of one person) I rode two shifts during the annual 12 hours of Zolder again, but this time I must have been lucky because my shifts were not super fast at all, therefore I had no difficulty what so ever riding in the bunch, or even coming to the front a few times. (I did it only for the pictures.) I don’t even remember our final position, but it was fun and that is all what matters.

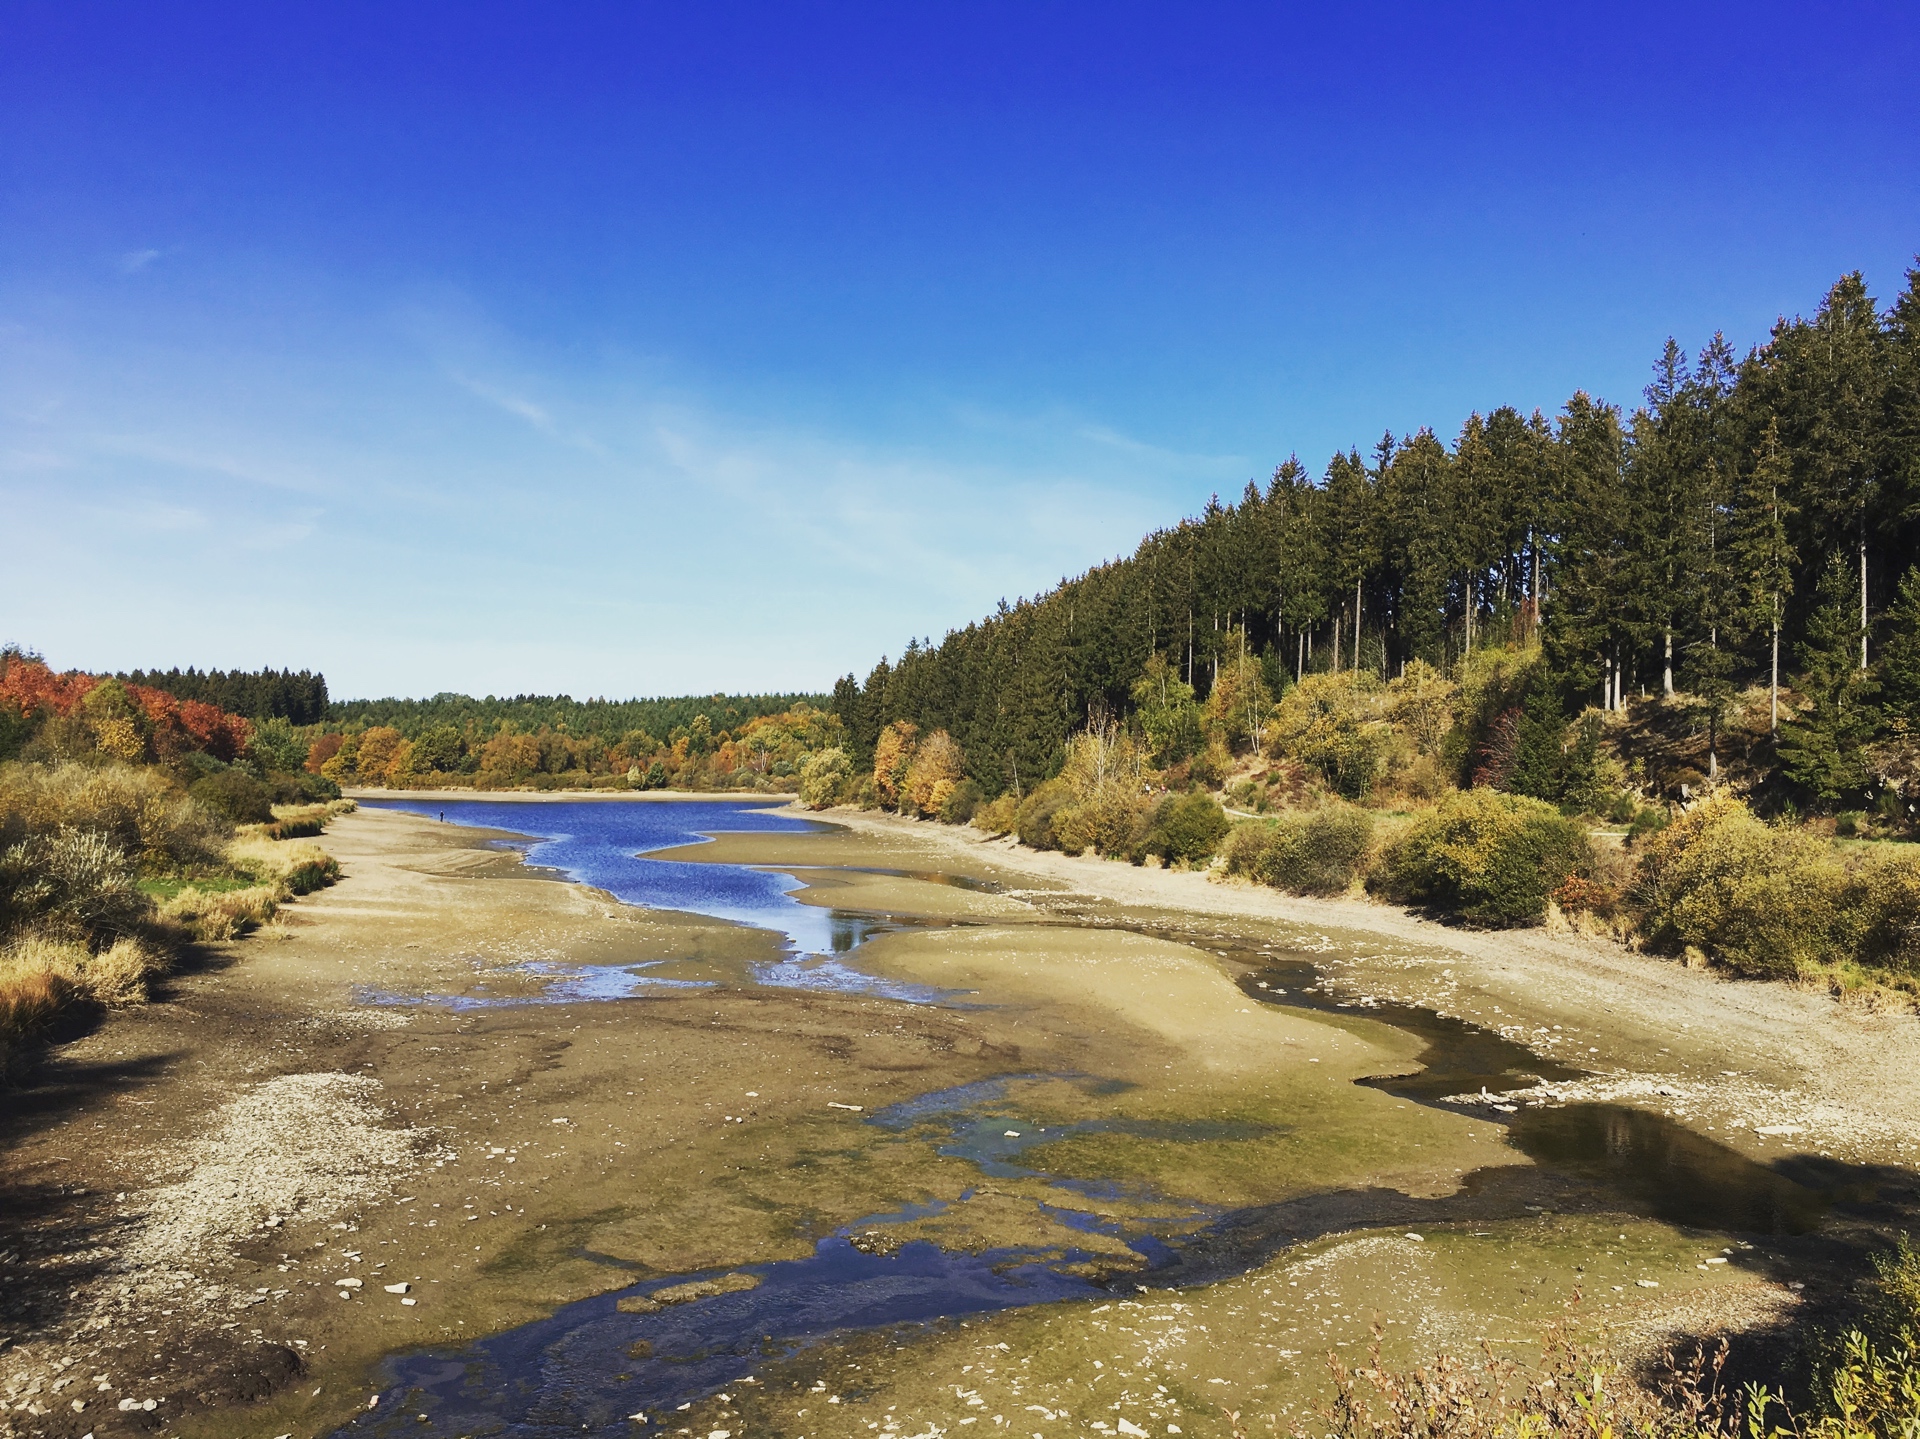
Then early September (but still in full-blown summer) we had a long weekend in the Bütgenbacher Hof in the Oostkantons, with two delicious gastronomical dinners, some walking, and a nice bike ride (where Clio joined me for the last 50 kilometres along the Vennbahn, motivated by the promise of delicious waffles, that were served at halfway point from an old train carriage). This was not my last ride in the Oostkantons, I went back once alone and once with Steven later during the sunny and warm early autumn that we had in 2018. These were some great days in the saddle.

Thanks to friendships that I made while biking, I participated in a guided tour of the Jewish quarter in Antwerp, which was really interesting. Then summer sadly ended somewhere around the last week of October, so the time of Playstation (Red Dead Redemption 2, and of course lots of FIFA 19) and Netflix arrived (Master of None Season 2 – I loved this so much I can not recommend it enough -, then just recently Sex Education was also quite nice). Liverpool is on top of the Premier League at the moment, and while it is way too early to say (especially when you are a Liverpool supporter), but maybe this season will be the one, if they manage to perform as they did so far…

Even with the less pleasant weather I kept biking, usually either before or after work (and once in the weekend), often in the dark, even in freezing temperatures (with a new negative record of -8°C). But being in shape payed off of course during the Festive 500, or last weekend when I joined a group of people for a beautiful sunny ride across (the occasionally snow covered) the Dutch Limburg and the Voerstreek. Still, it has been a few years since I have been so inactive in January :( The weather has not been that great lately, we had a lot of rain, even some snow, and my bike had to be serviced too (trashed bearings in the wheels, meaning that for the first time I actually took my bike to the Canyon service centre).

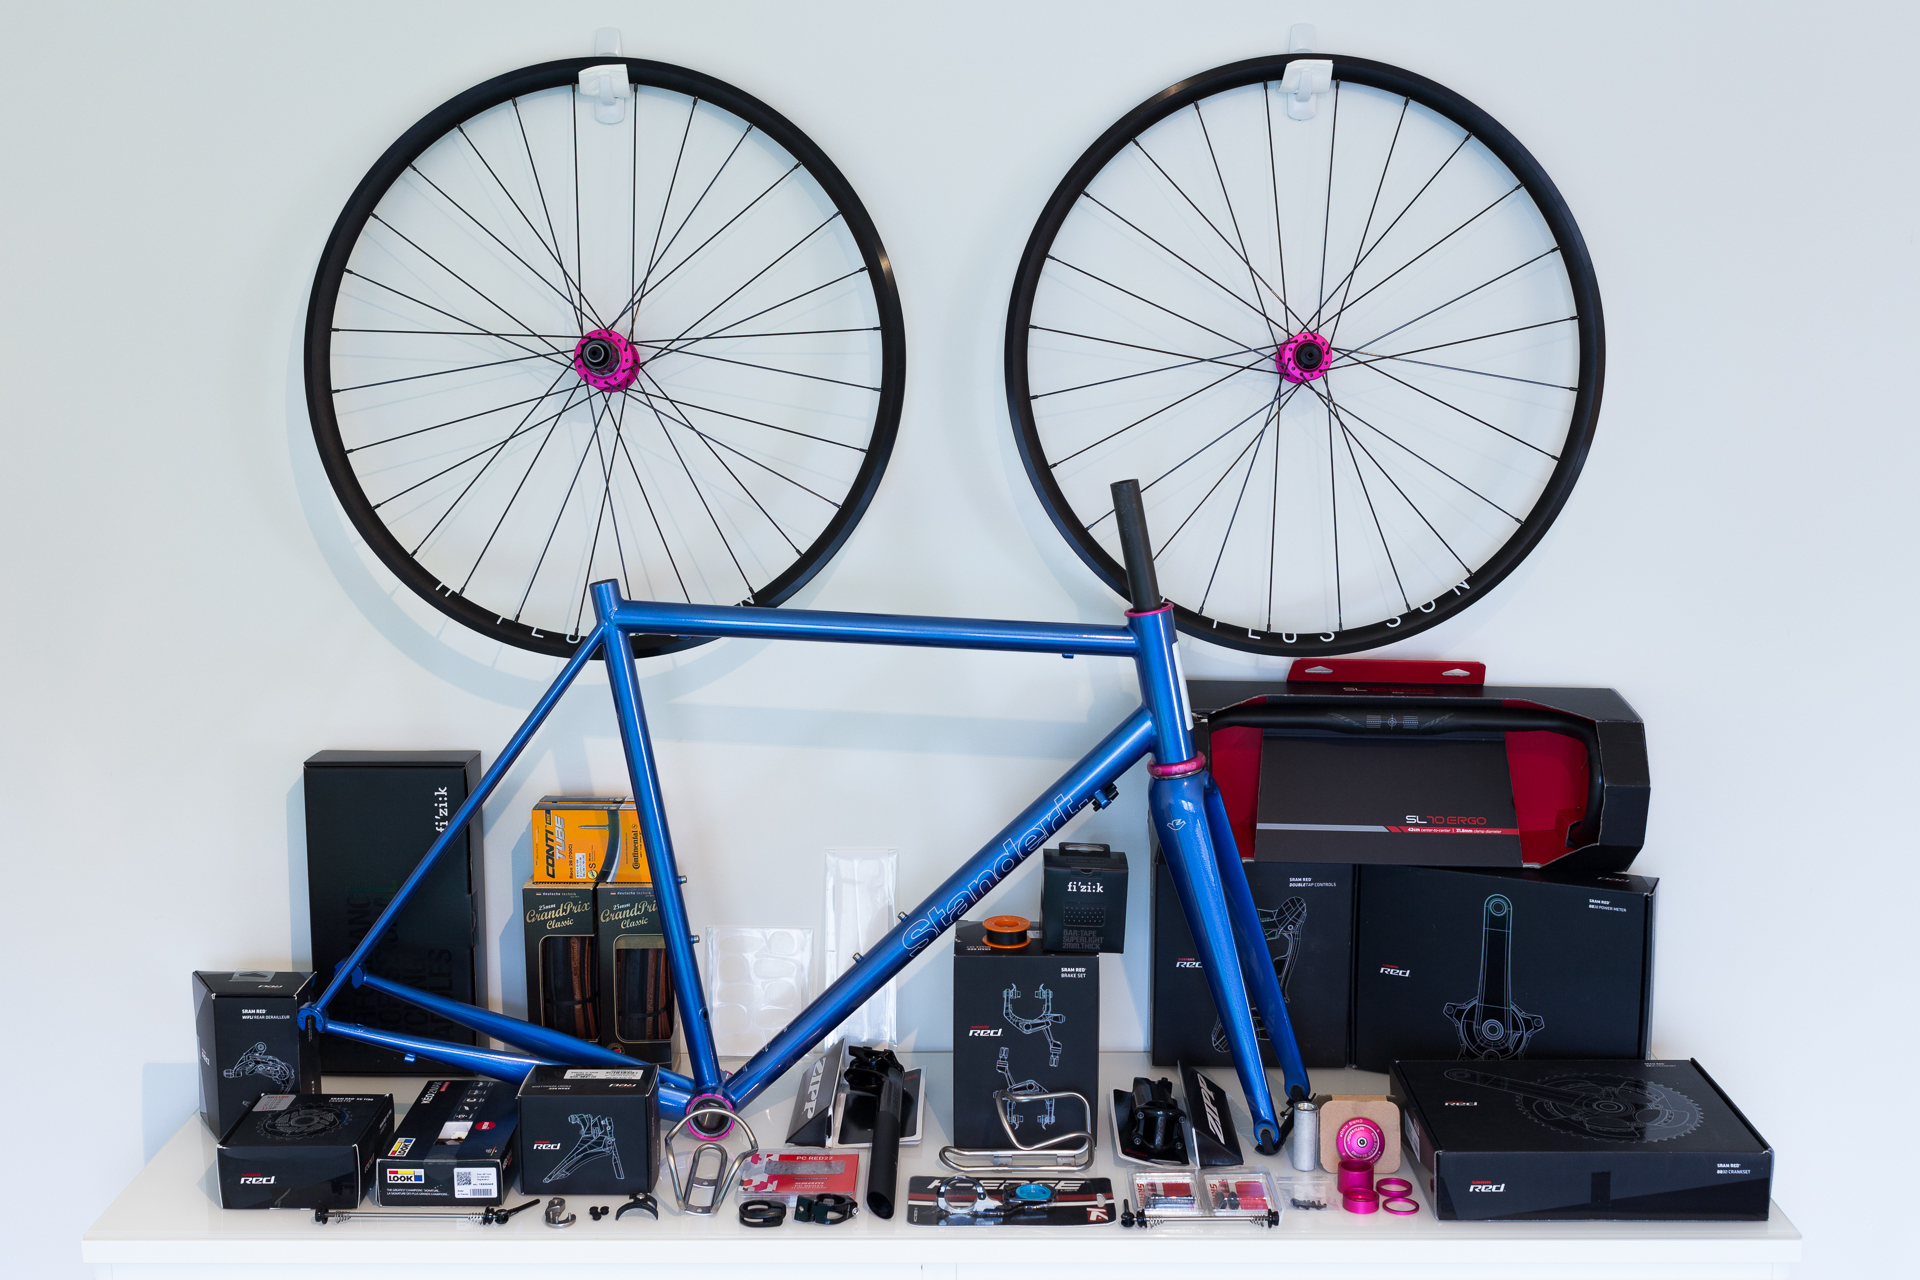
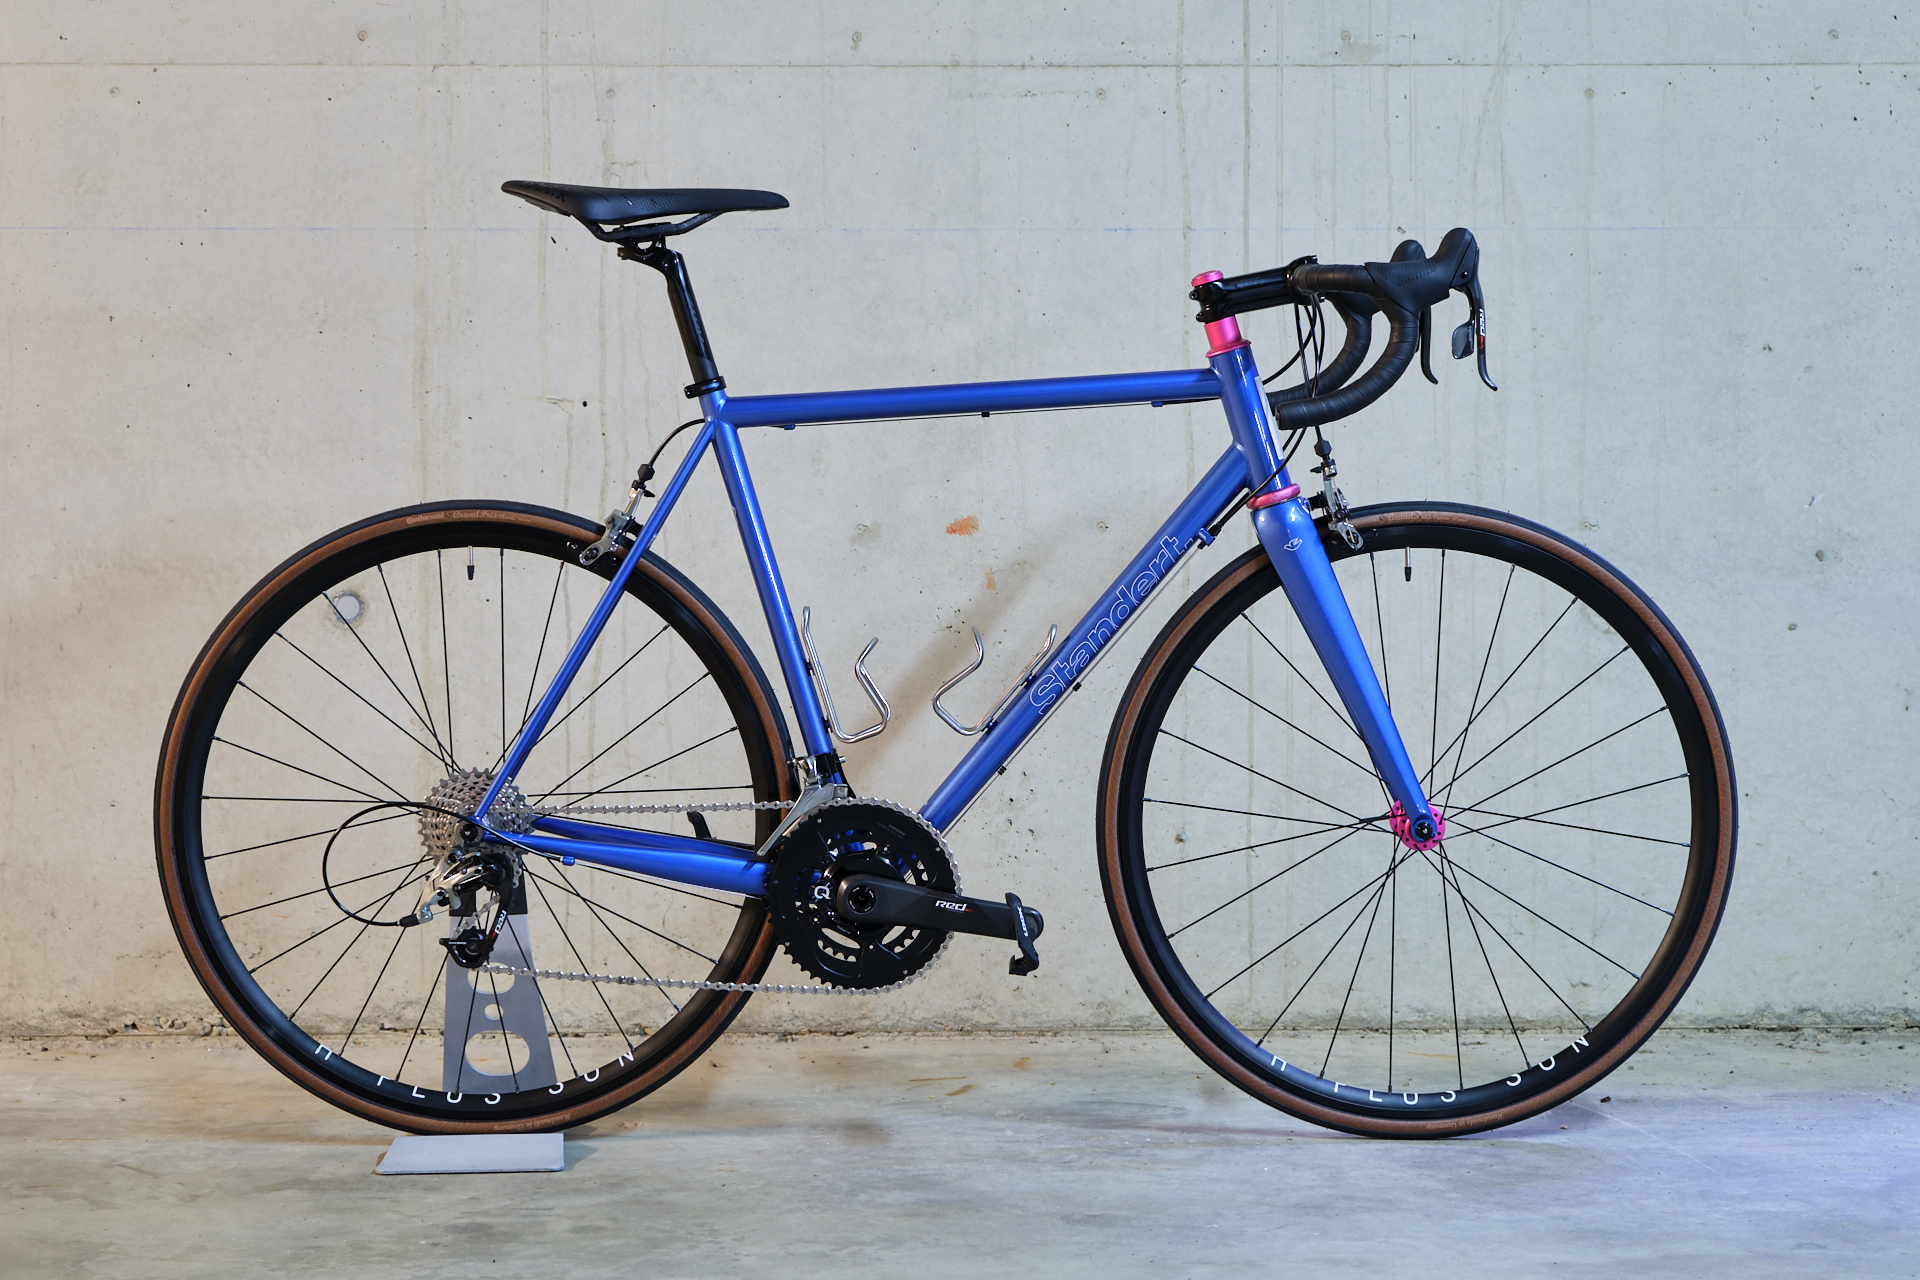
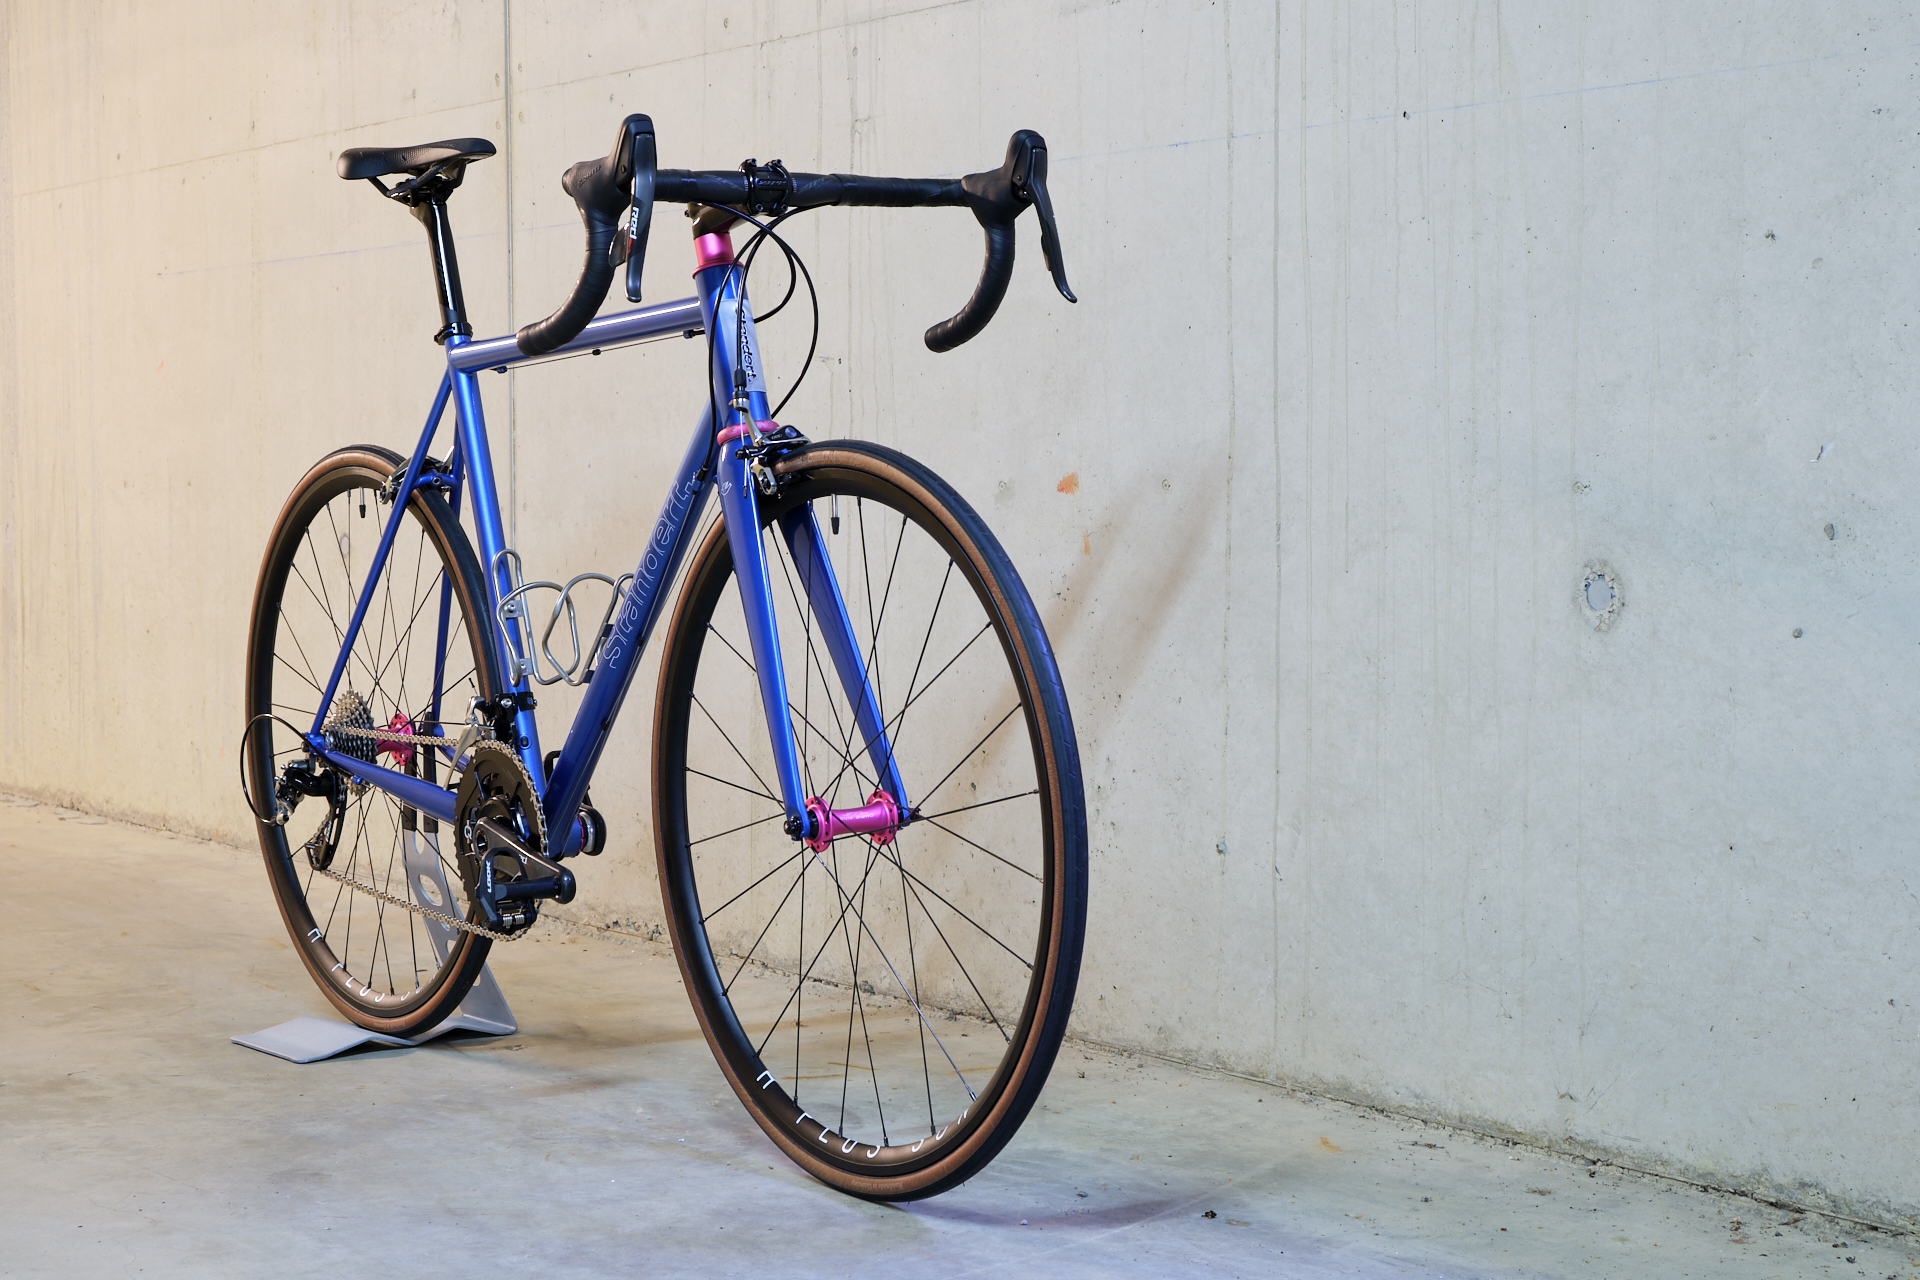
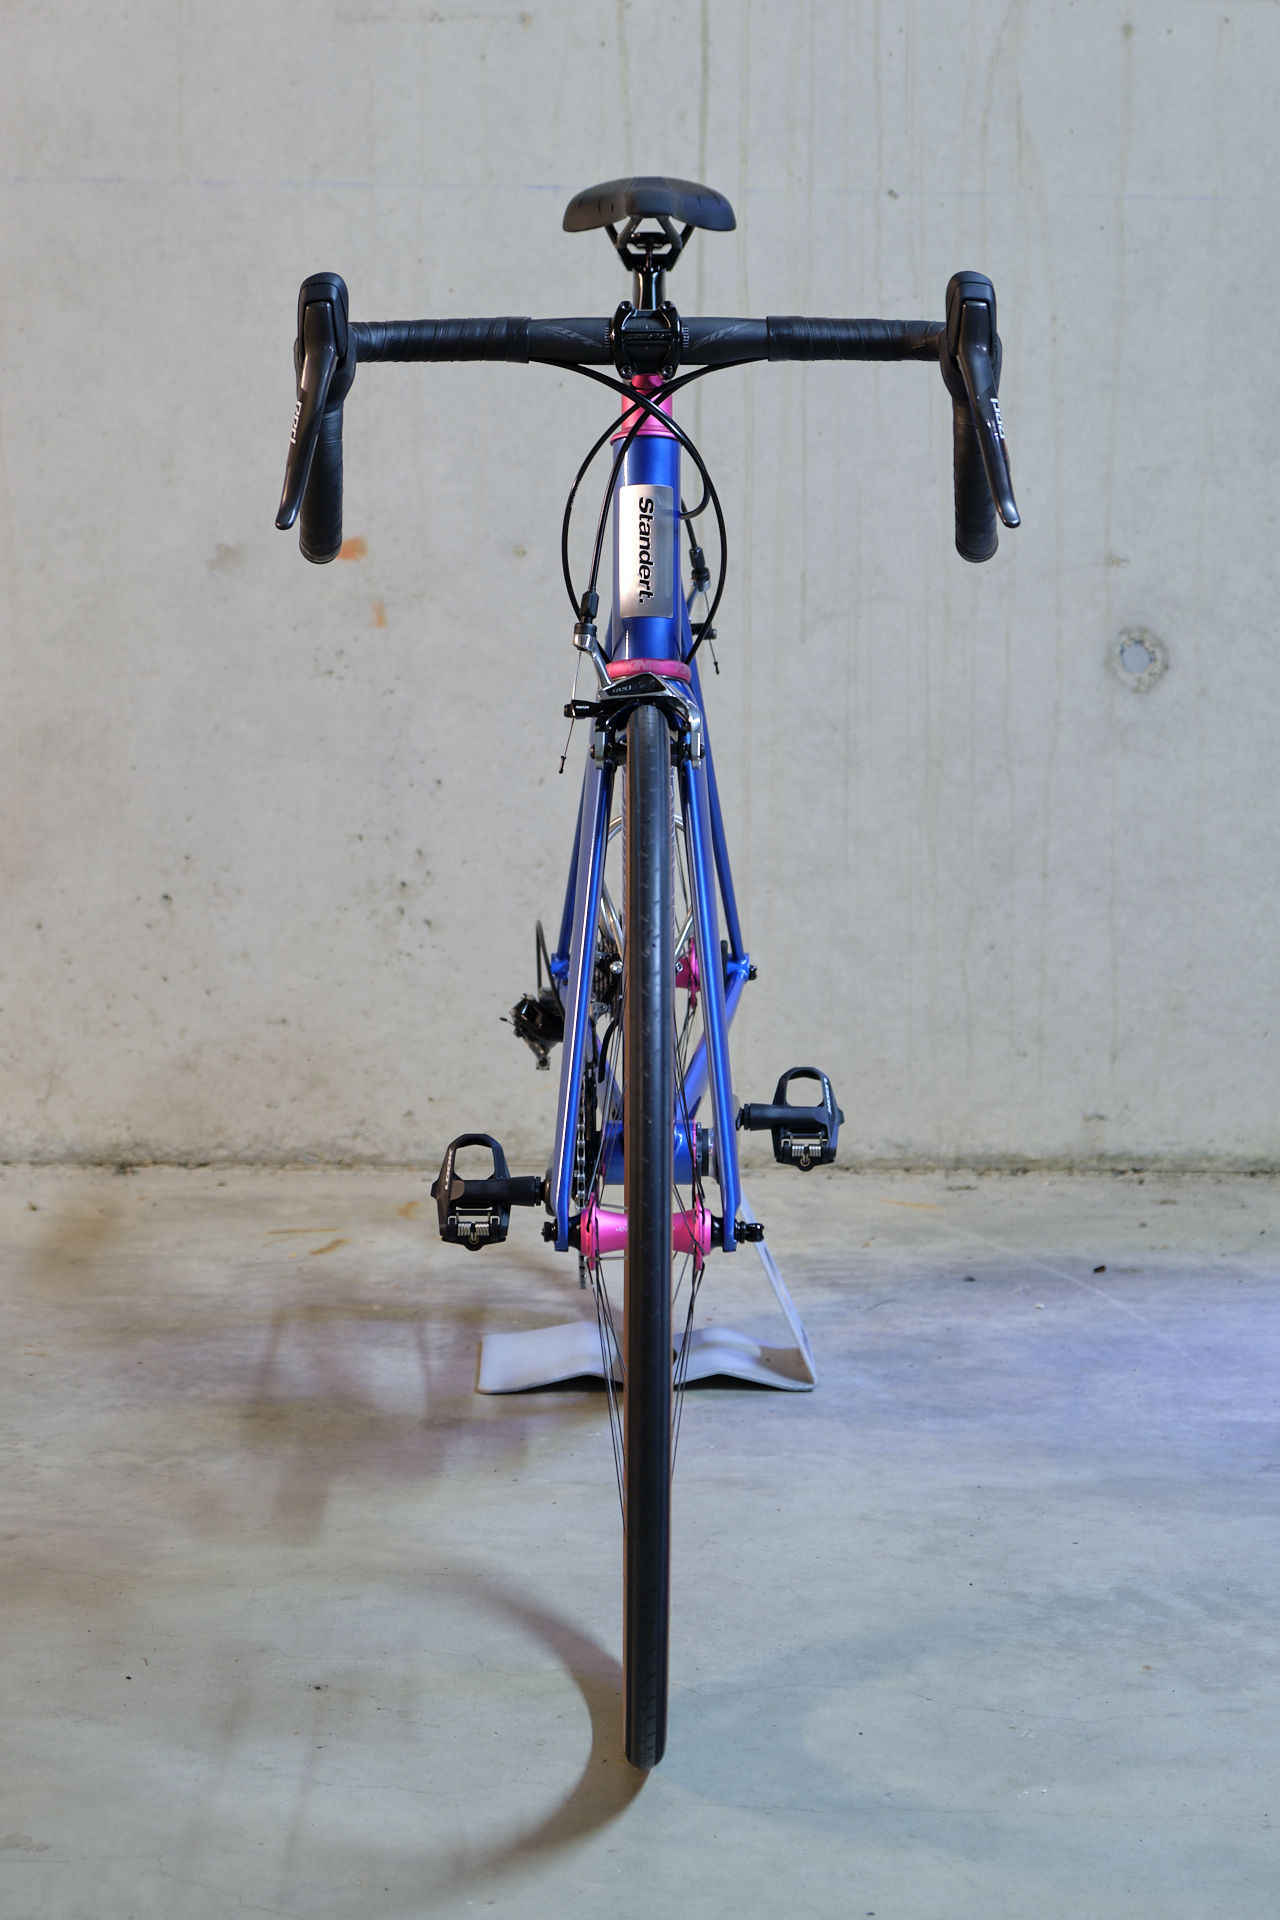
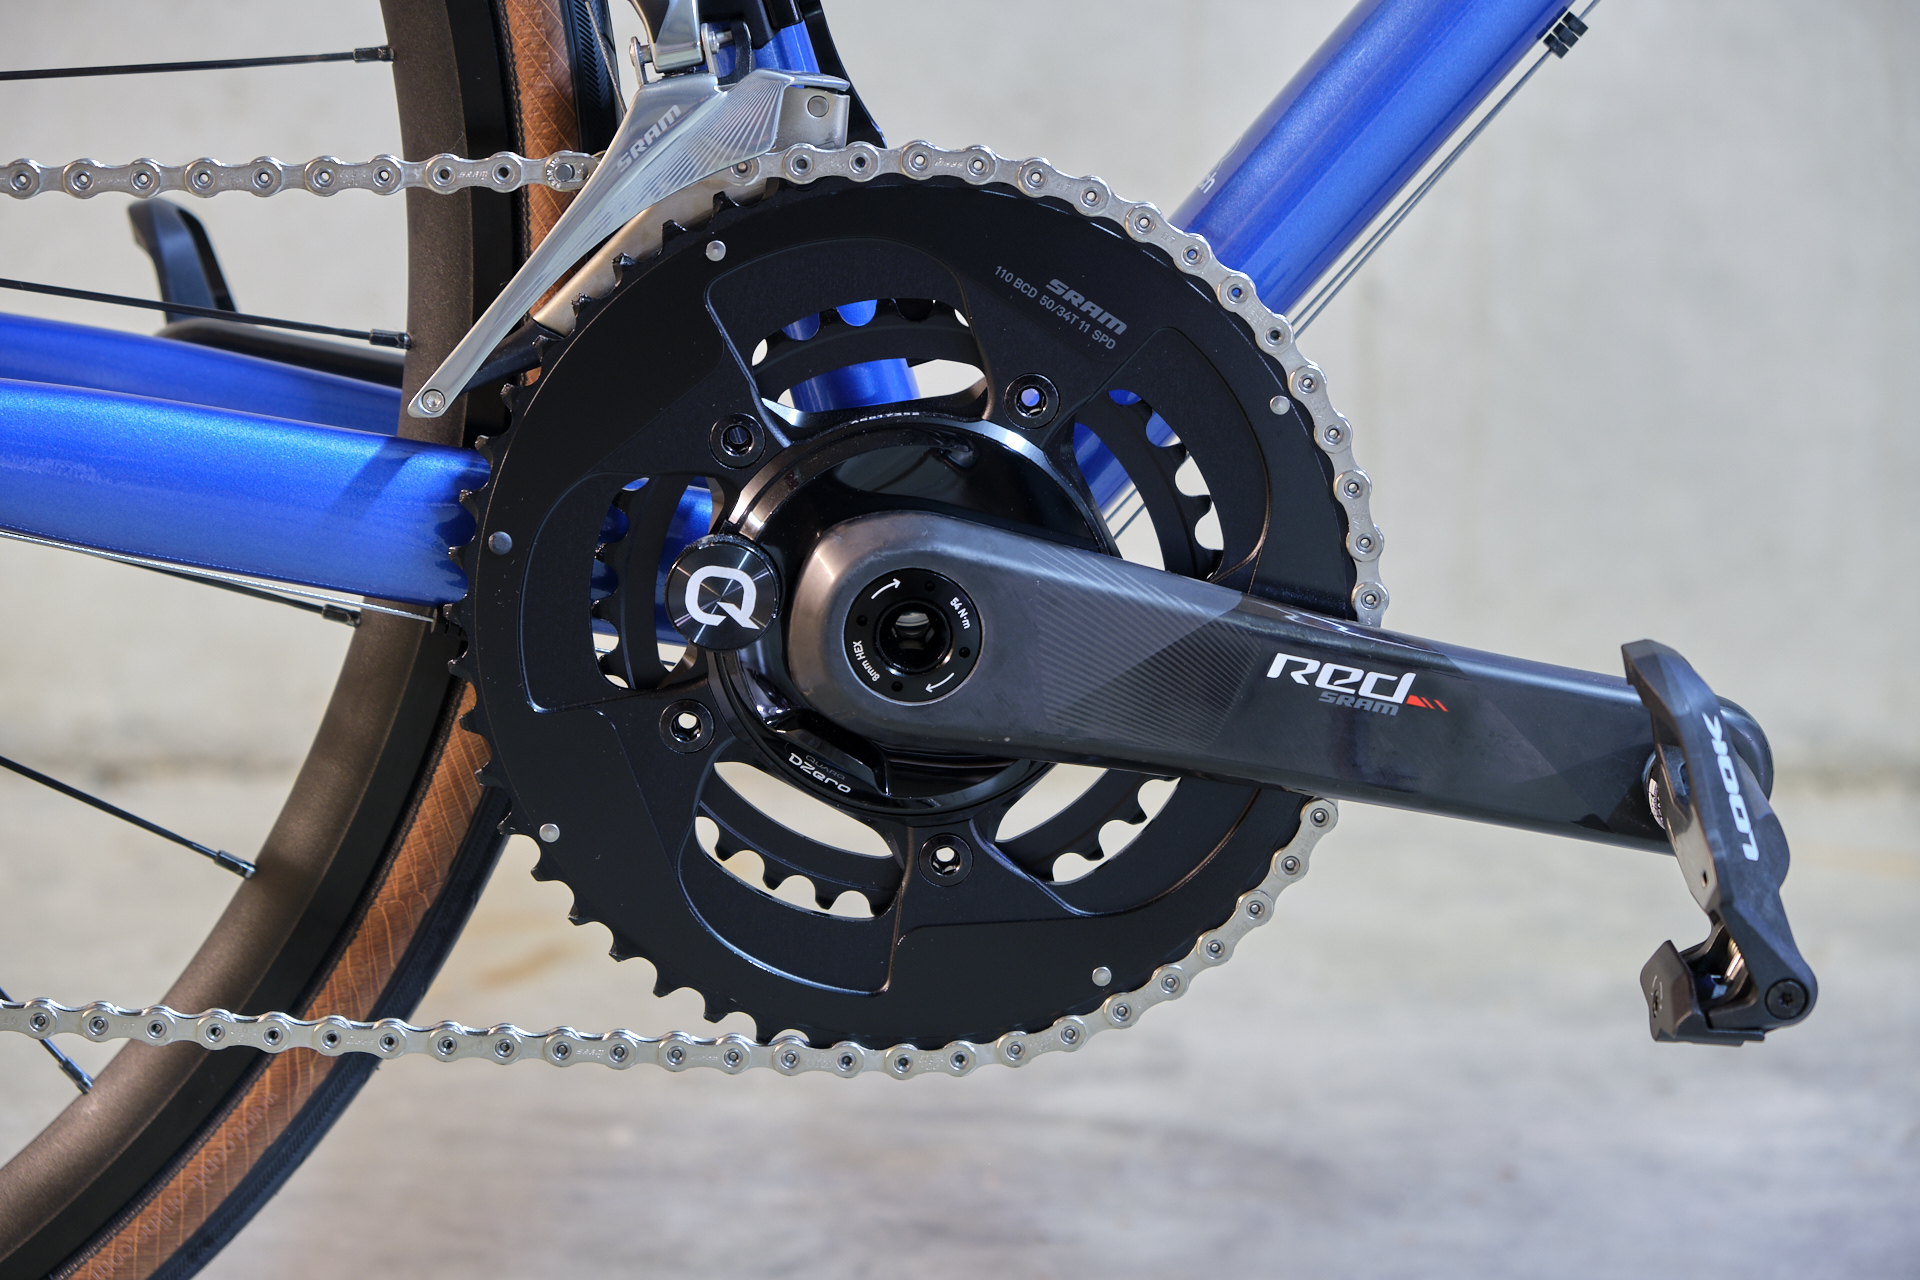
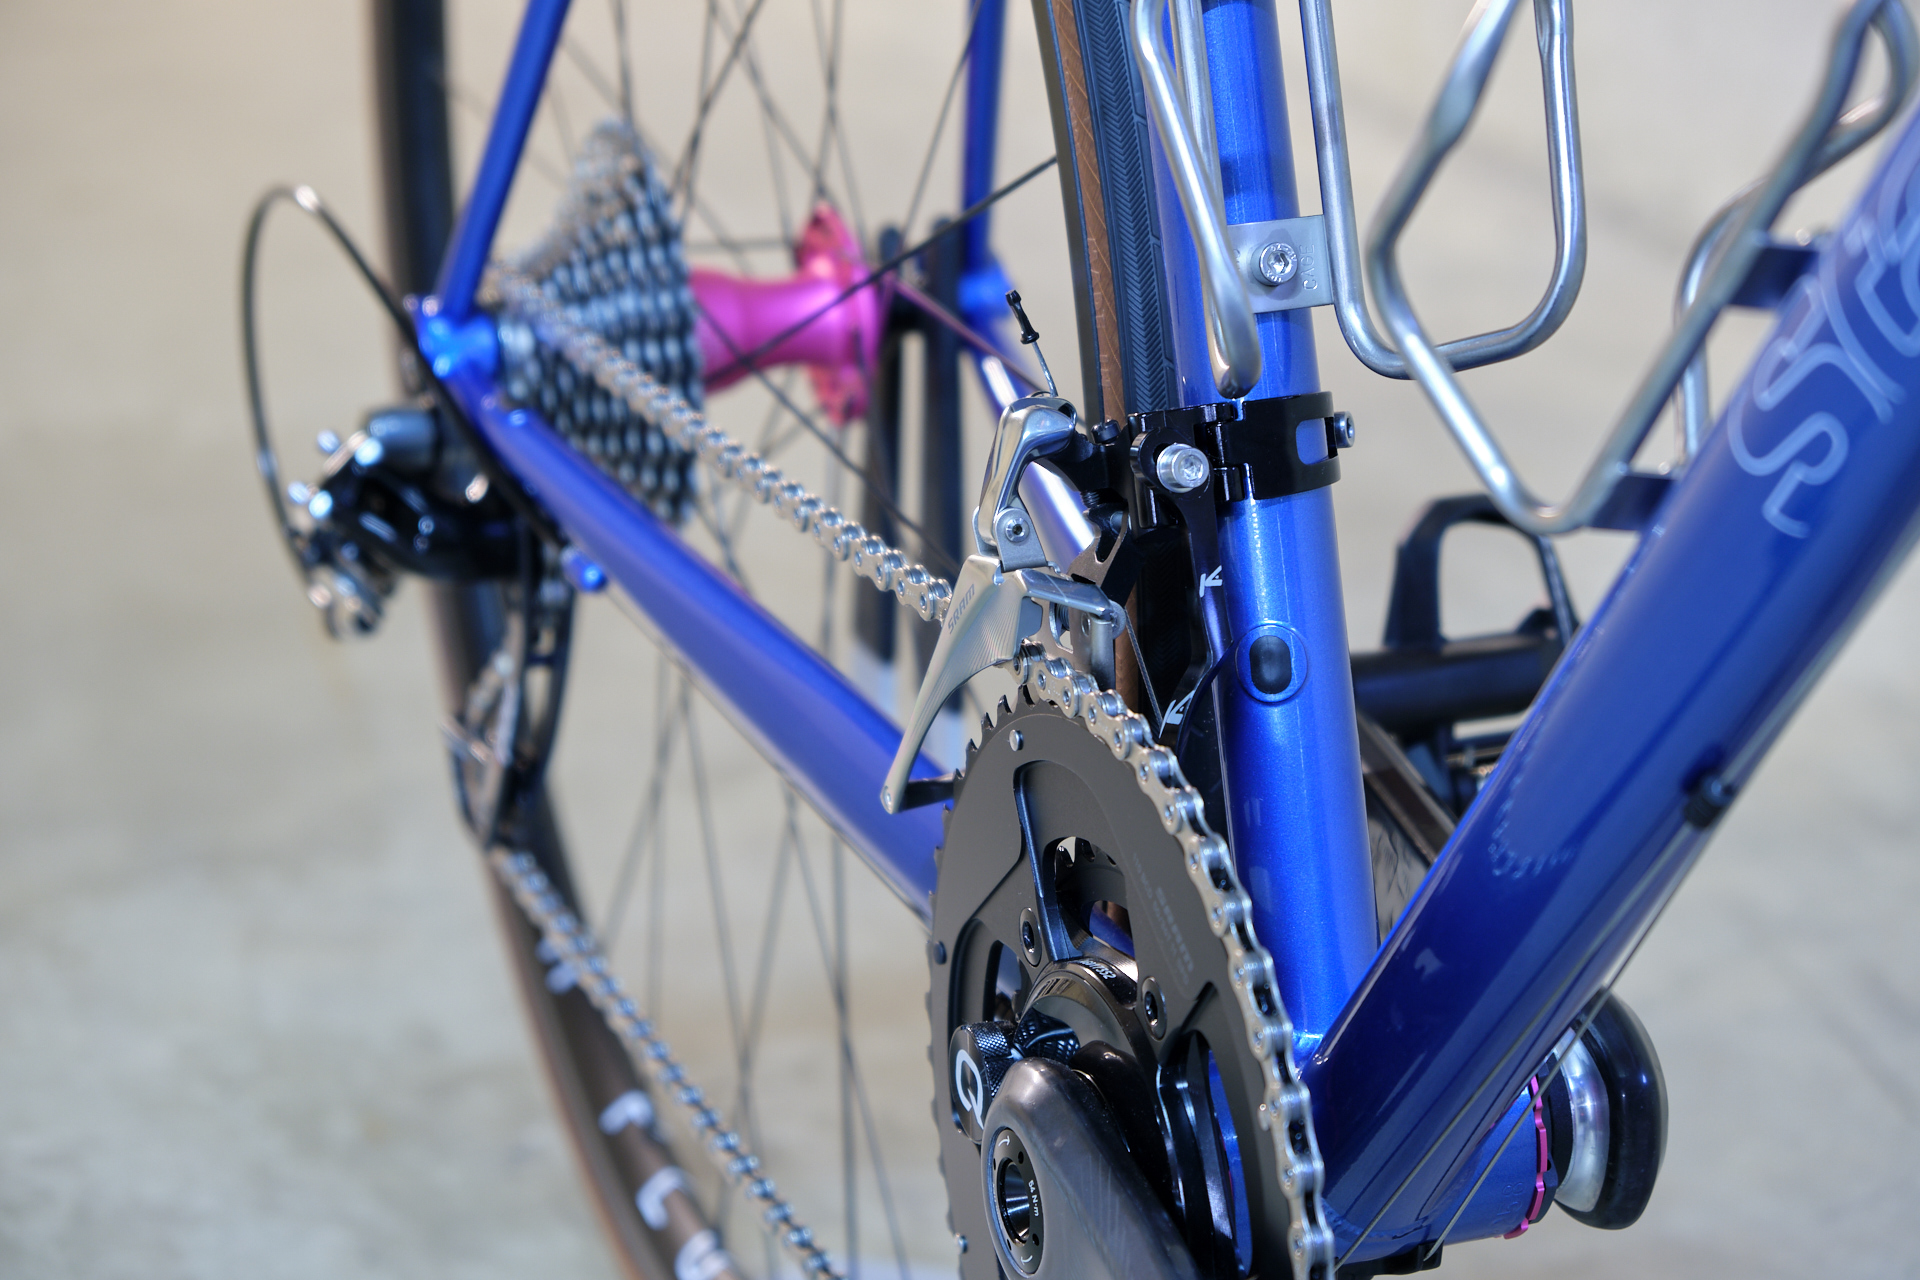
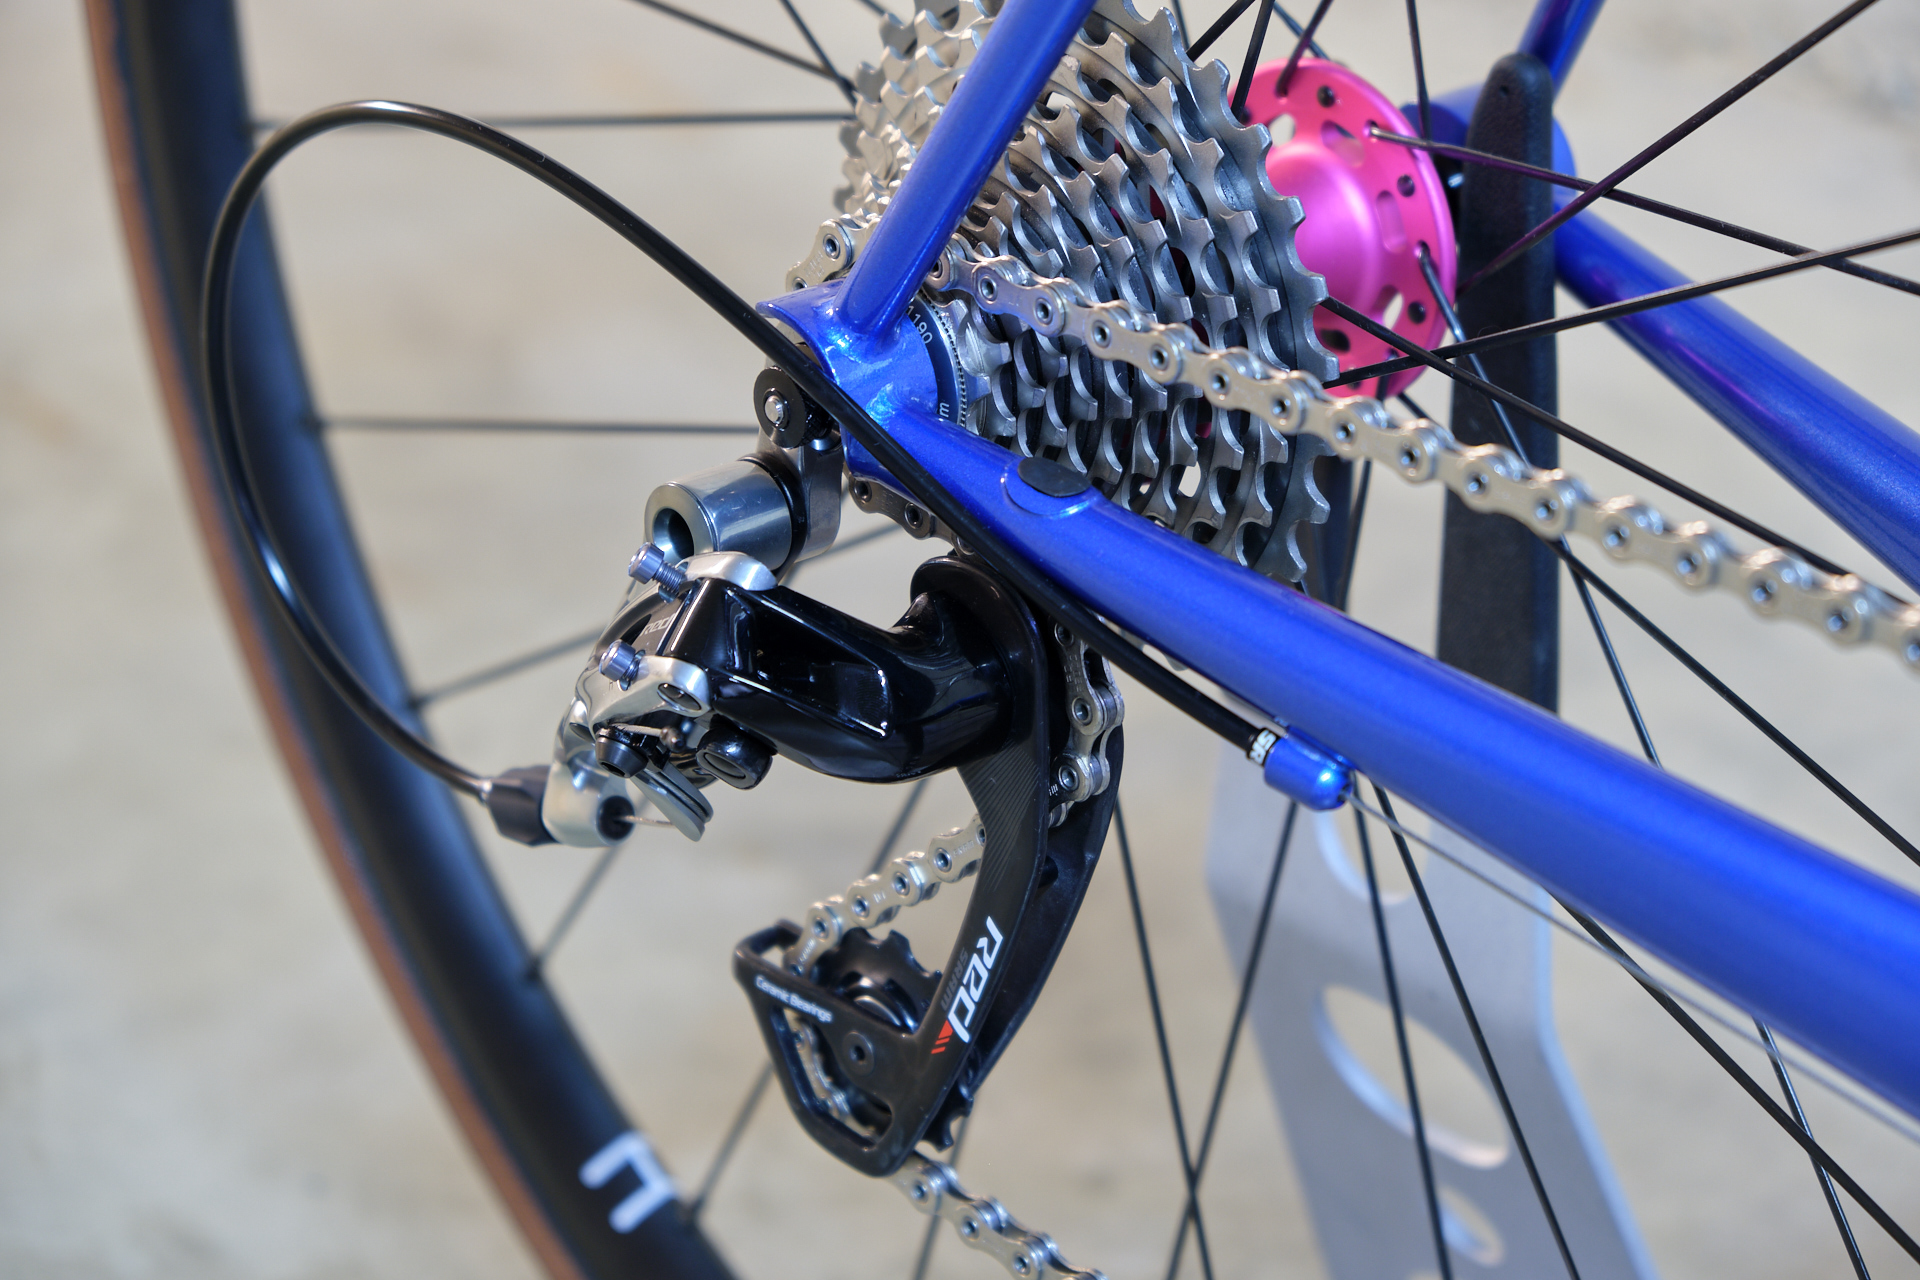
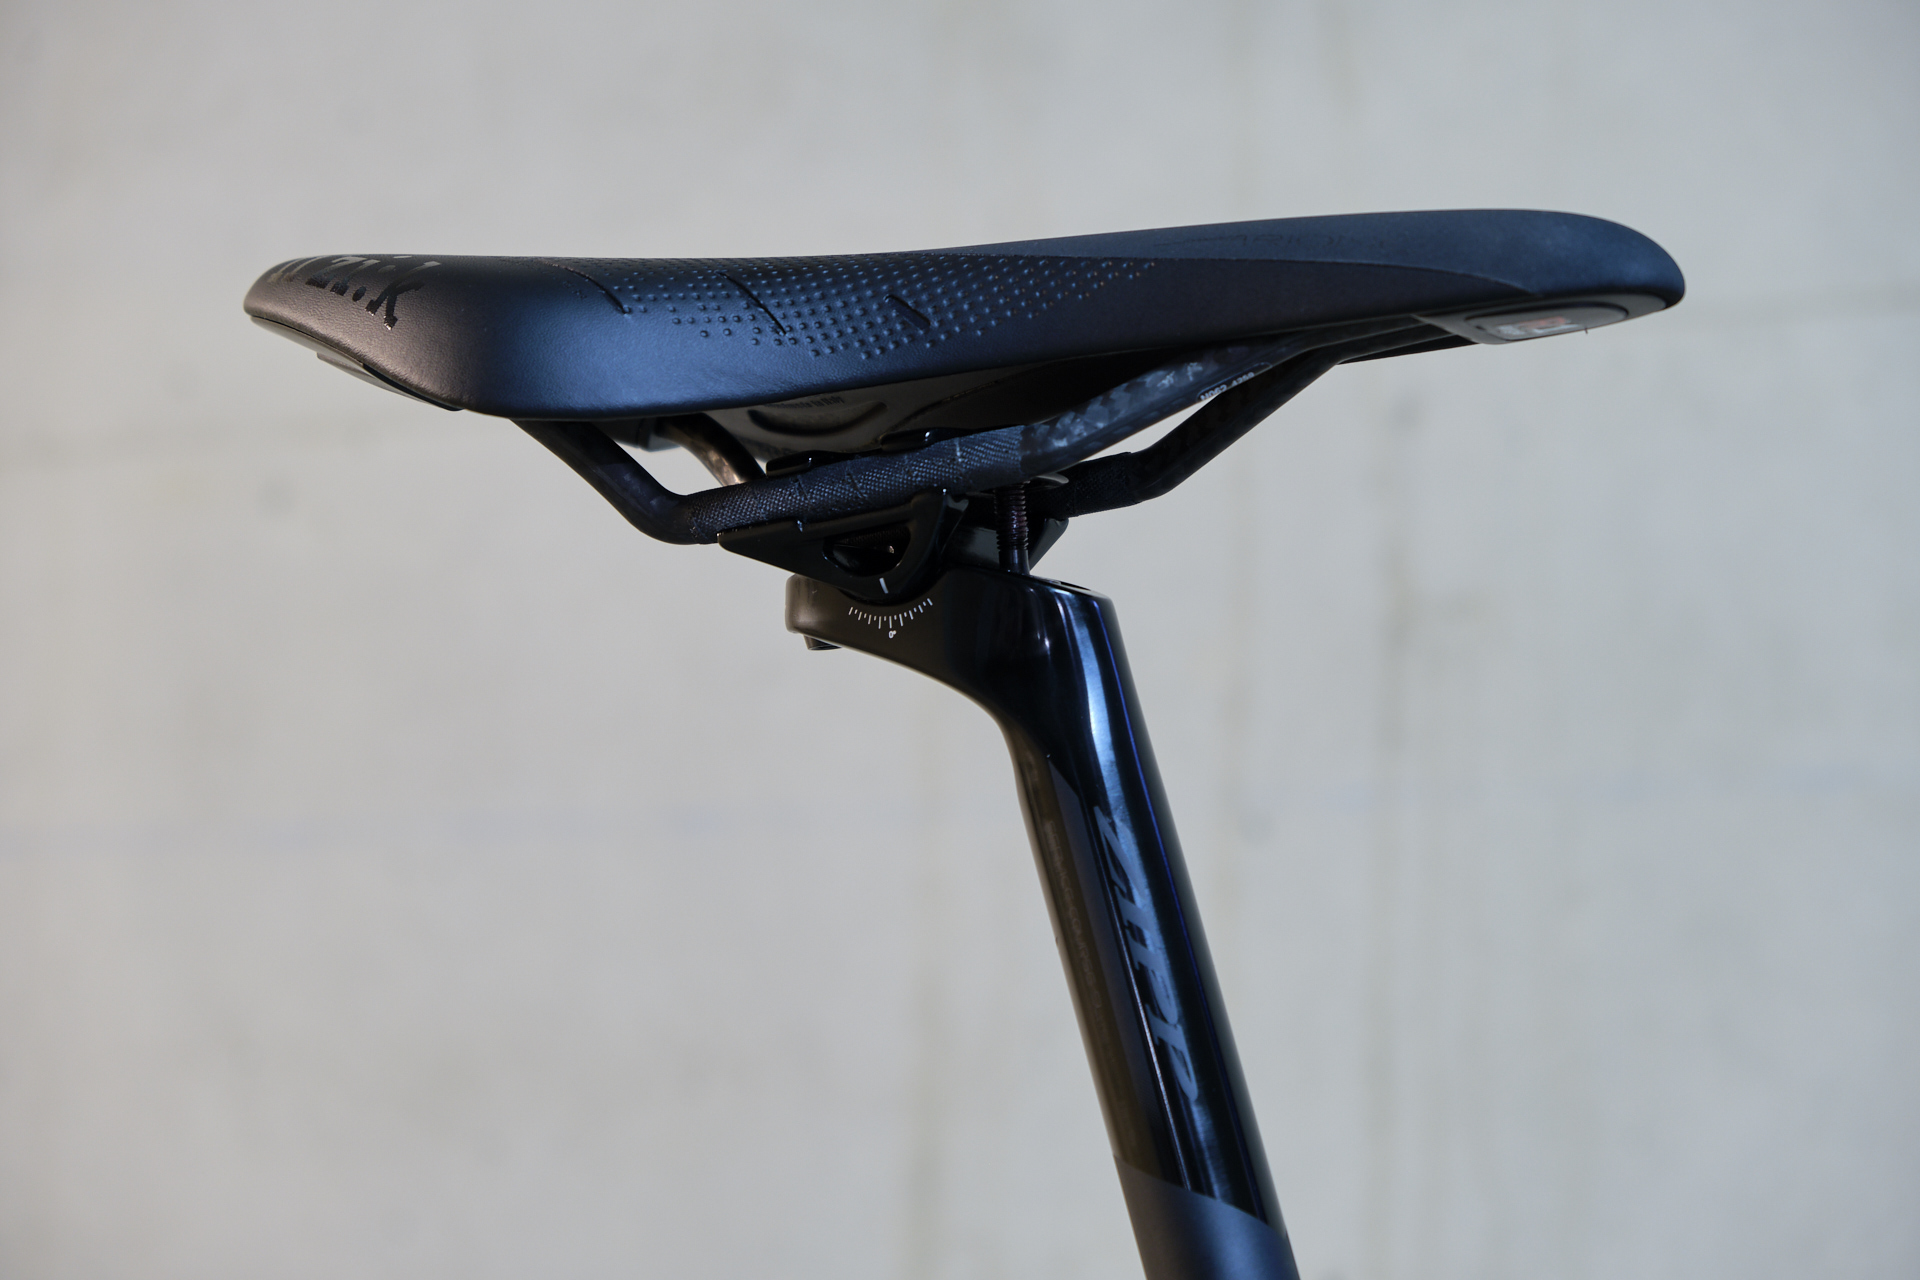
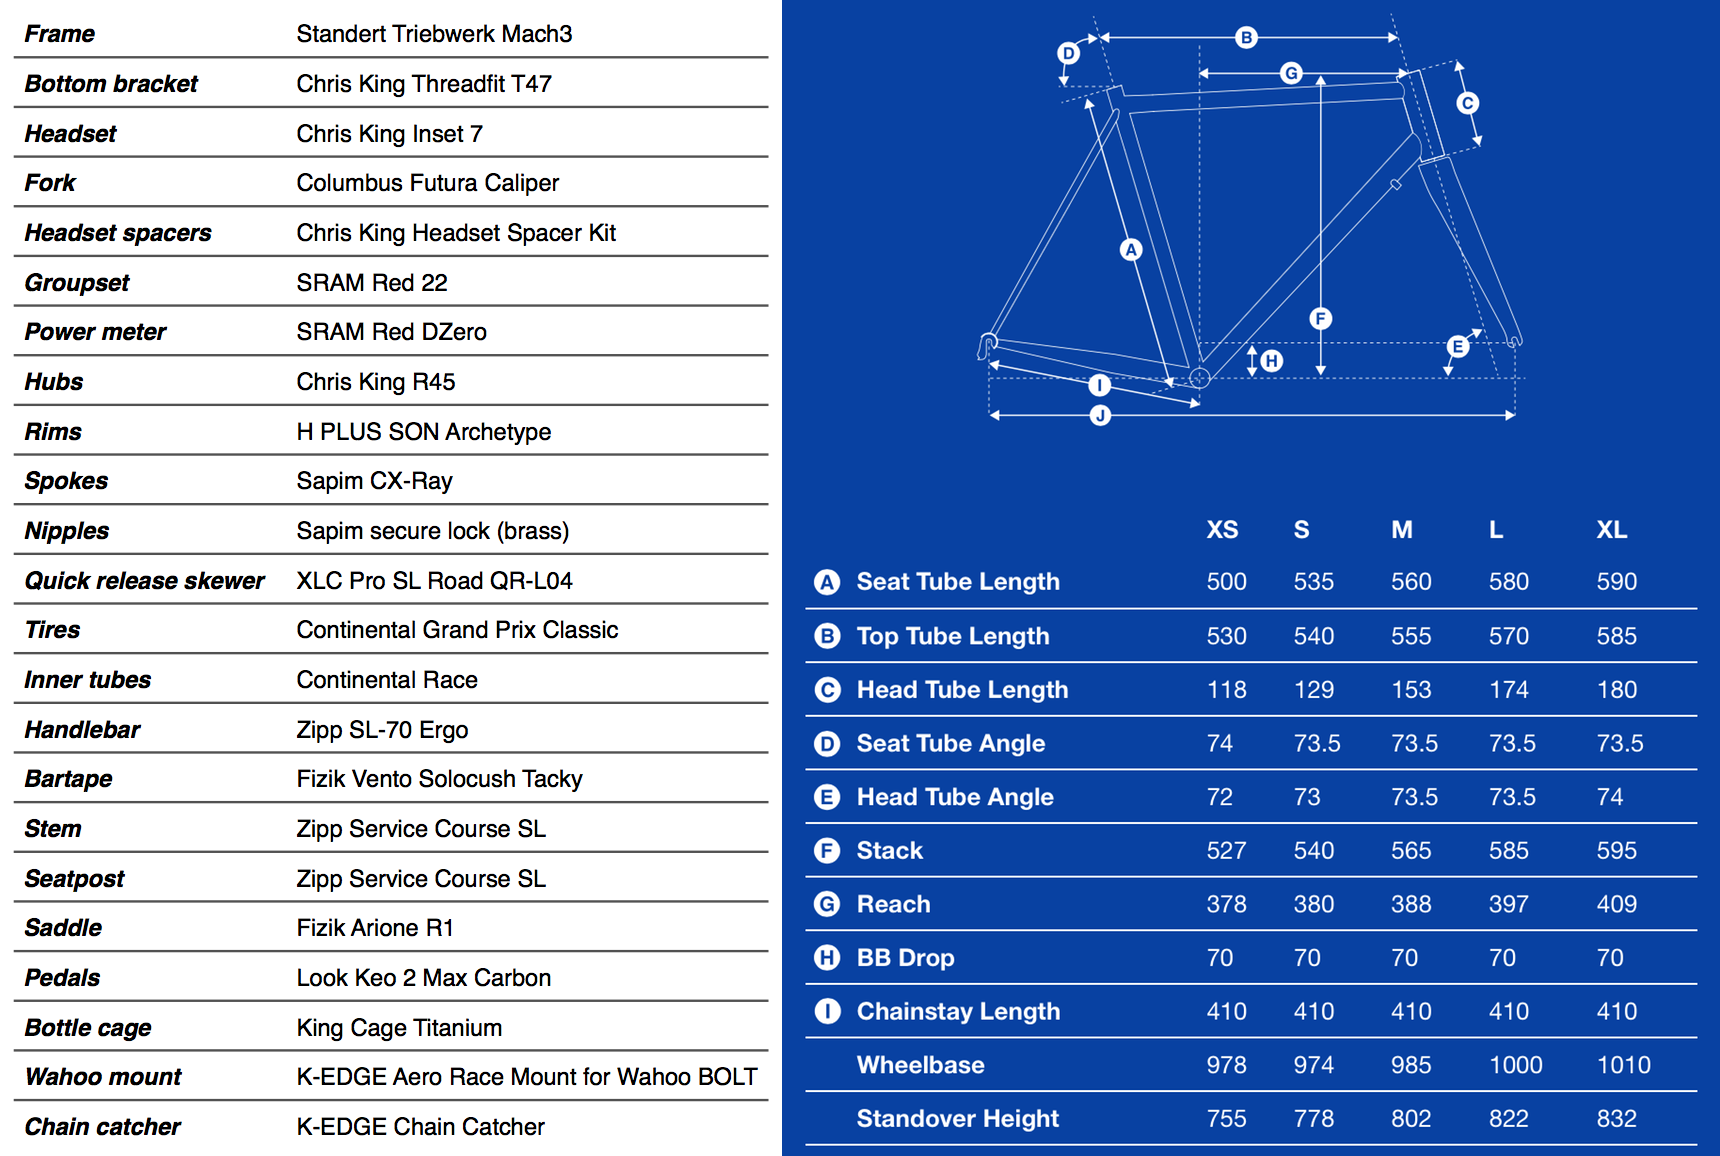
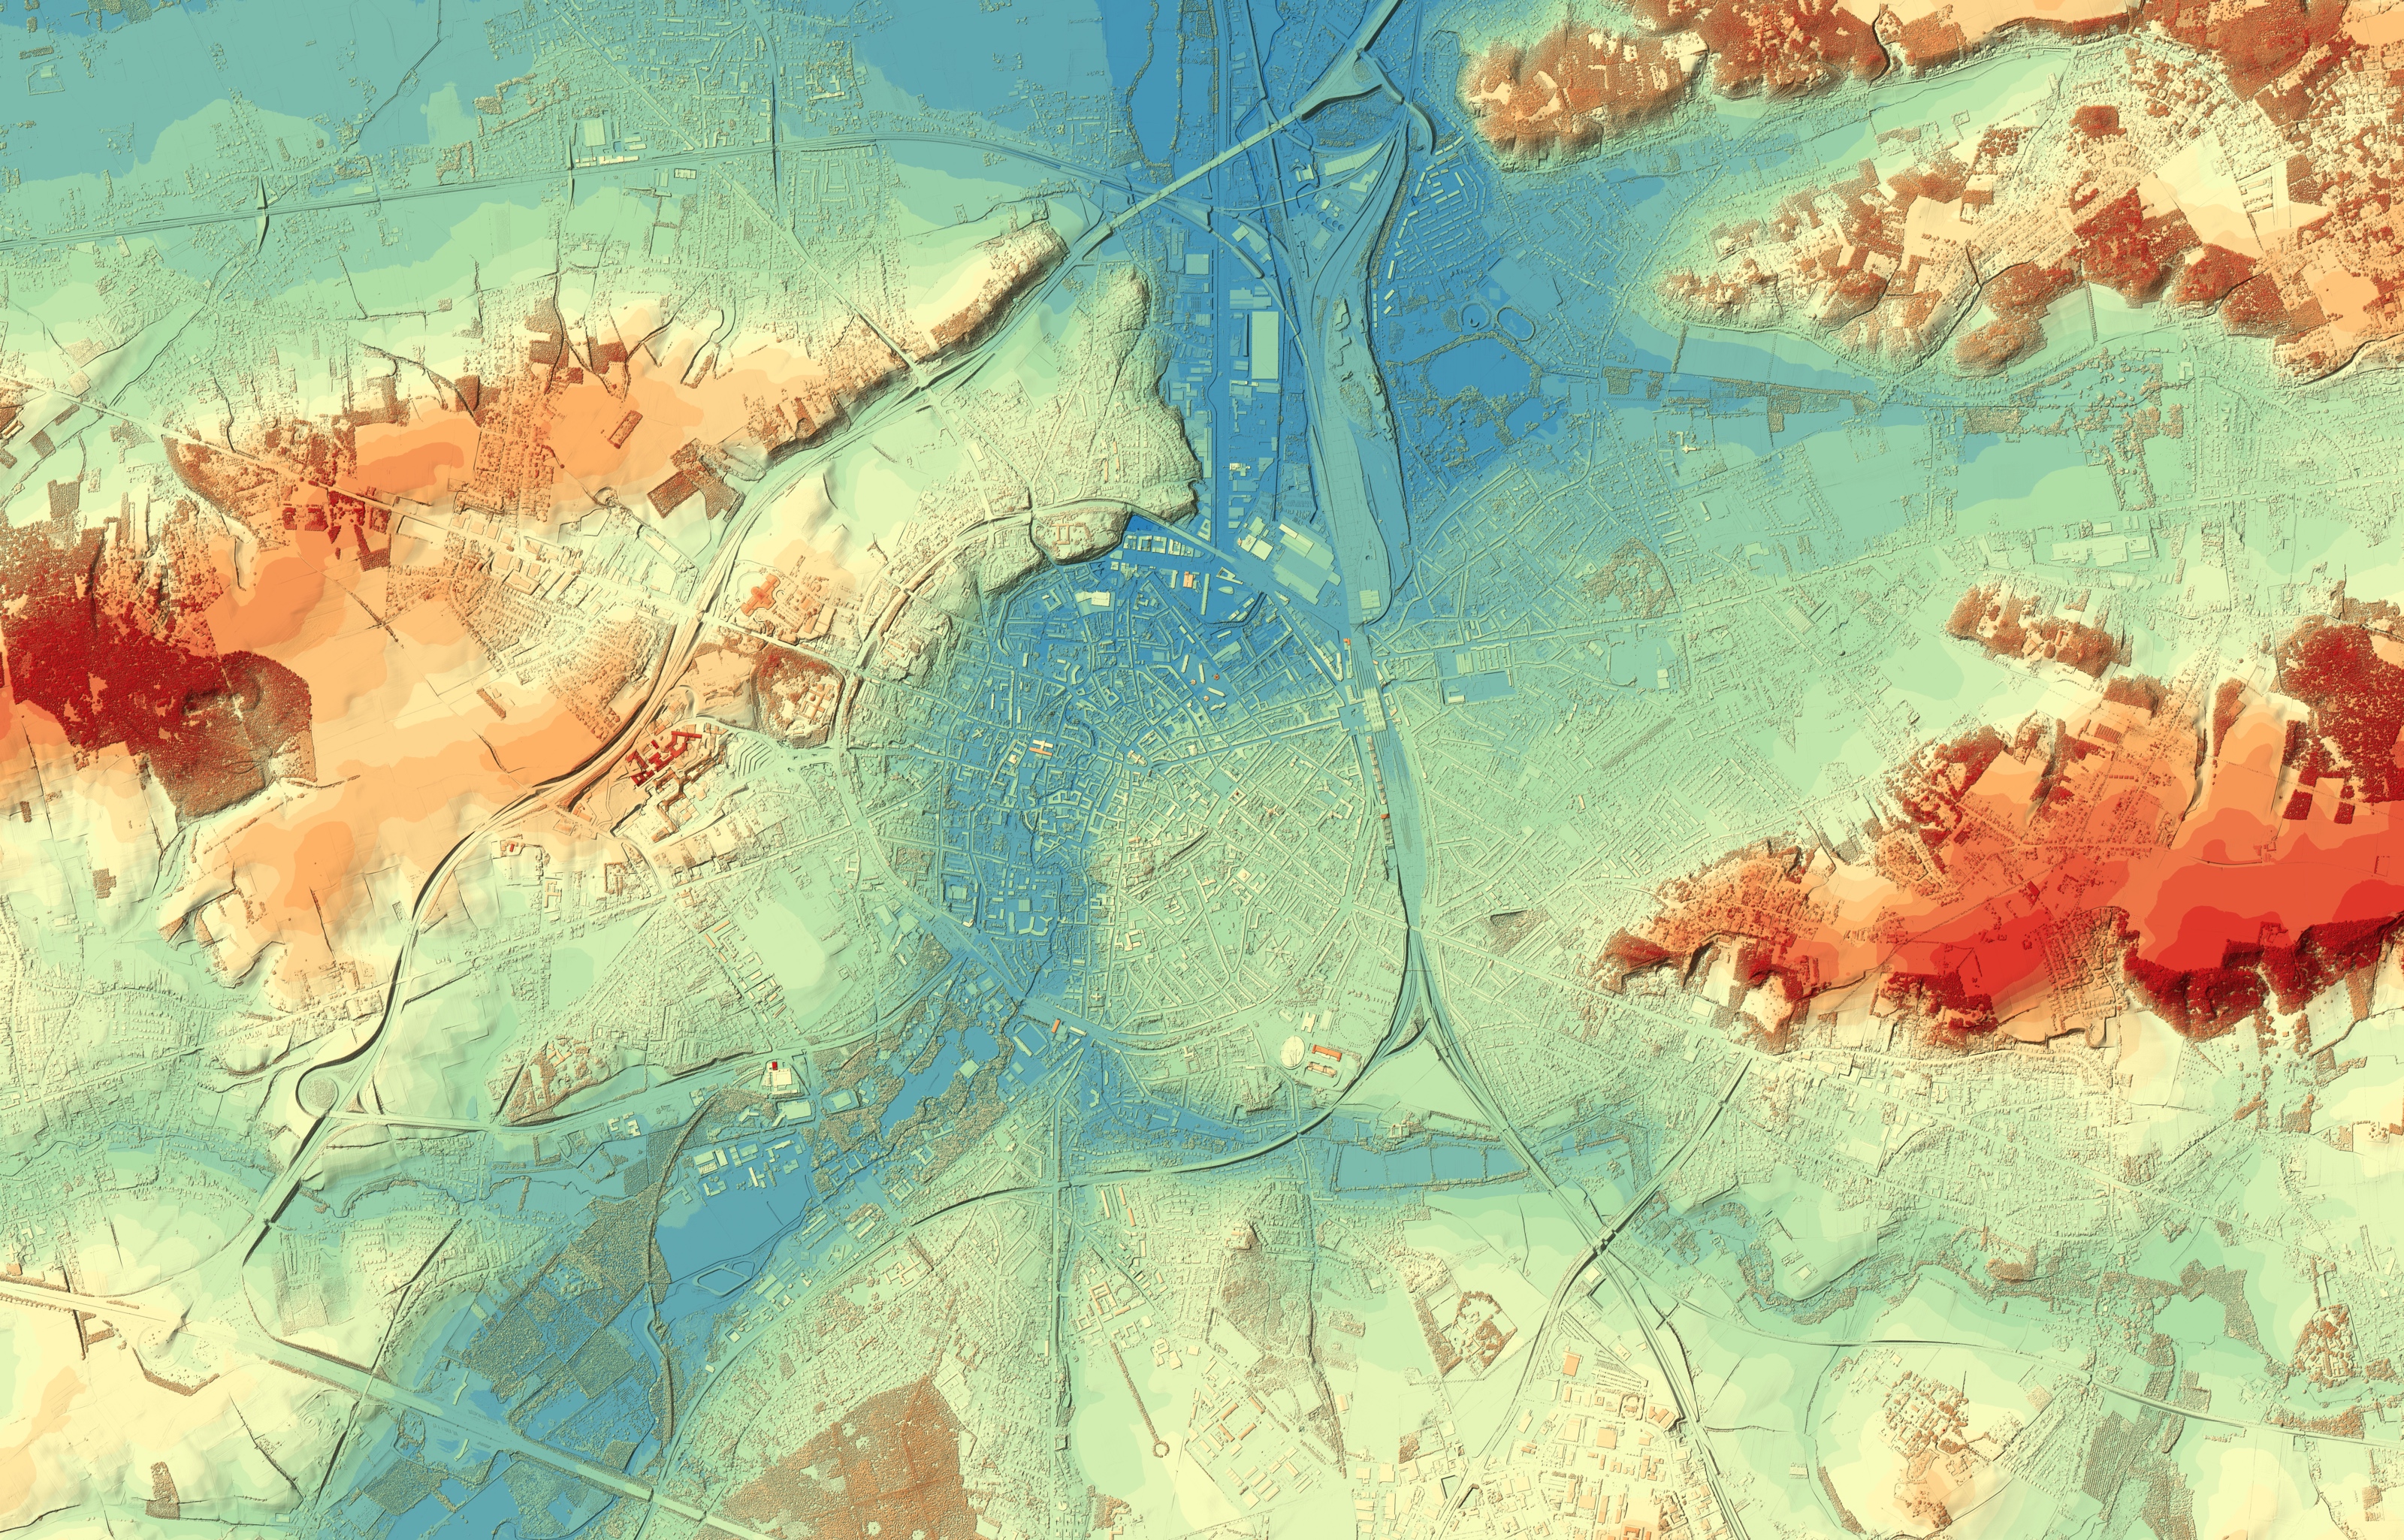
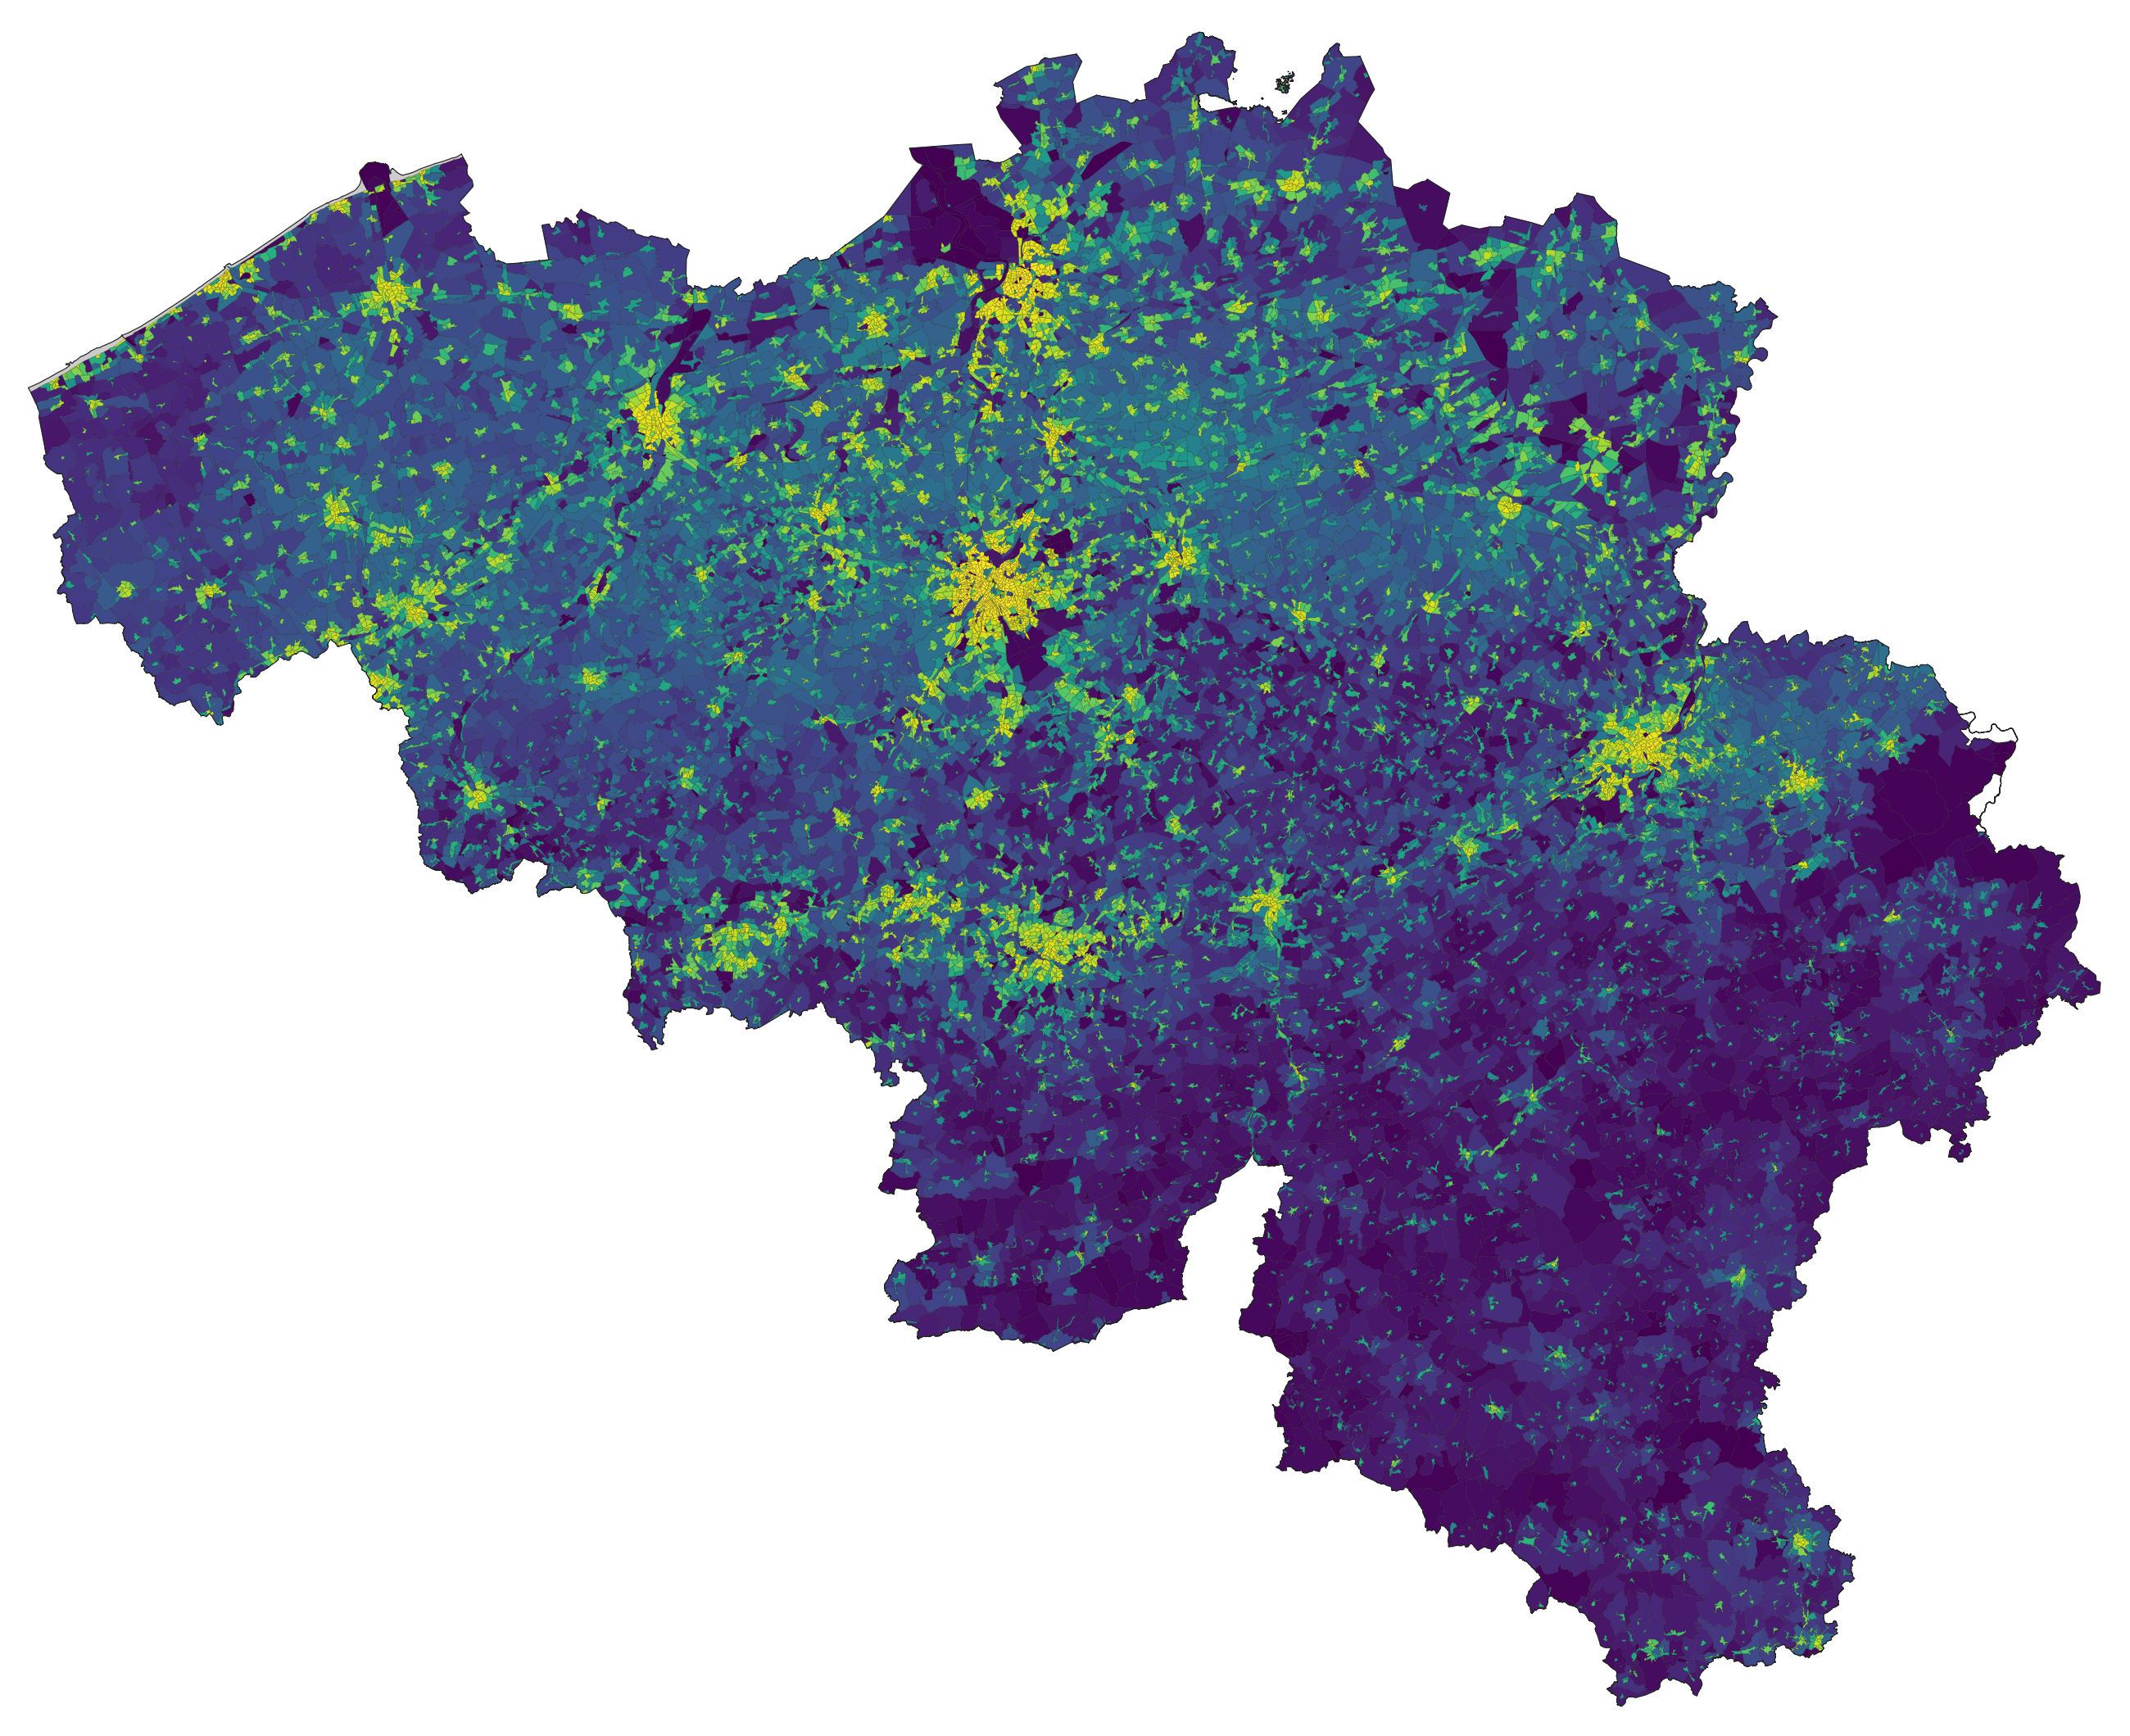
In the meantime I have been busy with work (but mostly good busy), and ordering bike parts/building up the new steel bike. More about the bike in the next post (hopefully very soon, as it is basically almost completely finished). Speaking of work, I am still very happy at TML (and I talked about this in a 20 minute presentation in front of a hundred PhD students and postdocs last week on a Career Talks event organised by the KU Leuven), I had some interesting projects this year, and in December I even did what I always wanted to do: work with data and plot it on a map. To be able to do this I learned using QGIS in a few days. QGIS is cool. I made so many cool plots that I could not stop smiling about them. (Below you can see a visualisation of the area around Leuven using the digital elevation model of Flanders, and also a slightly arbitrarily scaled map showing the population density in Belgium on a statistical sector level.)

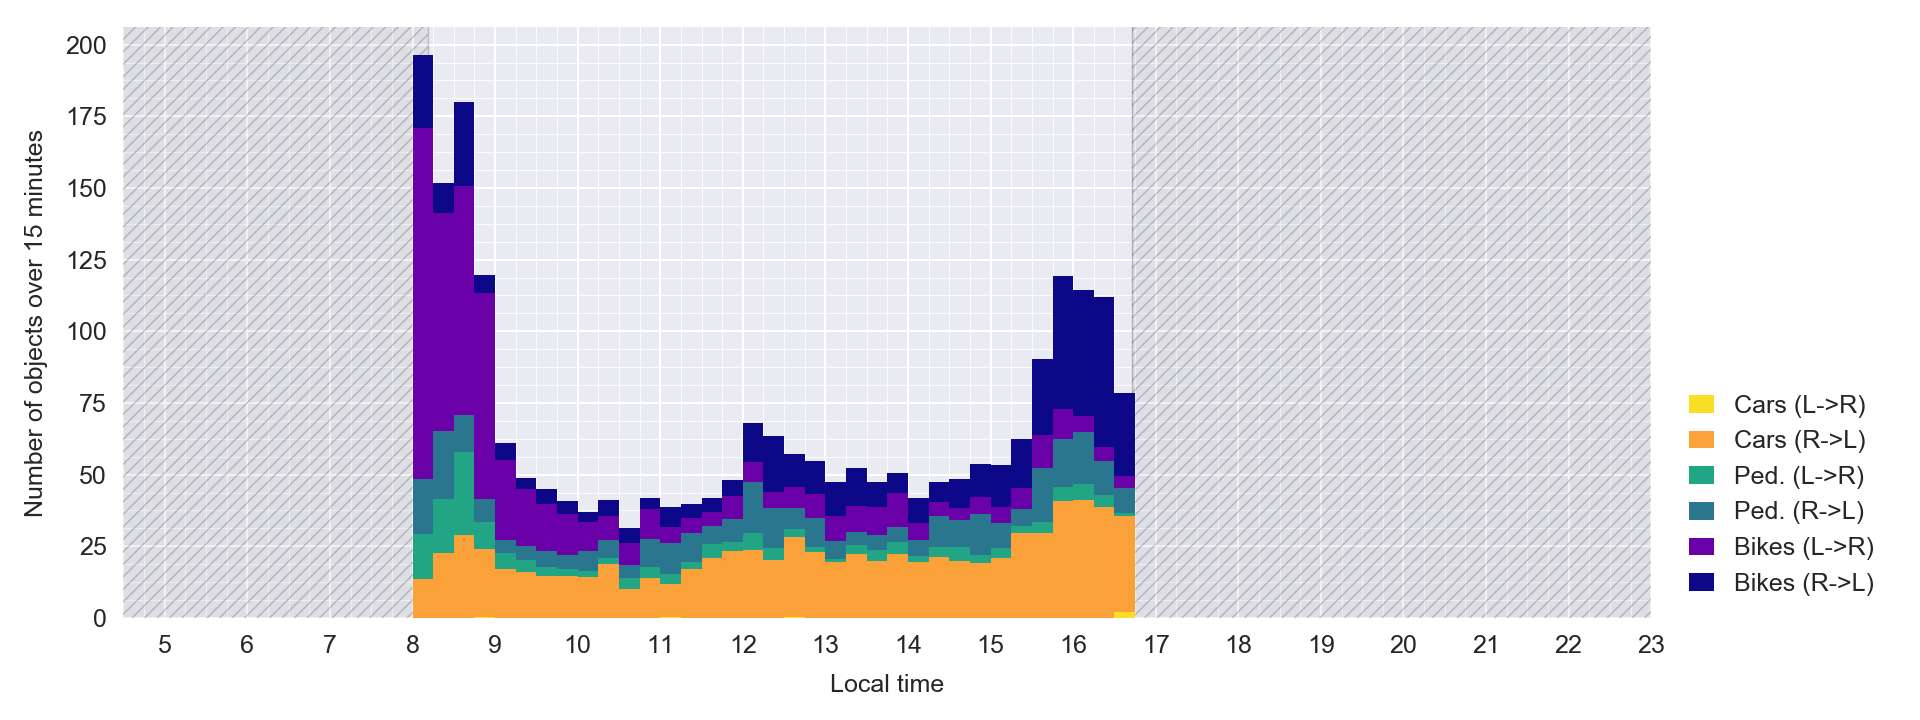
I was also deeply incolved in a project called Telraam, this will be a network of low-cost high-precision traffic counters, and my job was writing the actual script that runs on the Raspberry Pi units, doing the image recognition, tracking, and counting of different objects. I also did the initial work on the object classification and visualisation part. Unluckily we have no windows looking at the street, so I have no unit at home :( (Below is the average traffic from a few weekdays in a street that is one-way for cars)

We had a nice and calm holiday season, with three delicious dinners in the city (and zero unnecessary presents), and a Harry Potter movie marathon. Filou still knows how to behave around the Christmas tree, but he is probably the best behaved cat ever. Now it has been more than a year that he is living with us, and he comes to sit/cuddle with us (mostly me) in the couch every day. I am pretty sure Clio is sometimes jealous of him :D

Let’s hope this year I will take more photos with a proper camera (especially since I just bought a Fijifilm X-T3), because 2018 was a low in that sense in the past decade.

The year (2018) in cycling (and other sports)

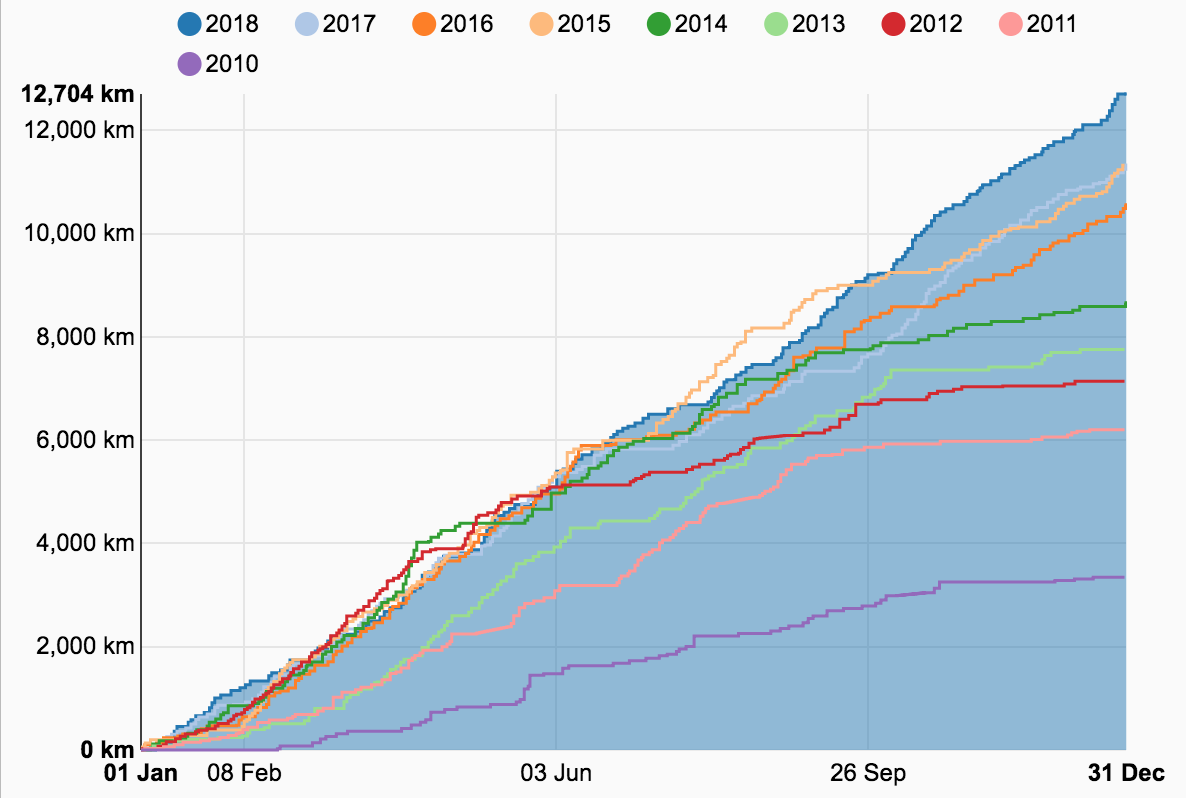
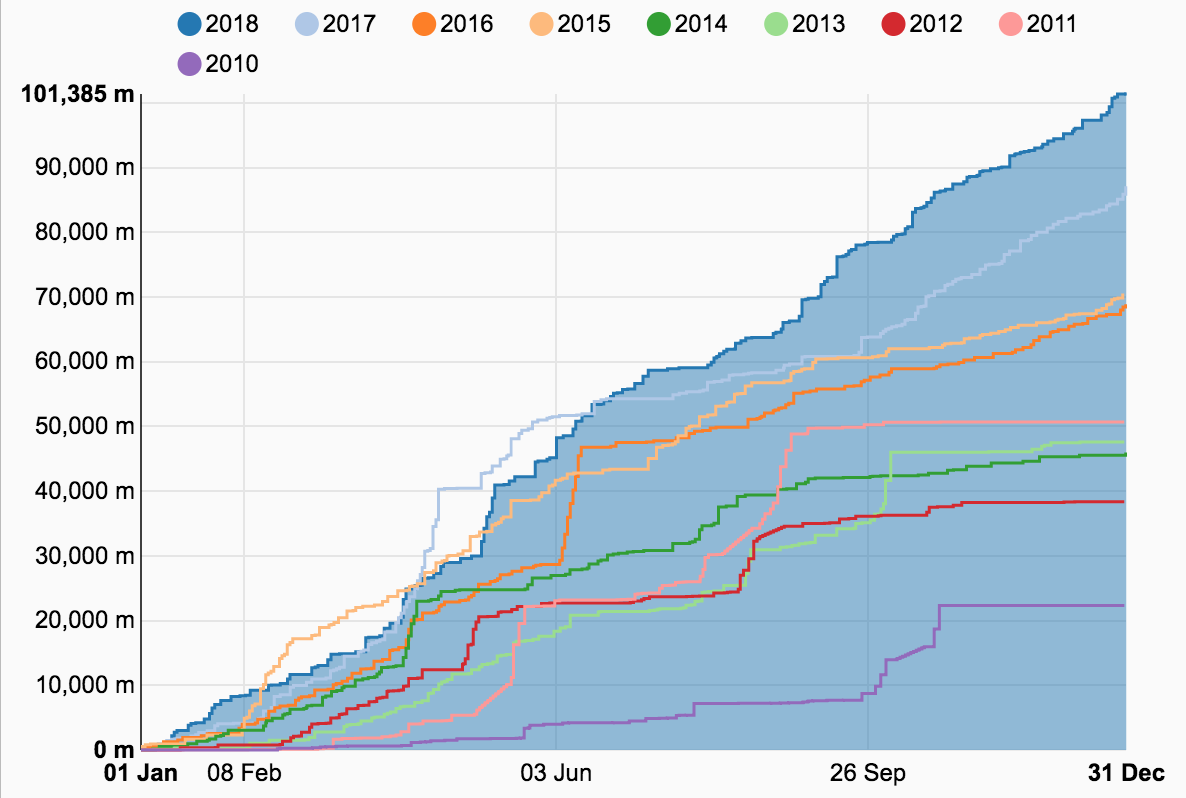
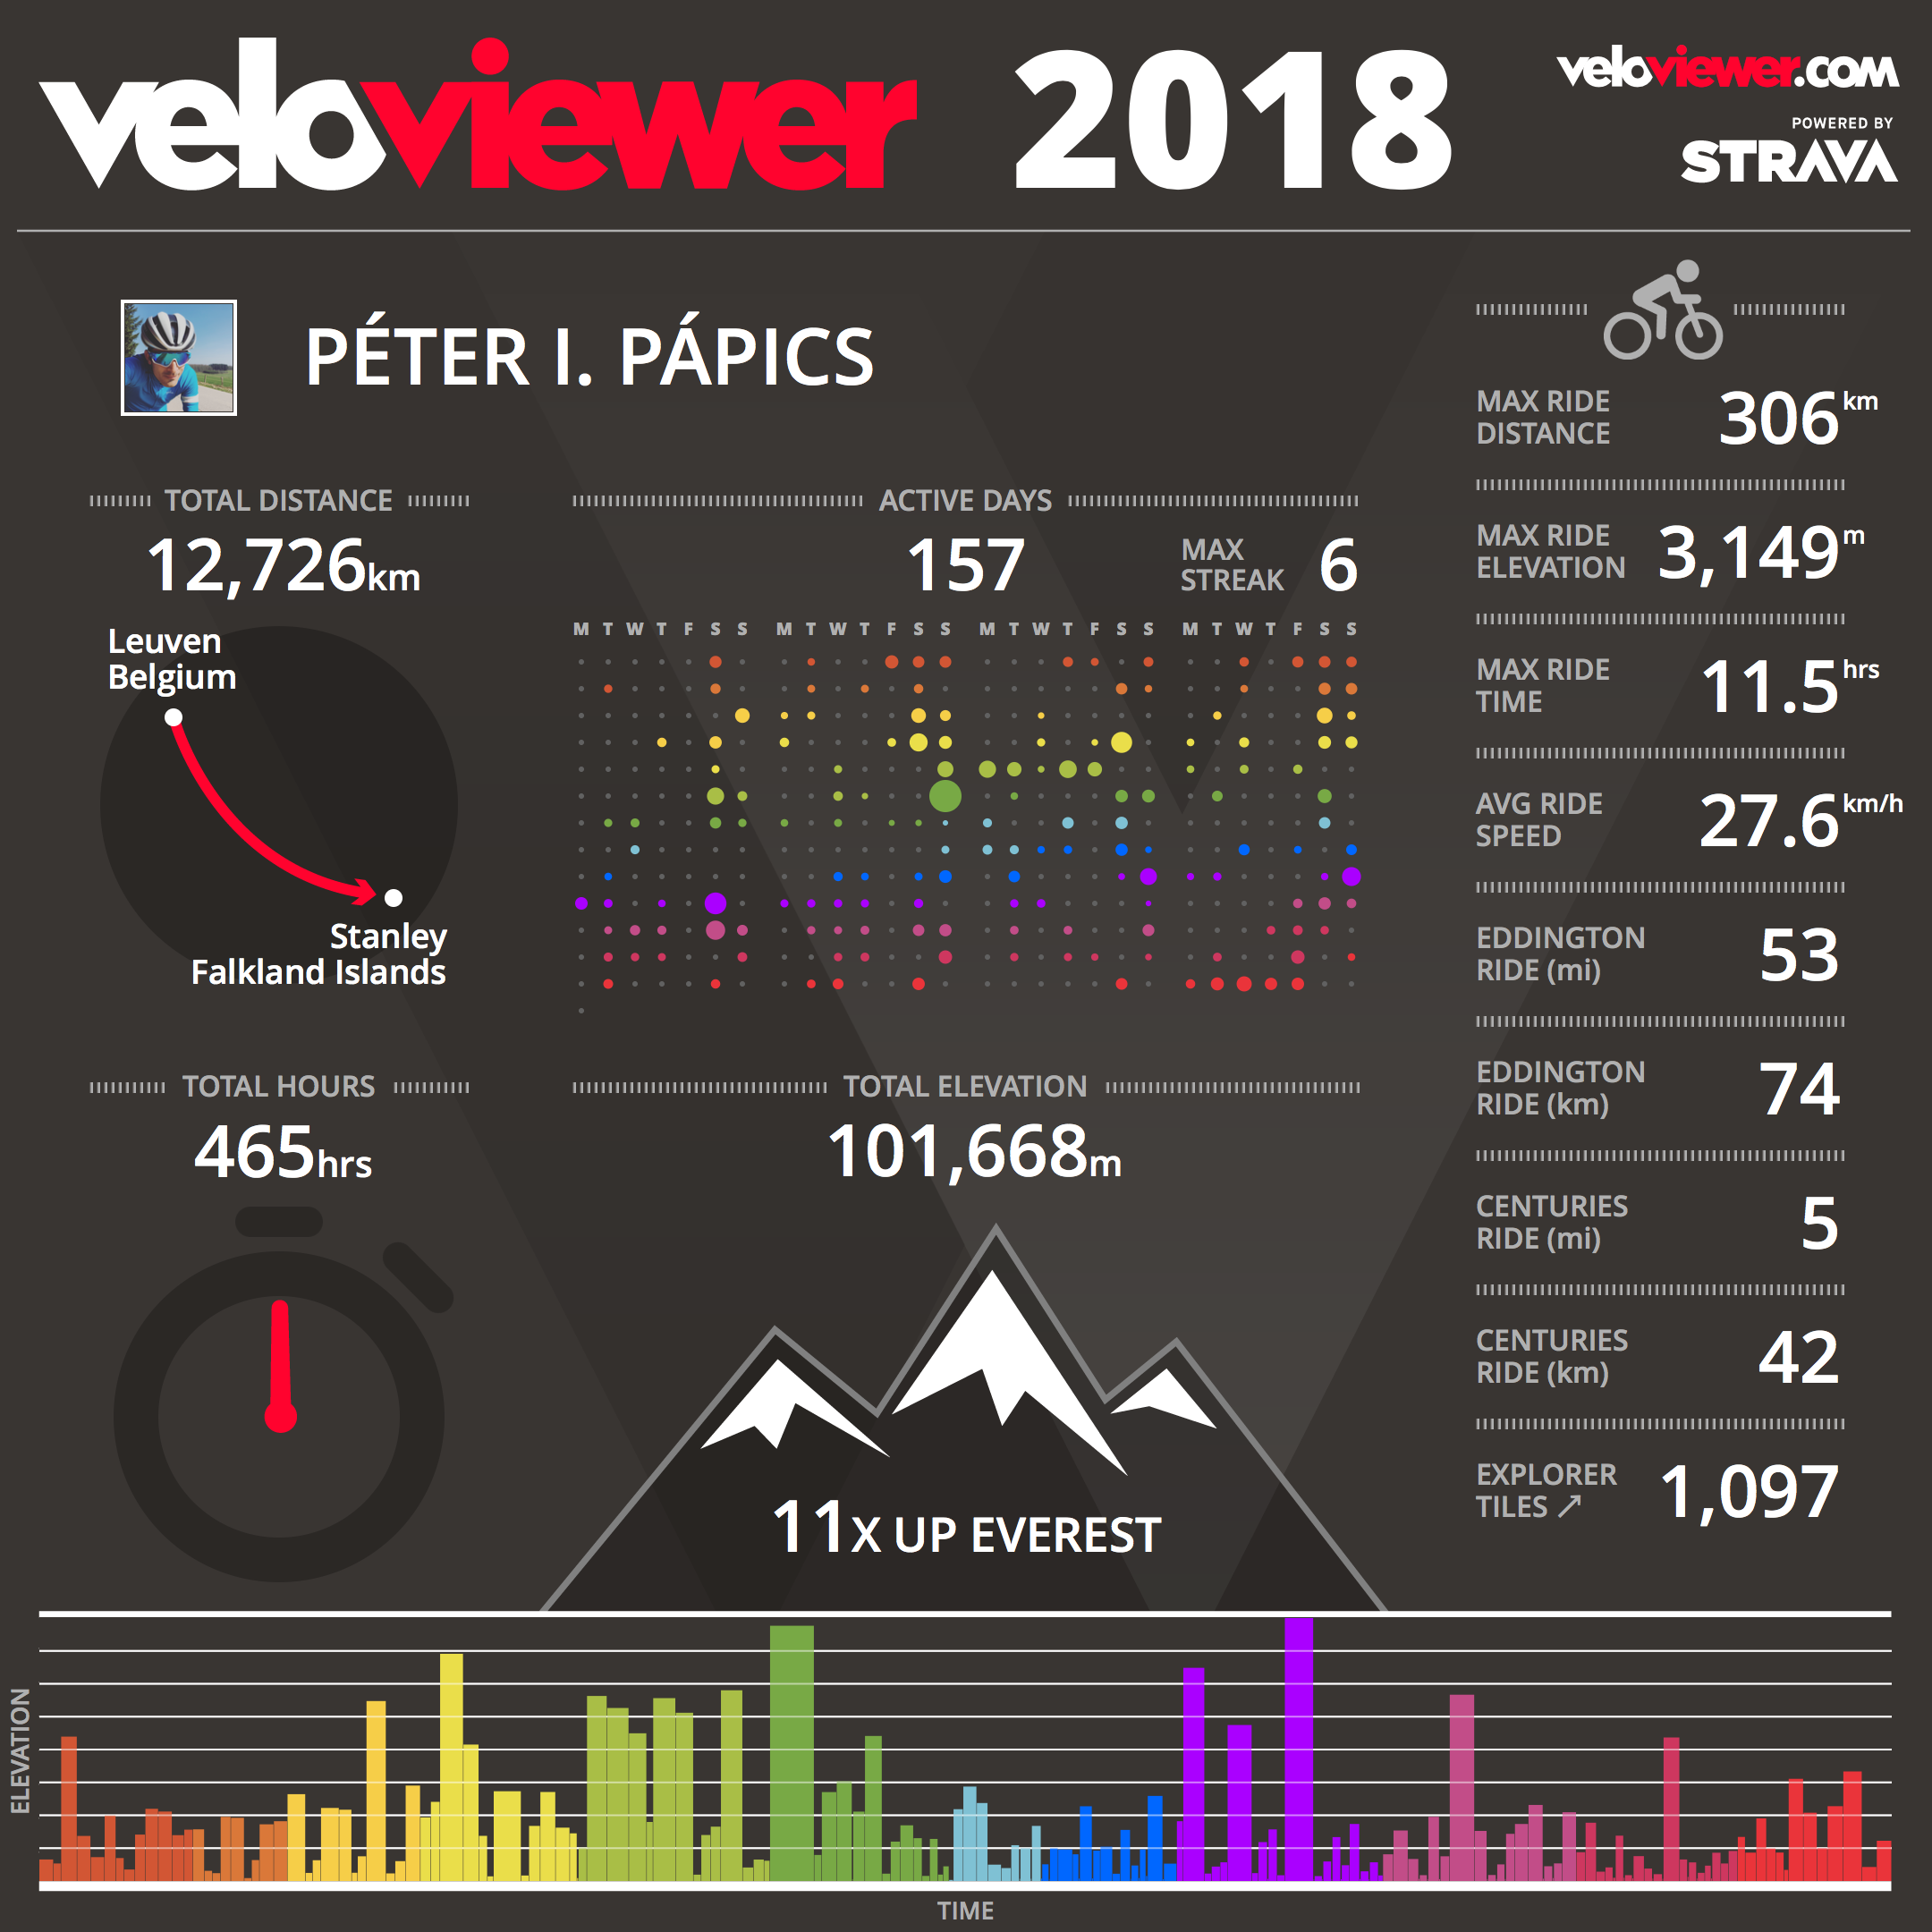
2018 was the fourth year in a row that I managed to bike more than 10000 kilometres, but this was the first time that I finished the season with more than an average of 1000 km per month (my best months were September and October with 1340 km and 1329 km, while my worst were July and February with 628 km and 676 km). Therefore my best cycling-year ever is now 2018 with 12704 km (with a not even small margin of 1374 km – 10.8% – over 2017). For the first time ever I broke the 100000 meter elevation gain limit too.

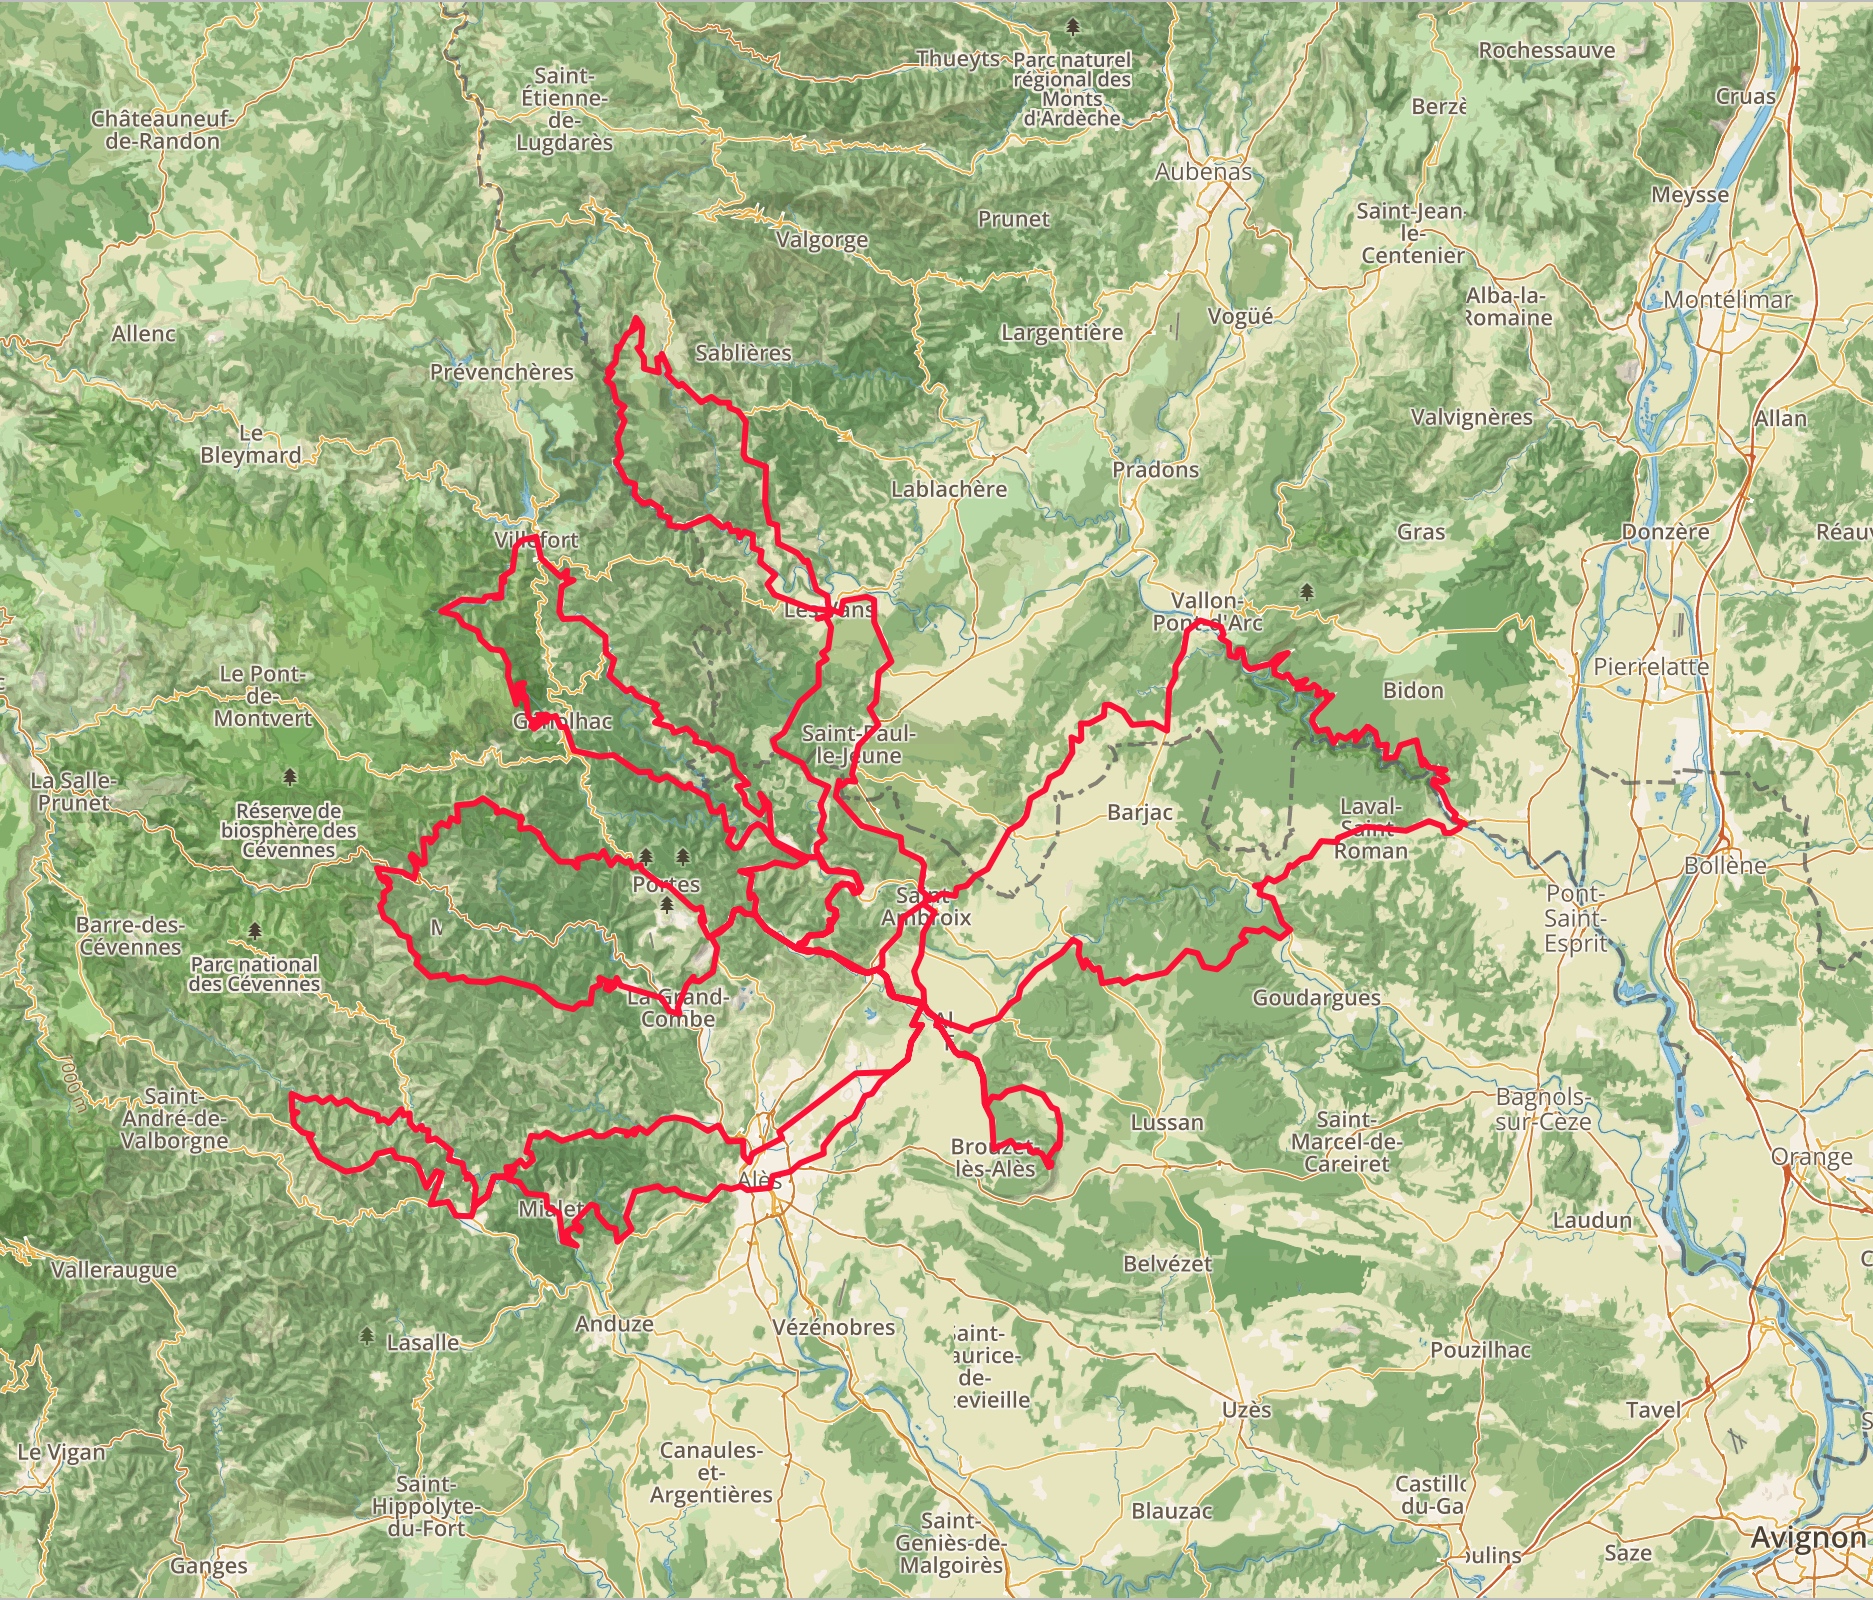
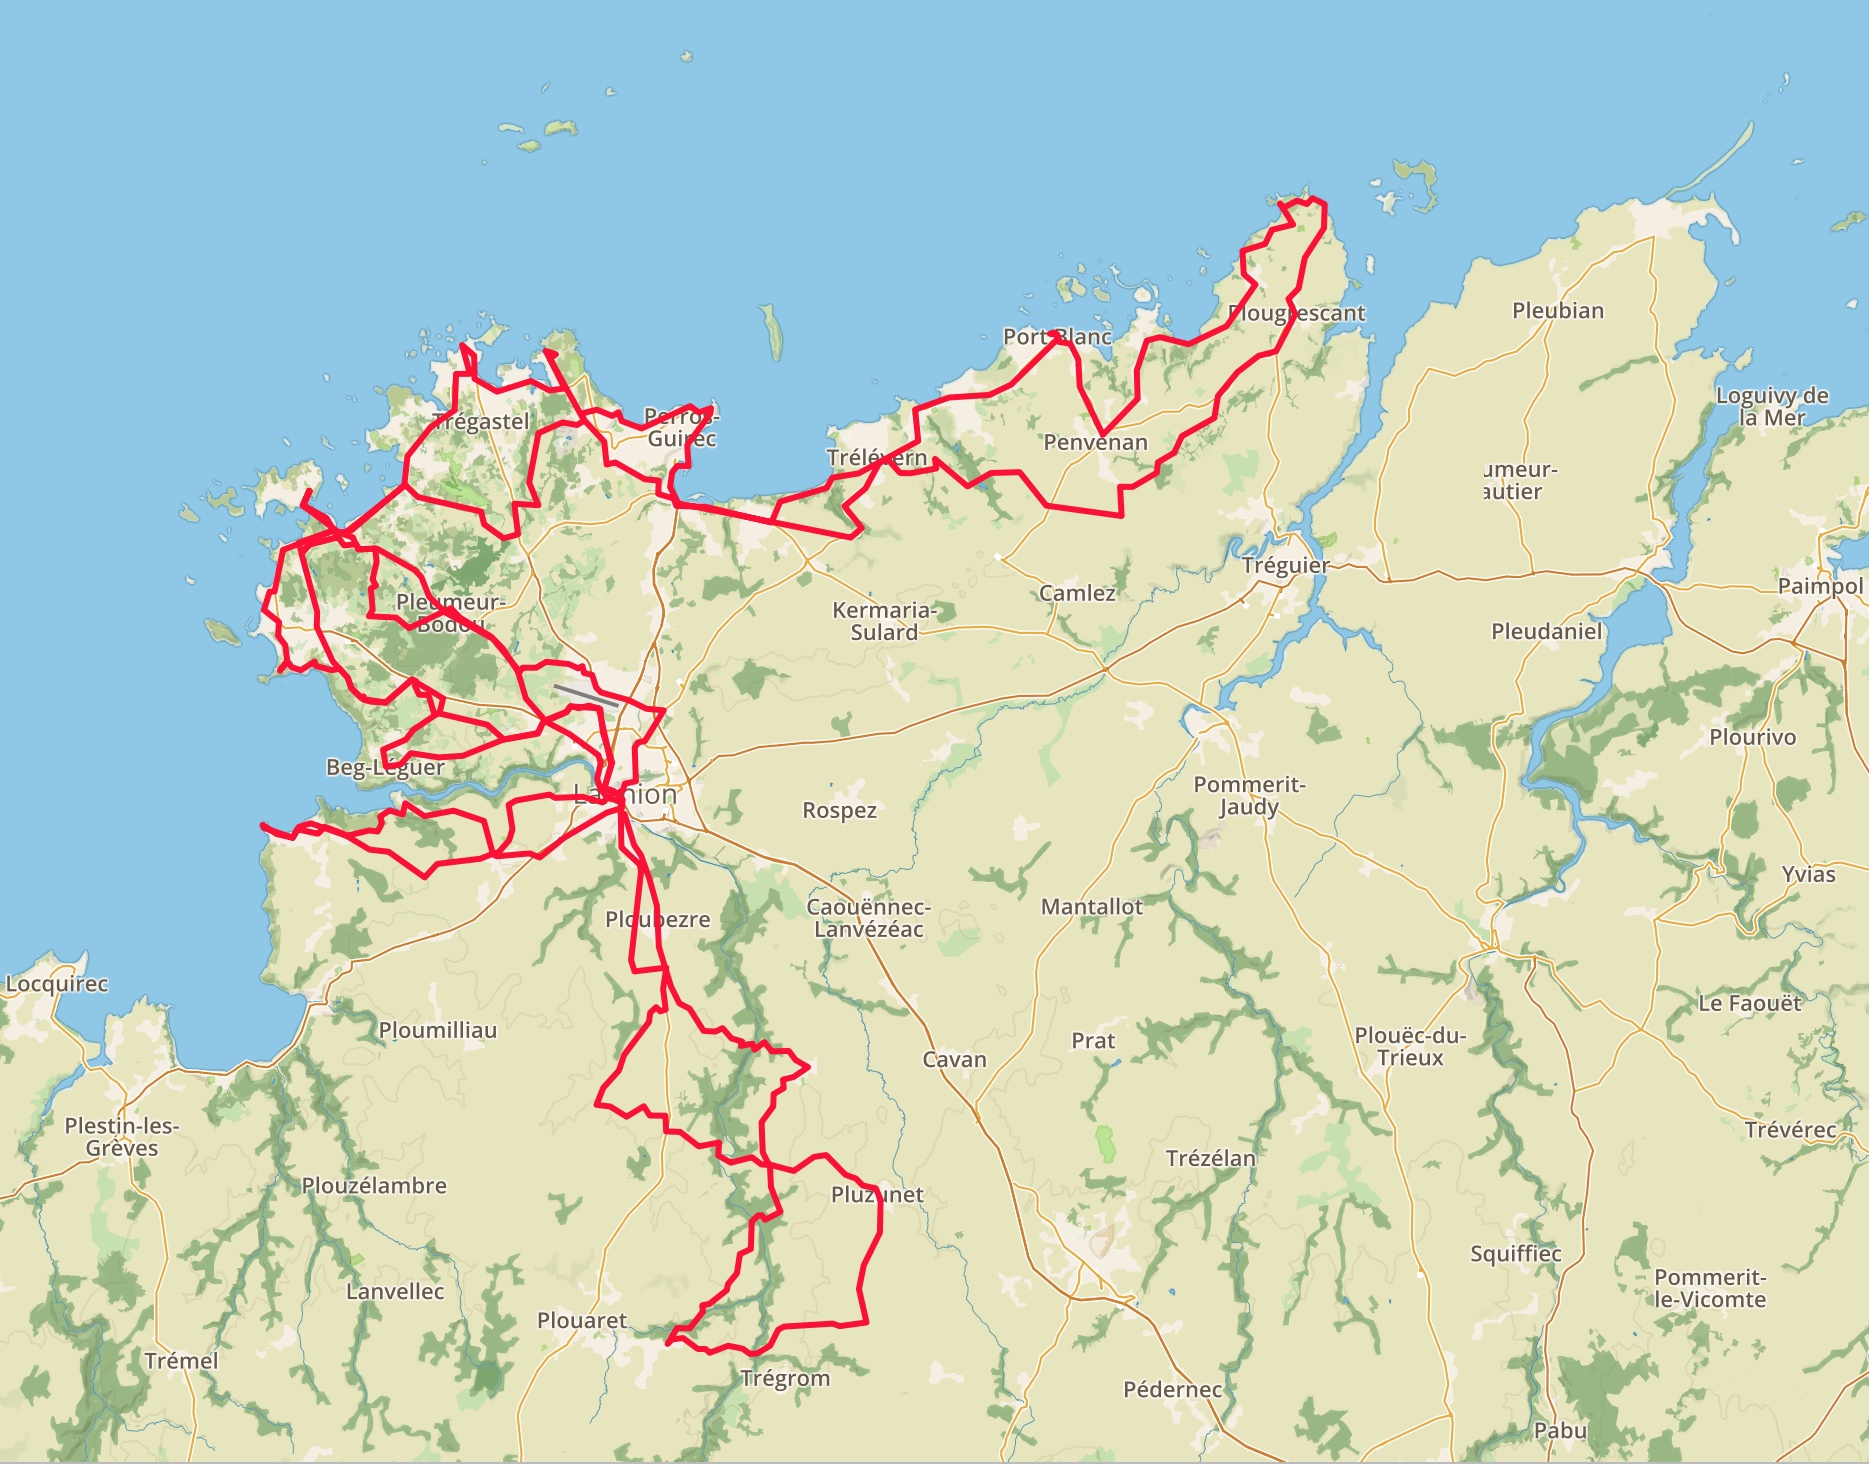
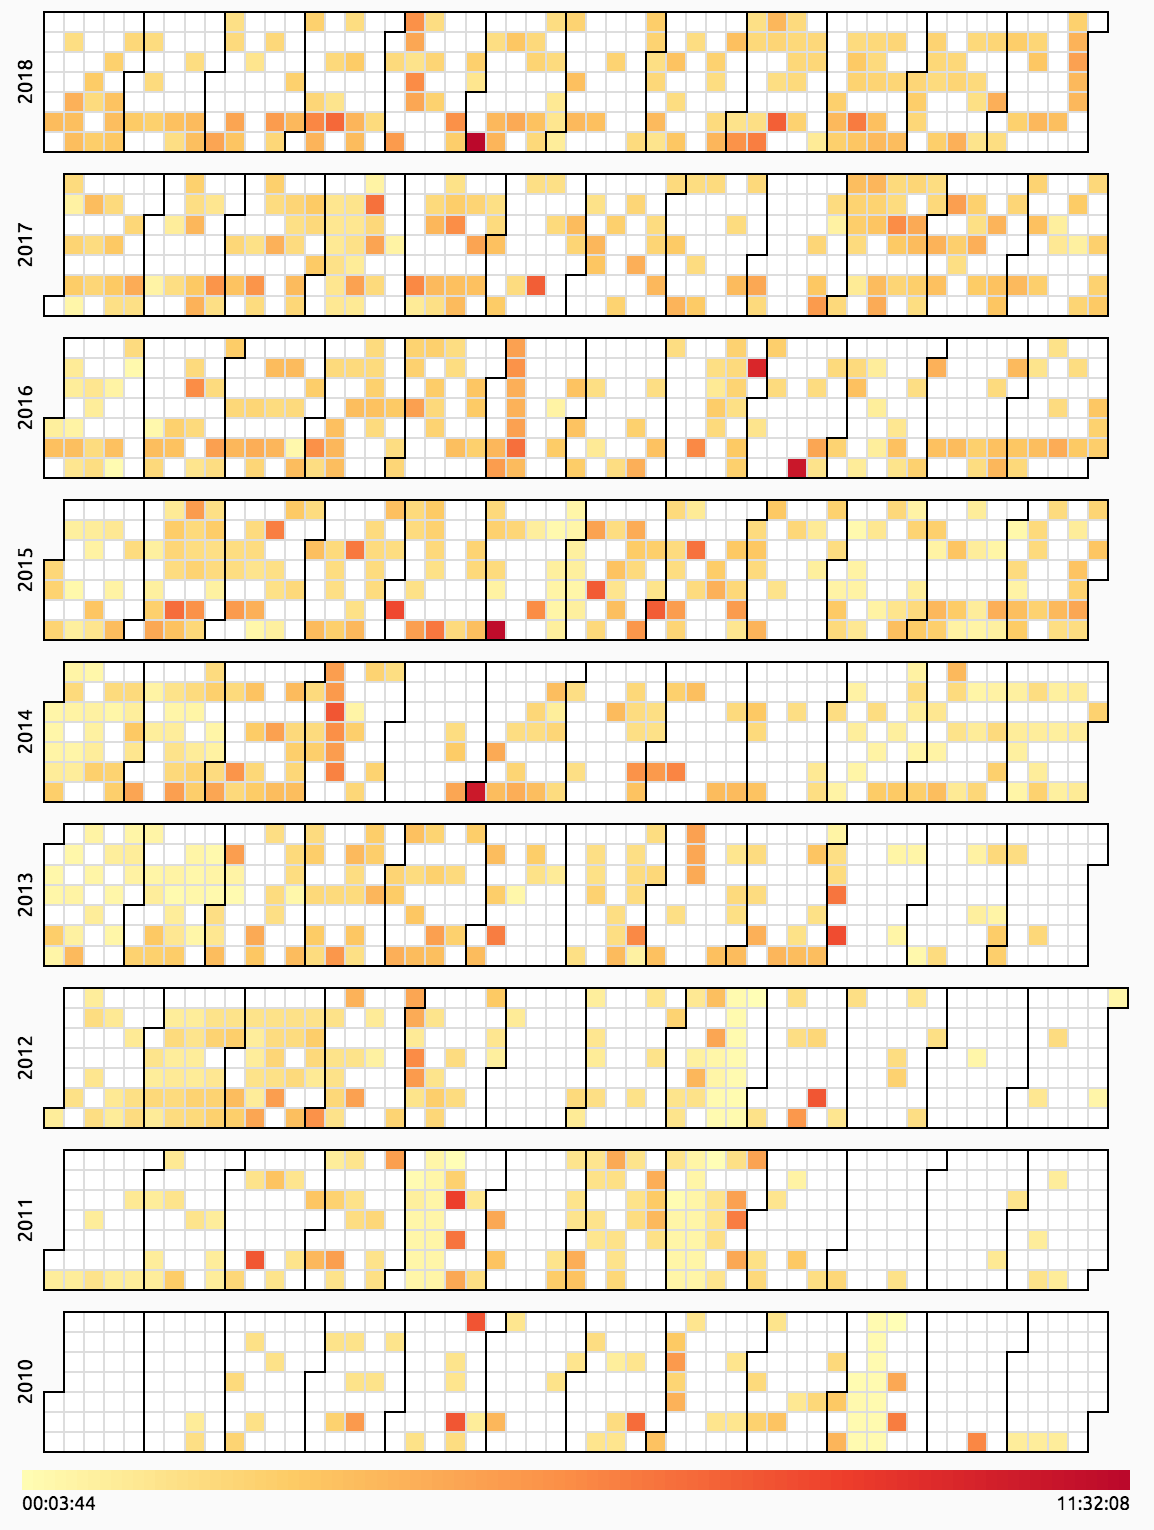
As usual I had no real plans for the year, but I still managed to make it somewhat special. First of all, I had quite a few nice rides in the Ardennes (and the Eifel, once even Clio joined me for a while along the Vennbahn), maybe not as many as I wanted, but still much more than the previous years. I hope to continue this trend in 2019 too, because I know the roads around Leuven way too well (and as I get older more experienced I seem to tolerate the crap infrastructure and the intolerant drivers of Flanders less and less). Furthermore, I had a really enjoyable (except maybe for that crazy thunderstorm with hail) cycling holiday in France with a small group of friends, and I also took the bike along to Bretagne where I made three nice morning rides (to make up for all those pancakes which we ate with Clio). Thanks to these non-local rides, I have ridden more on previously unseen roads than ever before. My biggest achievement this year was biking to the highest point of Belgium and the highest point of the Netherlands alone, which is now my longest solo ride with 306 km and 3057 m elevation gain (and by duration also my longest ride – including group rides too – with 11 hours and 32 minutes). Finally, my latest achievement is completing the Rapha Festive 500 in five consecutive days (I did it in 6 non-consecutive days back in 2015), being amongst the first thousand people who have crossed the threshold :)

The raw numbers for my cycling – without the daily commutes of course – in 2017:

Total distance: 12704 km
Total elevation gain: 101385 m
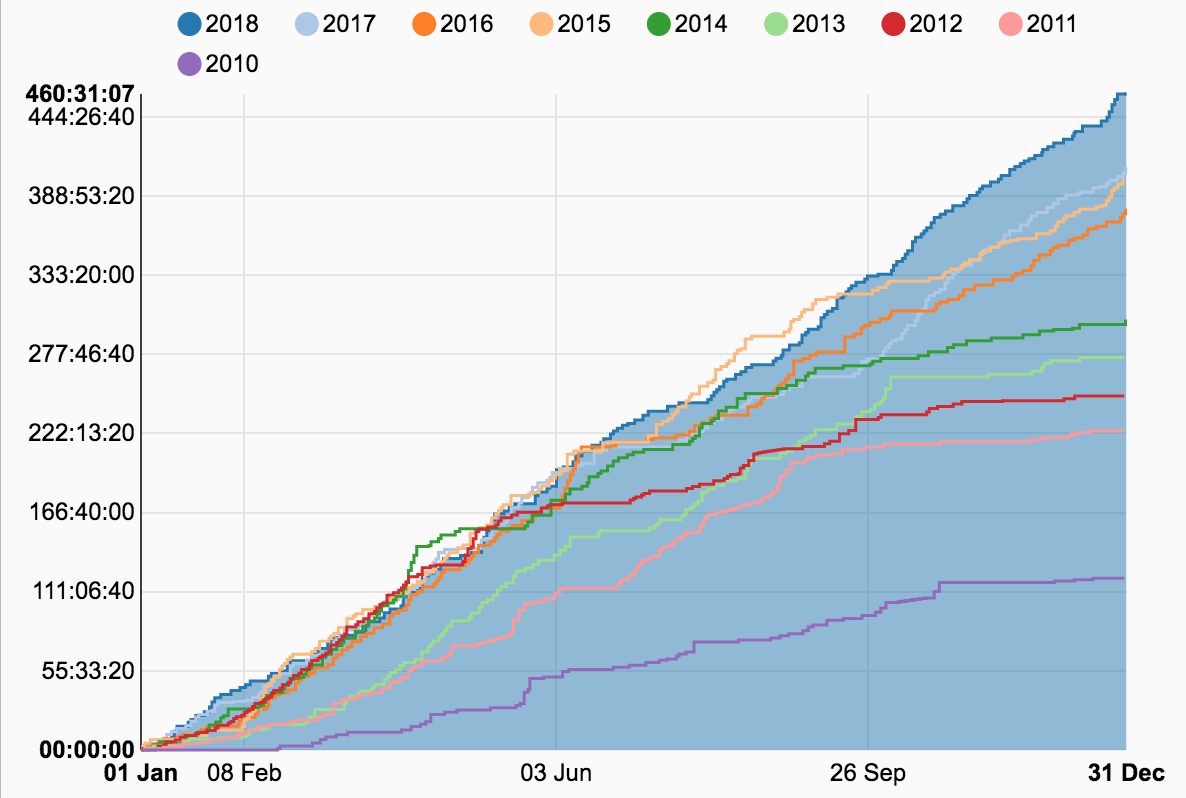
Total time: 460 h 31 m
Activity count: 192 (over 155 days*, just like in 2017)
Average speed: 27.6 km/h
Average heart rate: I stopped wearing a HR strap, I only look at power now.
Average cadence: 87.5 rpm (but I have no sensor on my cross bike)
Average temperature: 13.2°C (coldest: December with 1.9°C, hottest: July with 22.4°C)
Total calories burned on the bike: 302730 cal

*Starting from the last days of July there were a lot of days when I did my training rides immediately before and/or after work, and on those days I rode my race bike also to work to save time, therefore creating days with two activities (of which one was most of the time less than 5 kilometres).

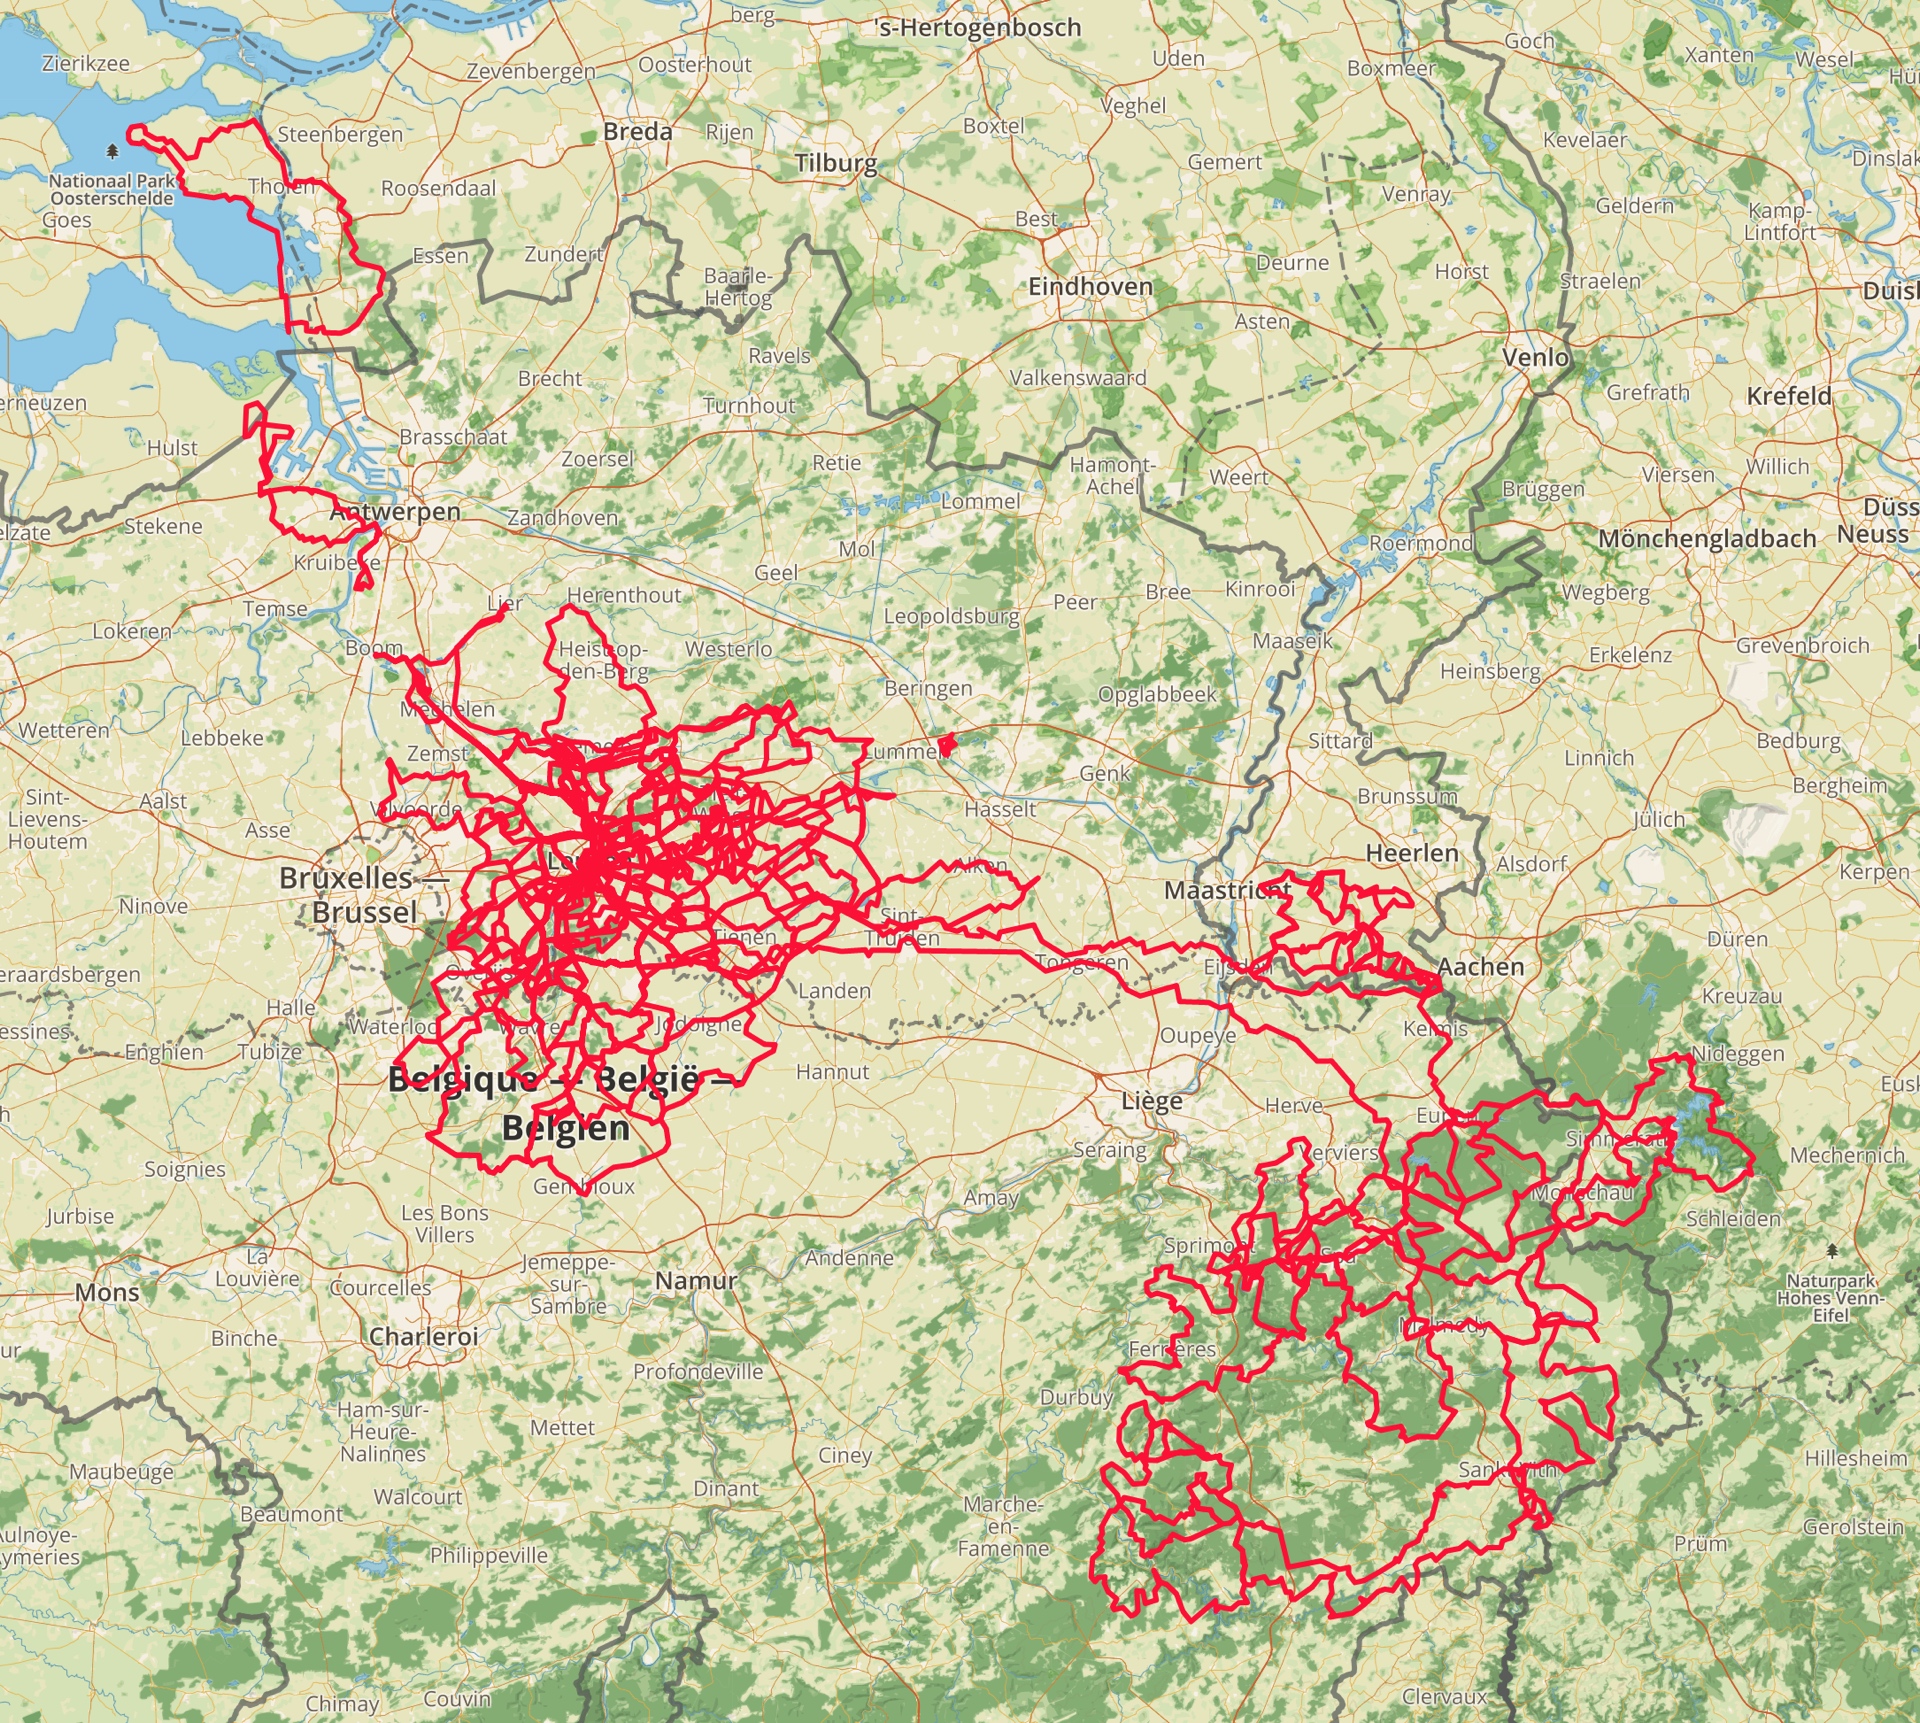
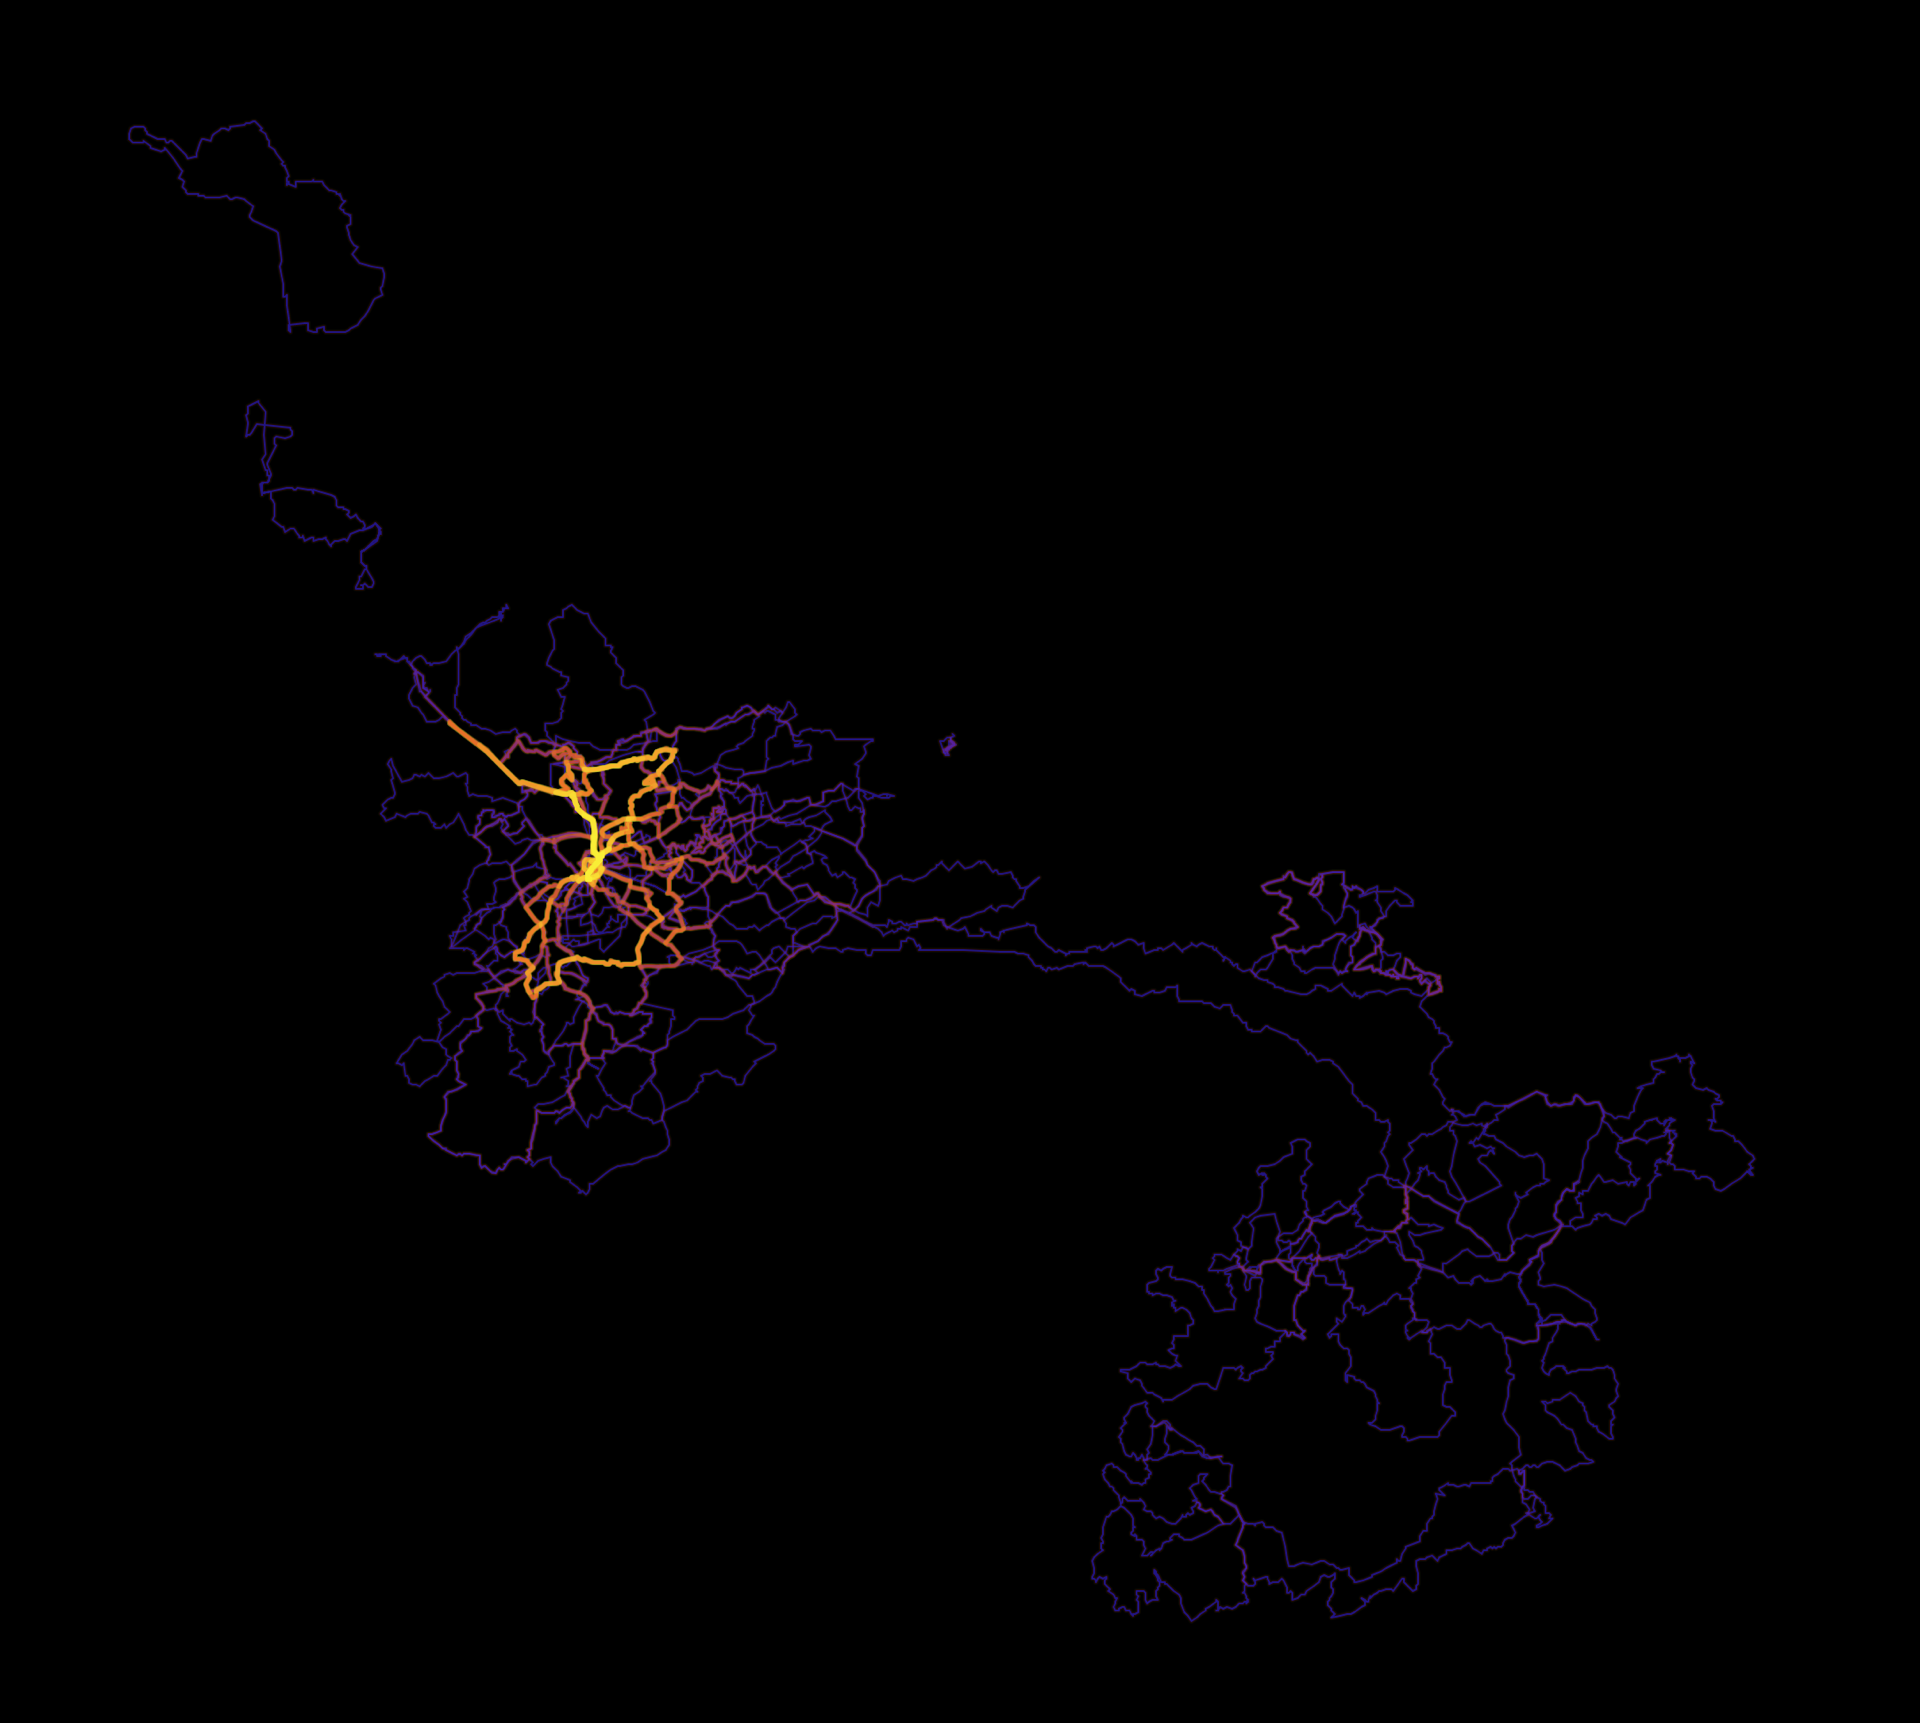
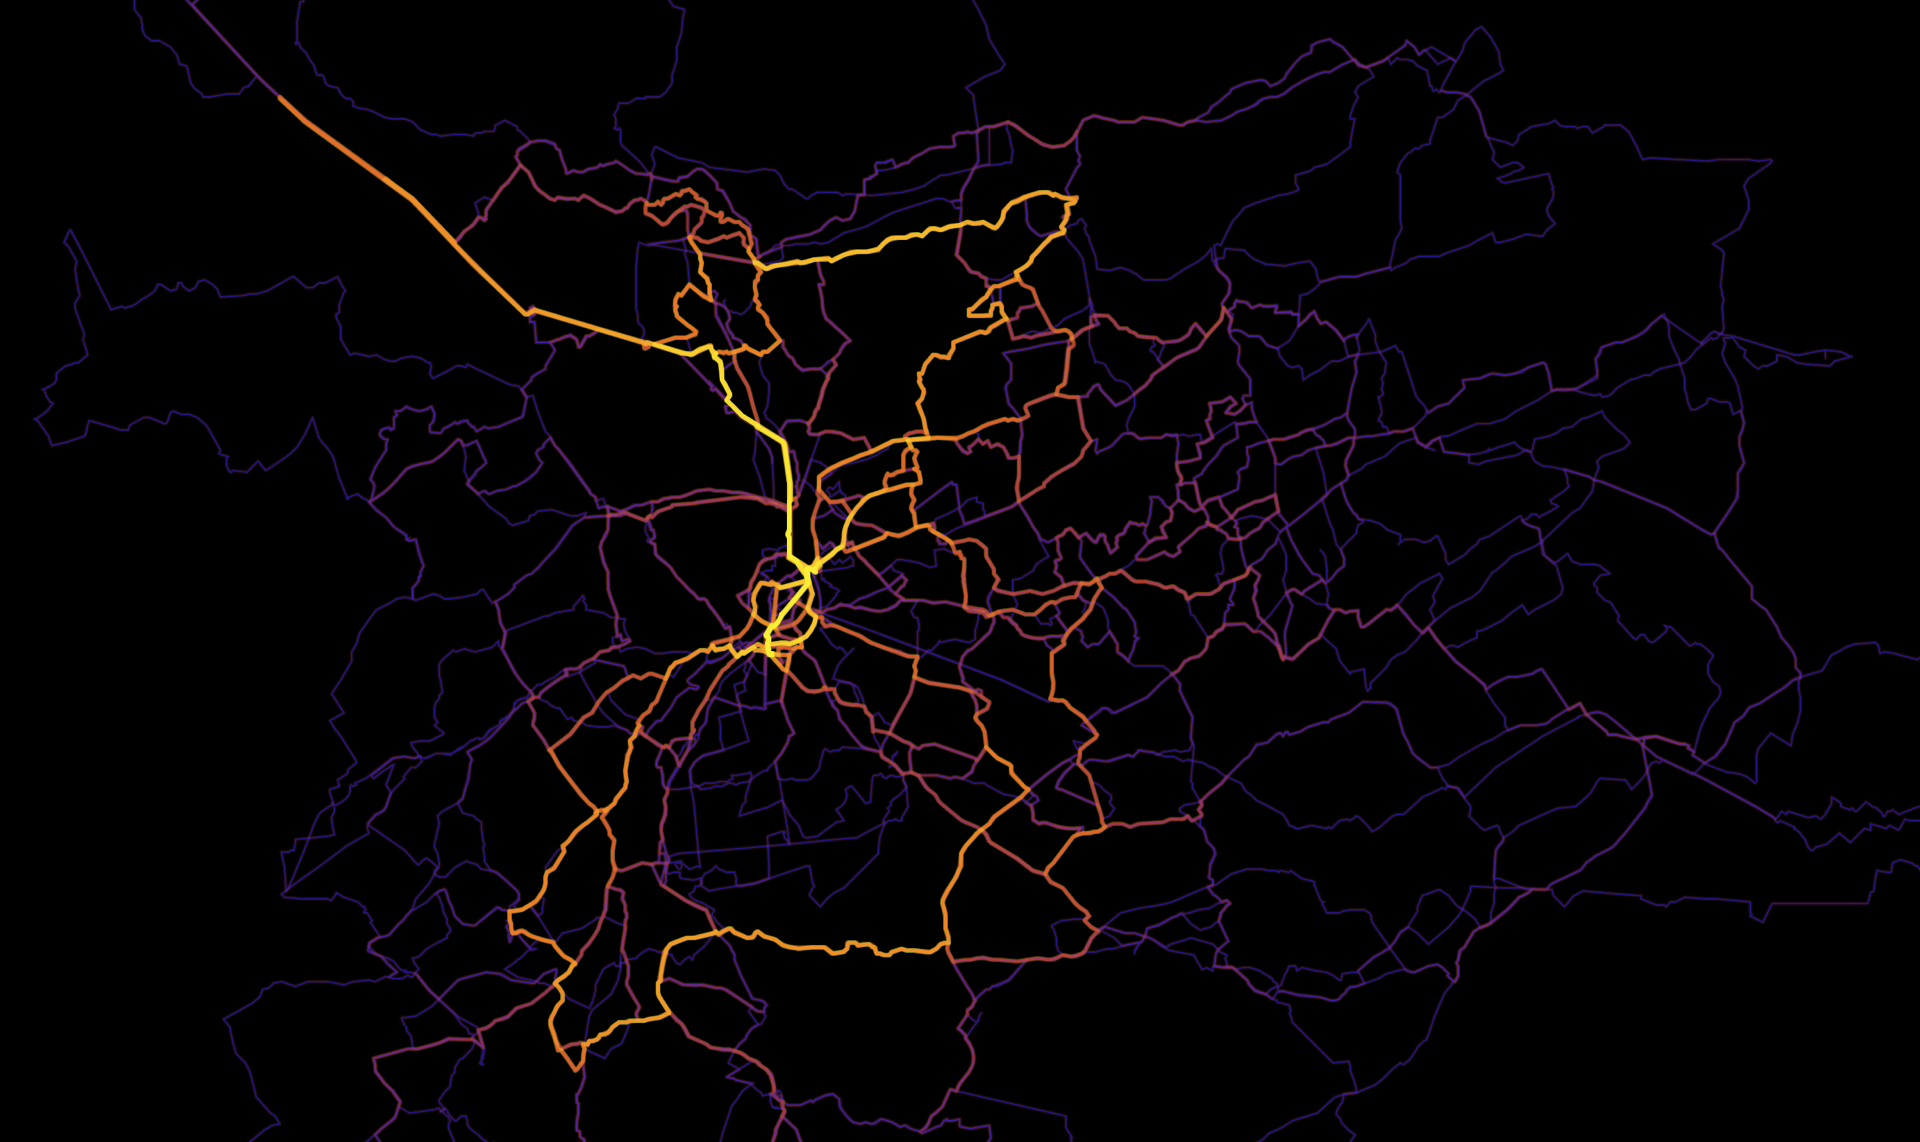
And now it is time to look at some maps and figures. Let’s start with the maps of cycling I have done this year. The first figures show the location and (for Belgium and the area of Leuven on a separate zoomed-in map) heat-map of my rides.

Out of the 155 active days, I rode solo most of the time: only on 44 days was I riding with at least one other person. As usual, most of the time that was Willem (22 rides, and a total time of 2.9 days), or Hao (17 rides, 2.4 days). The distribution of these non-solo rides over the year can be seen below.

The next one is a summary table (click for legible size) of the bikes I have been riding during the year. I used the new Endurance and the old Ultimate parallel until I sold the latter early October (to make space for a new custom built steel bike that I am working on right now).

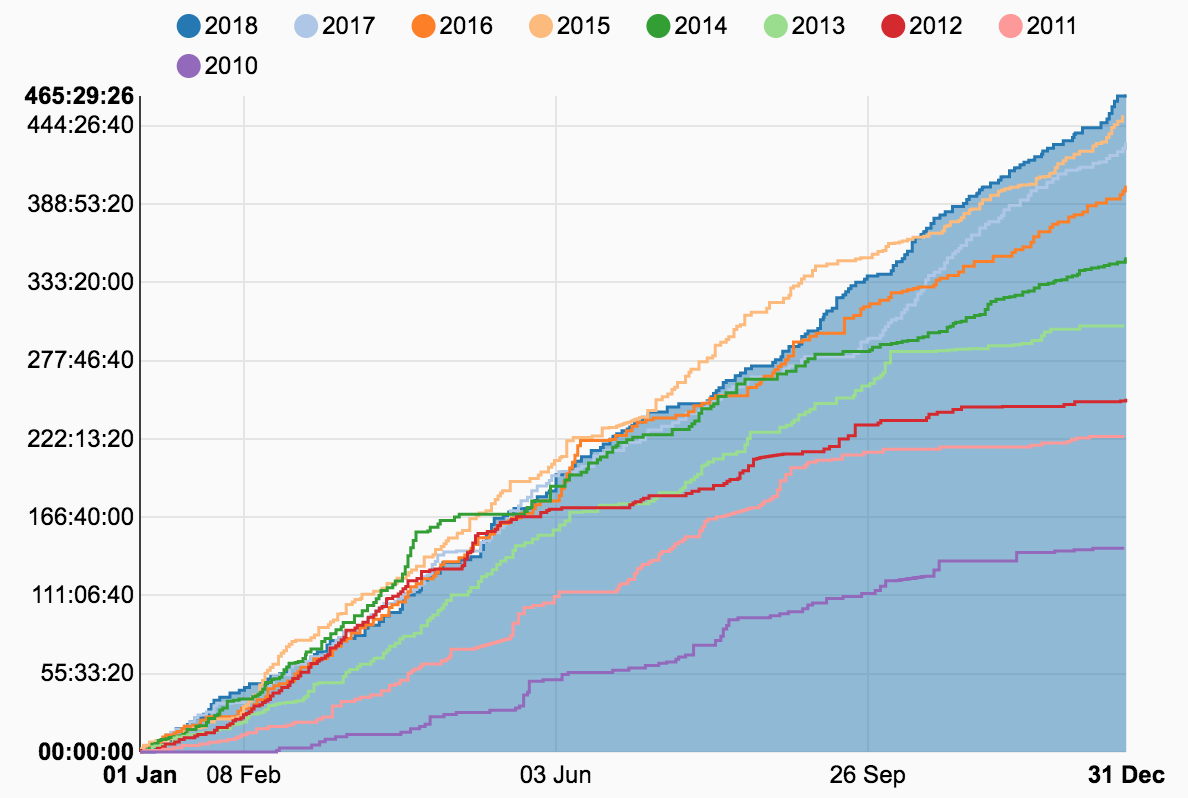
Here are the graphs showing the yearly evolution of my cycling distance, time, and elevation gain compared to the previous years.

New this year are some monthly figures, because the more the merrier, right? So below you will find the monthly totals and averages for distance, elevation gain, activity time, average steepness (meters climbed each kilometre on average), and average temperature.

My non-cycling activities reached a long-time low, with only a tiny bit of hiking (17 km), and kayaking (4 km), so this is the first time since 2012 that I did not run at all (and I did not miss it to be honest). Here is the usual summary figure (including all activities) from VeloViewer.

Finally, here is an overview of the evolution of the total activity time (also an all-time record with 465 hours), and its distribution across the calendar throughout the years.

The longest lunar eclipse of the century

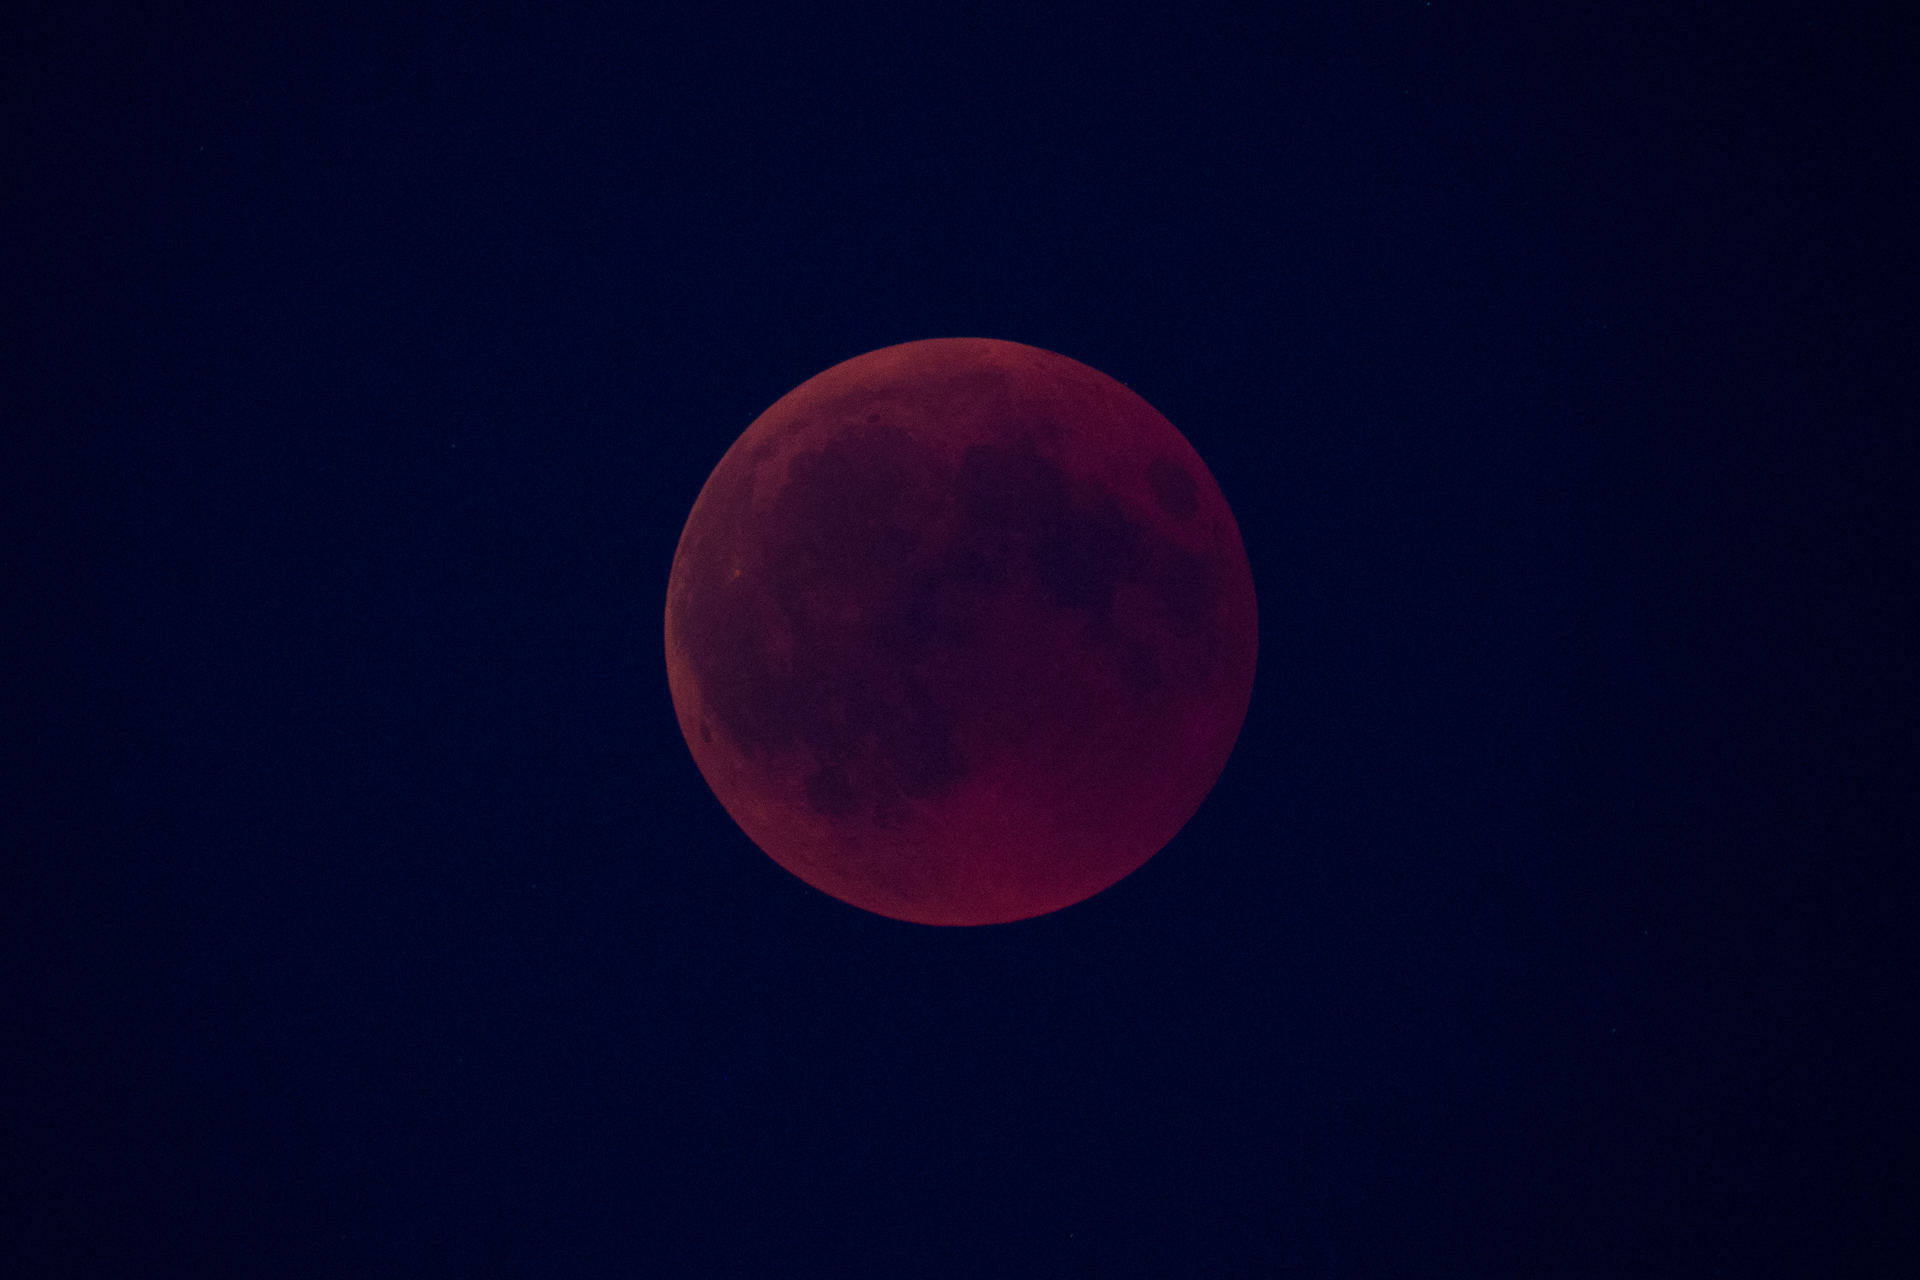
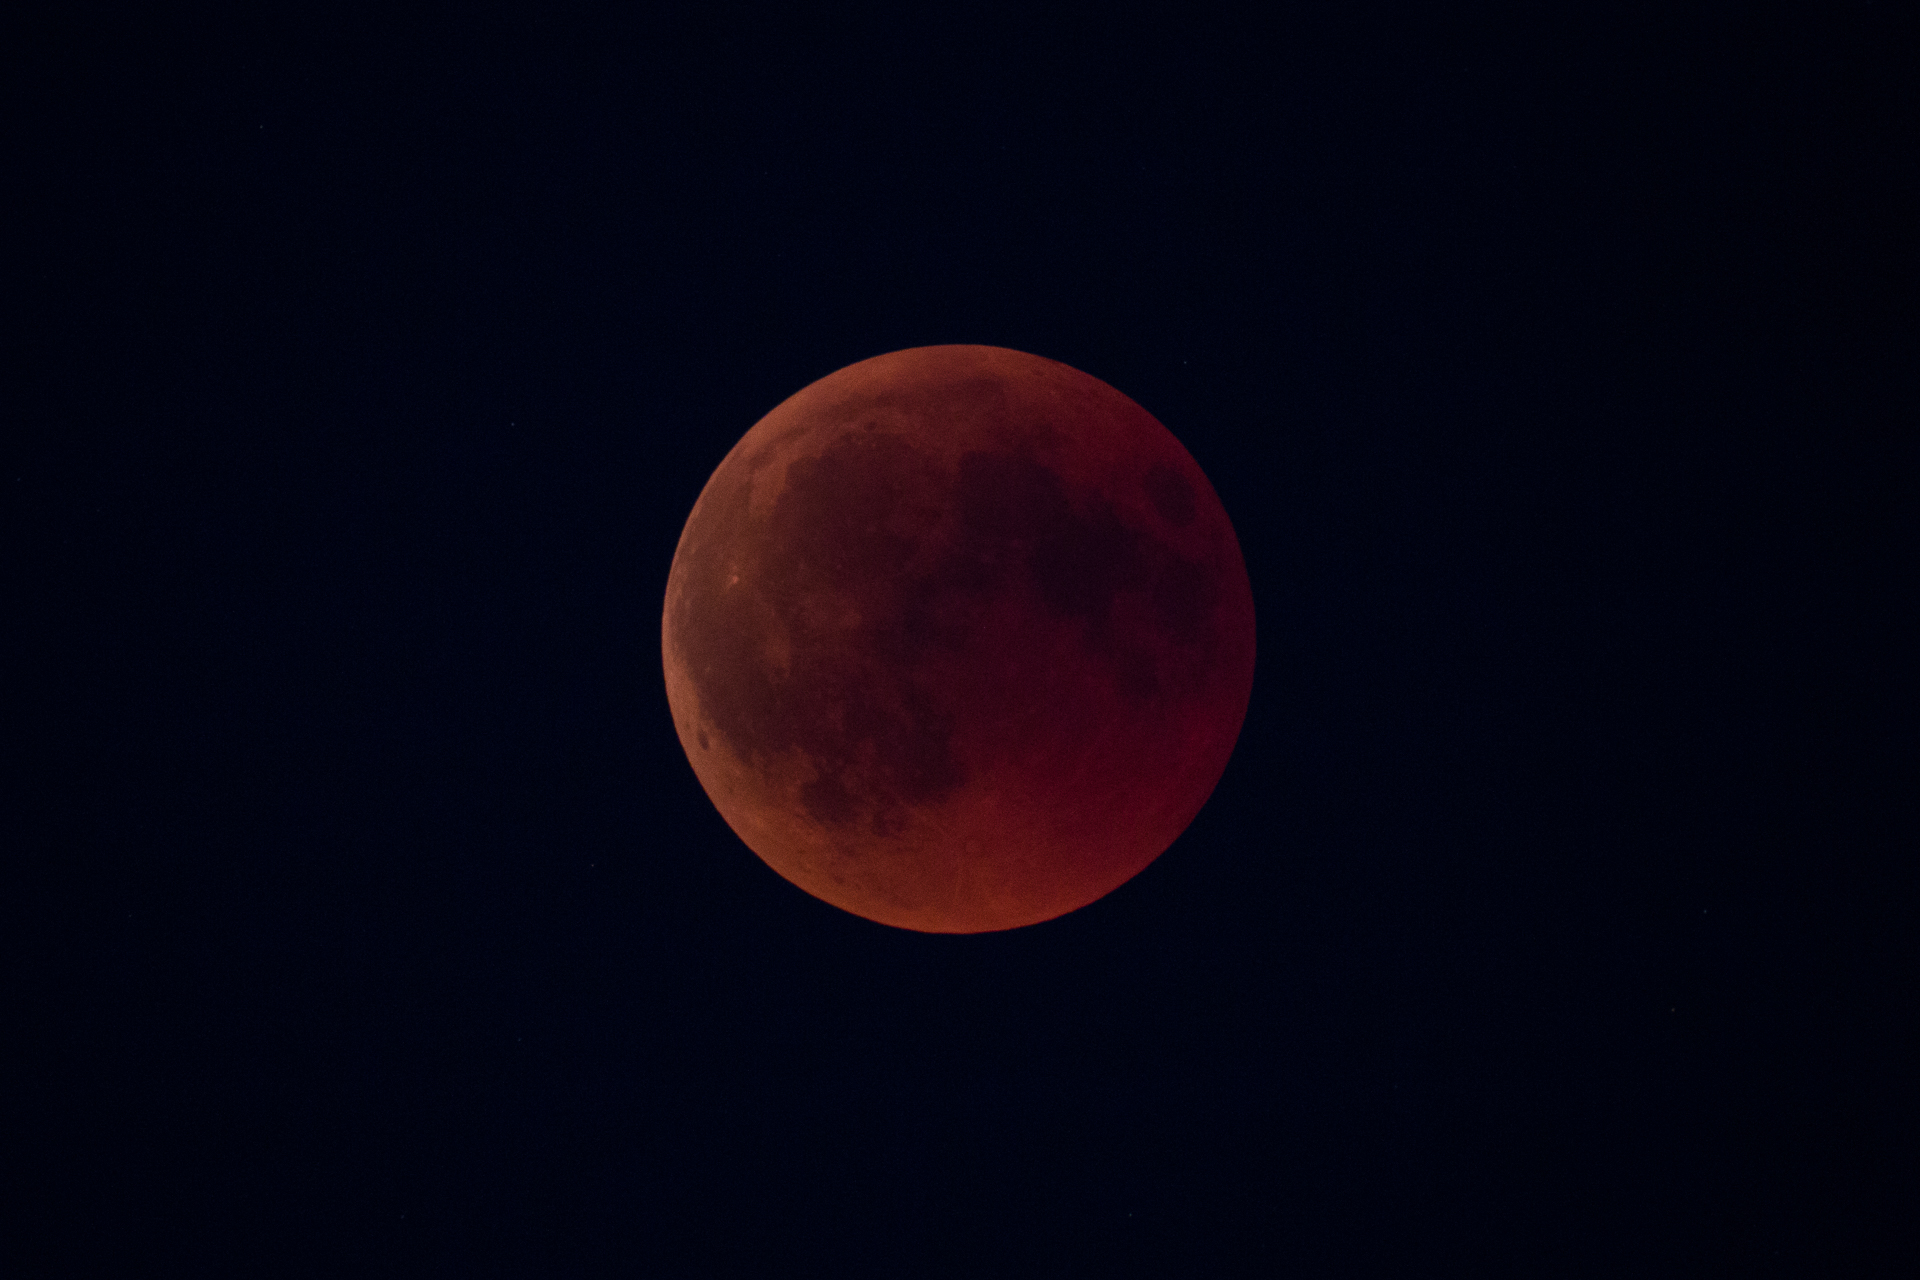
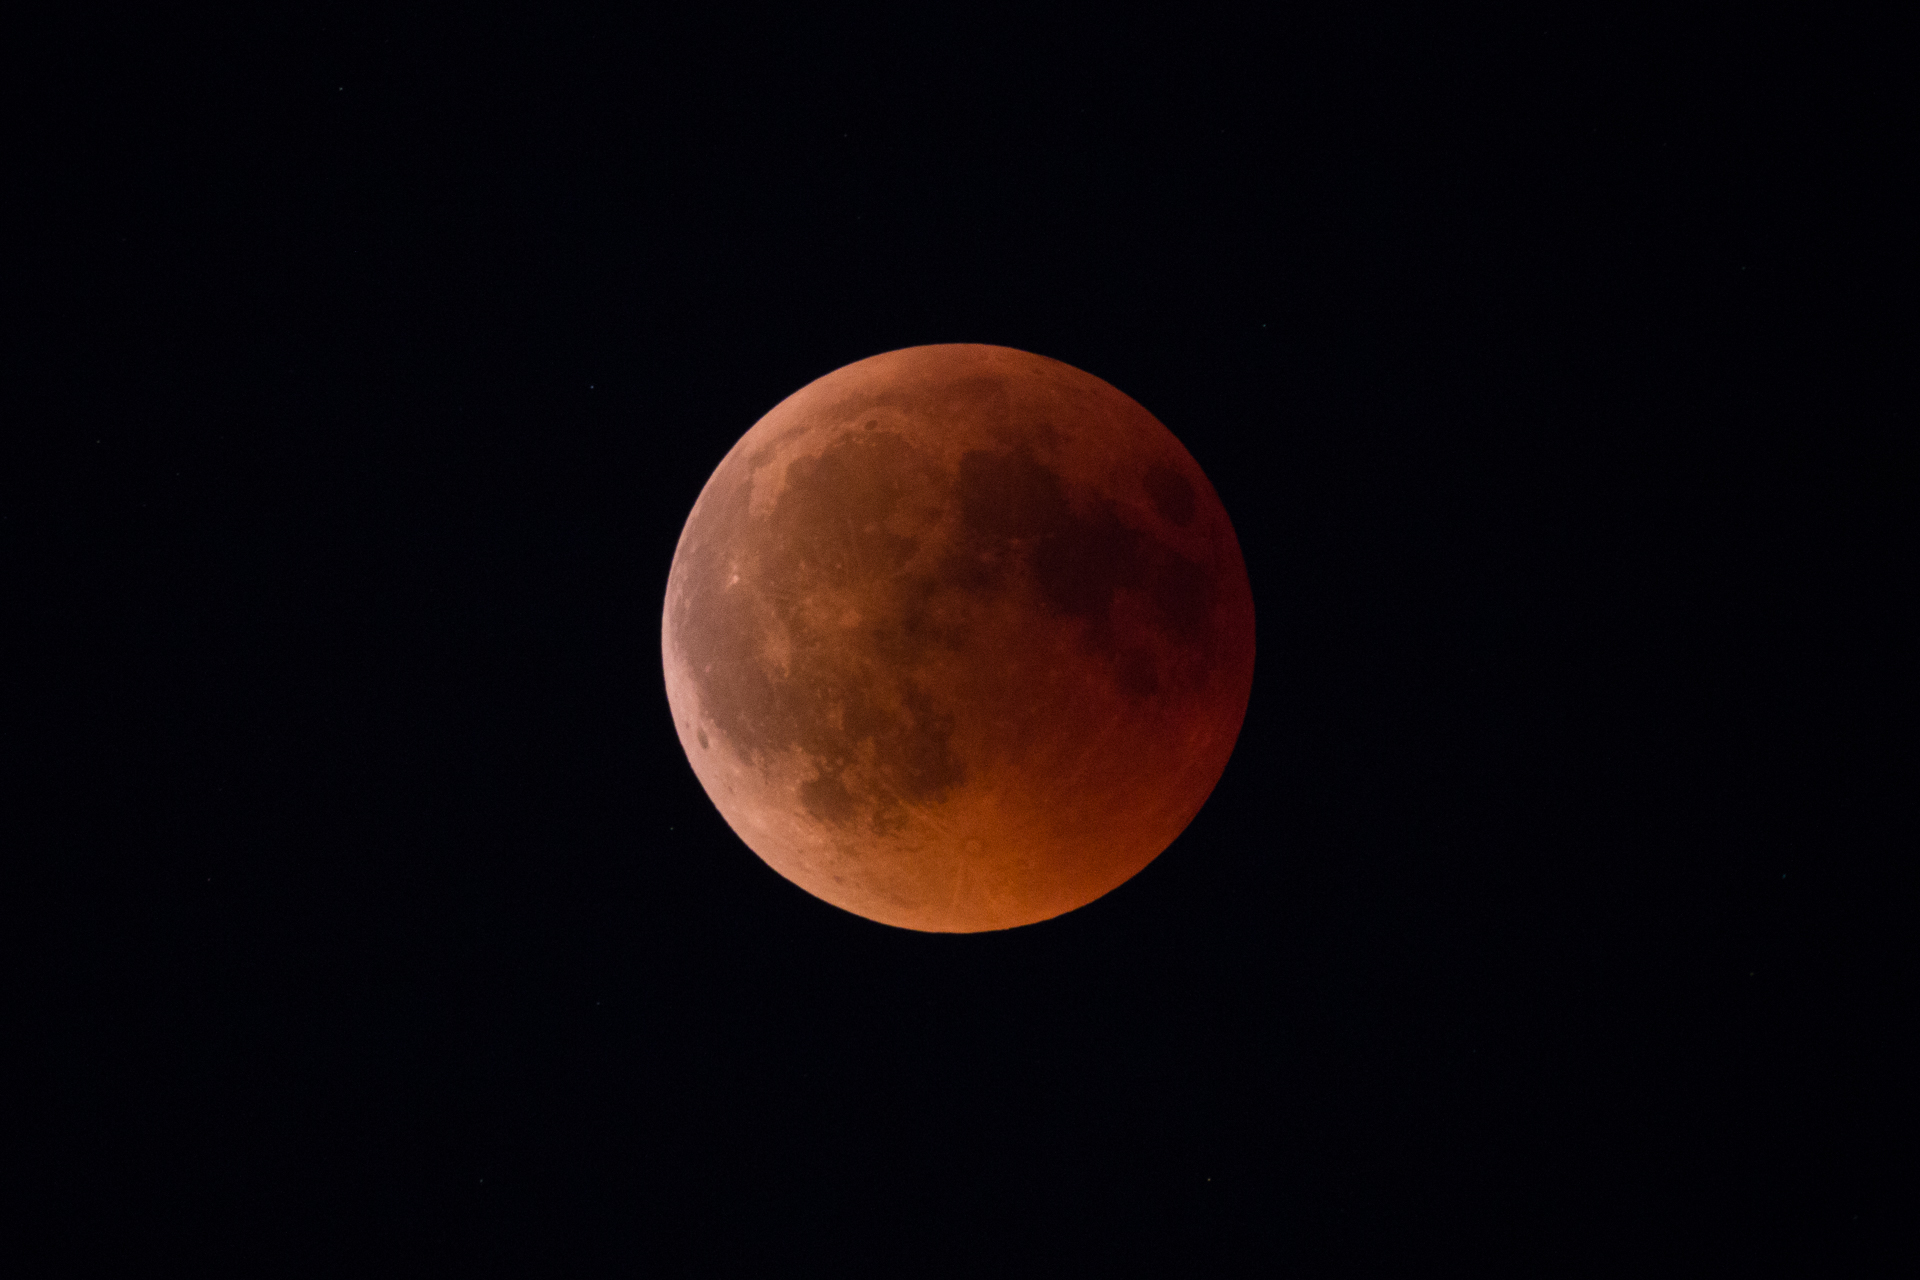
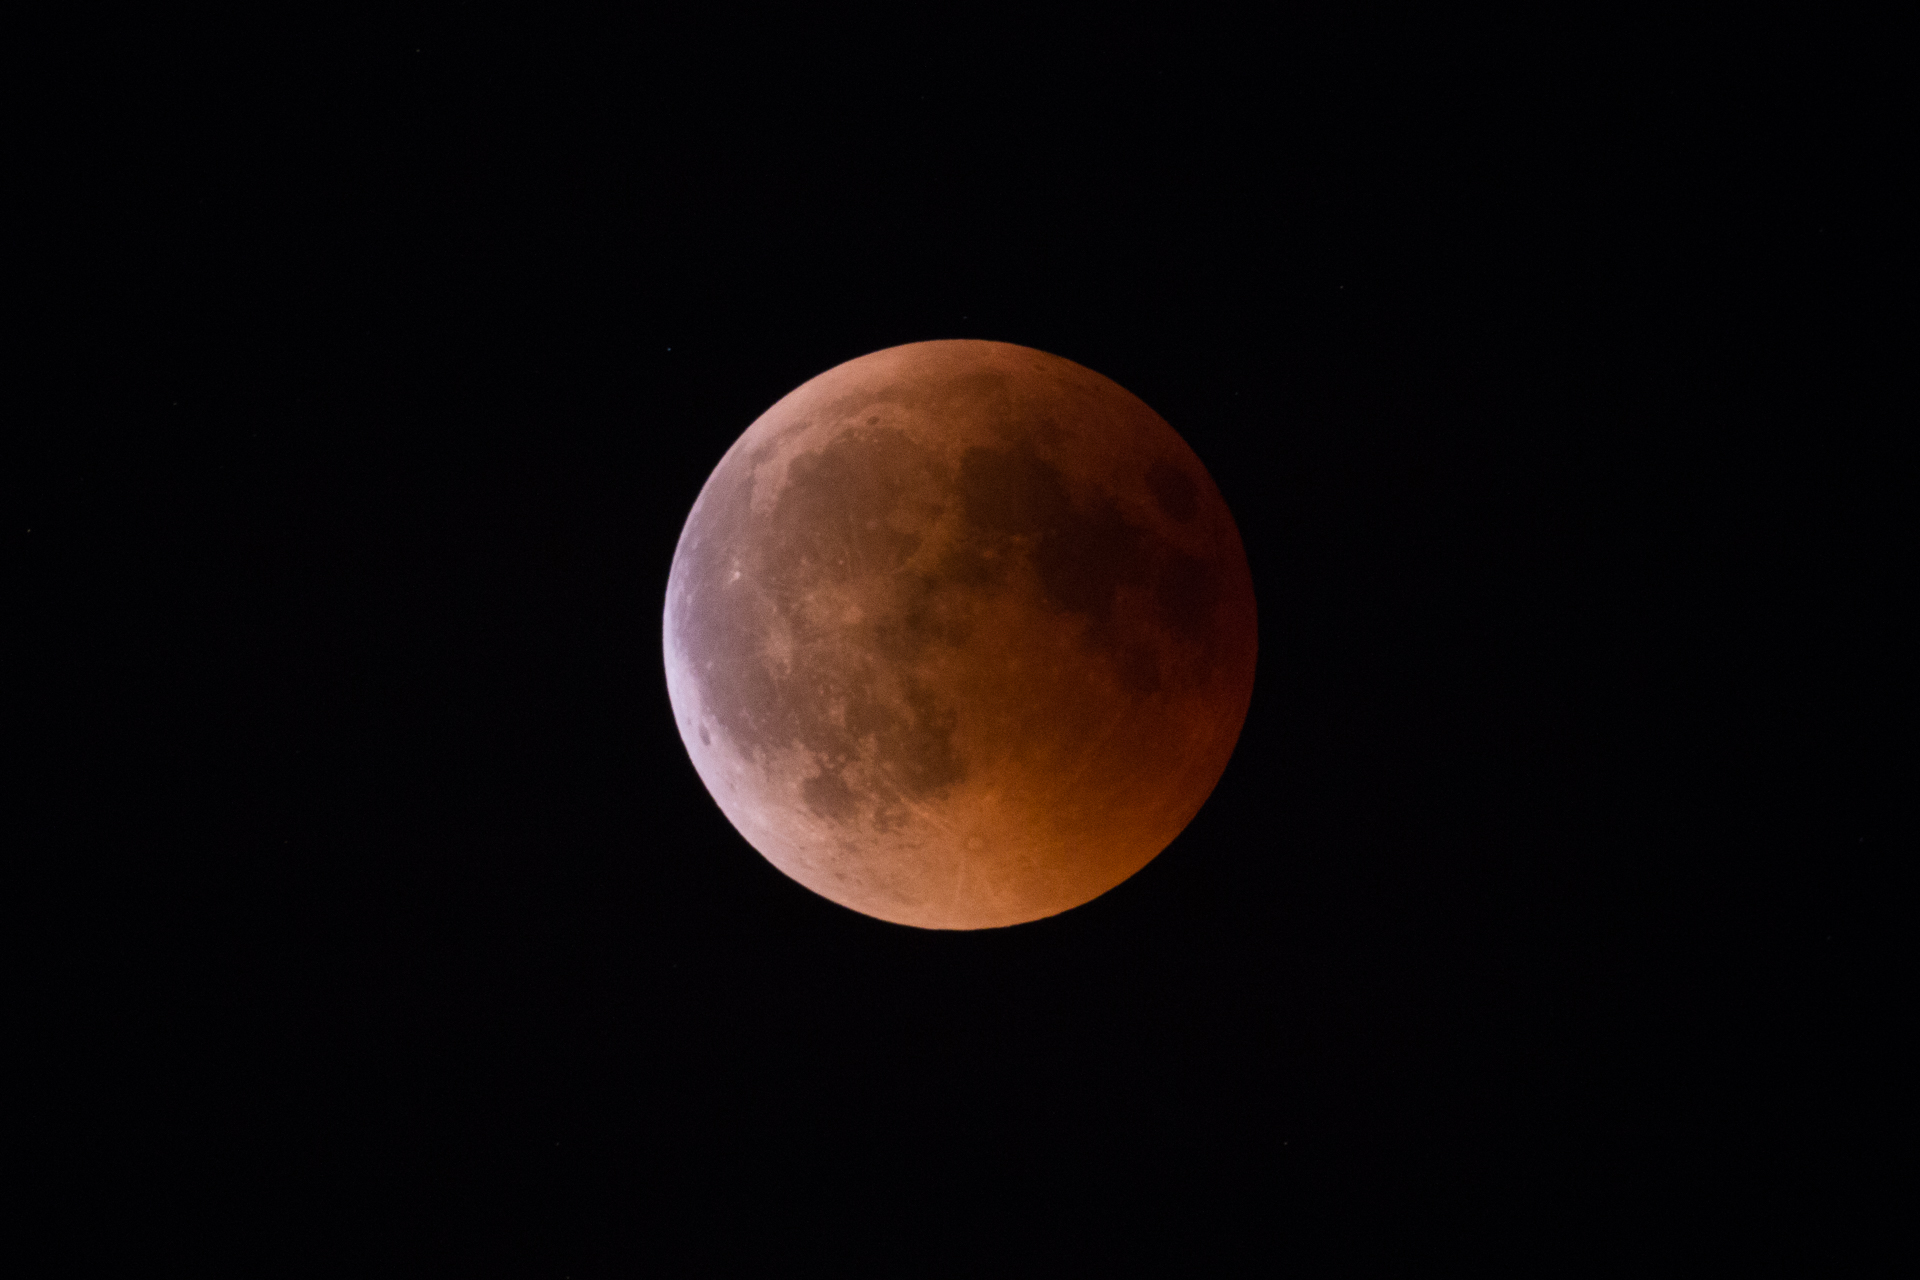
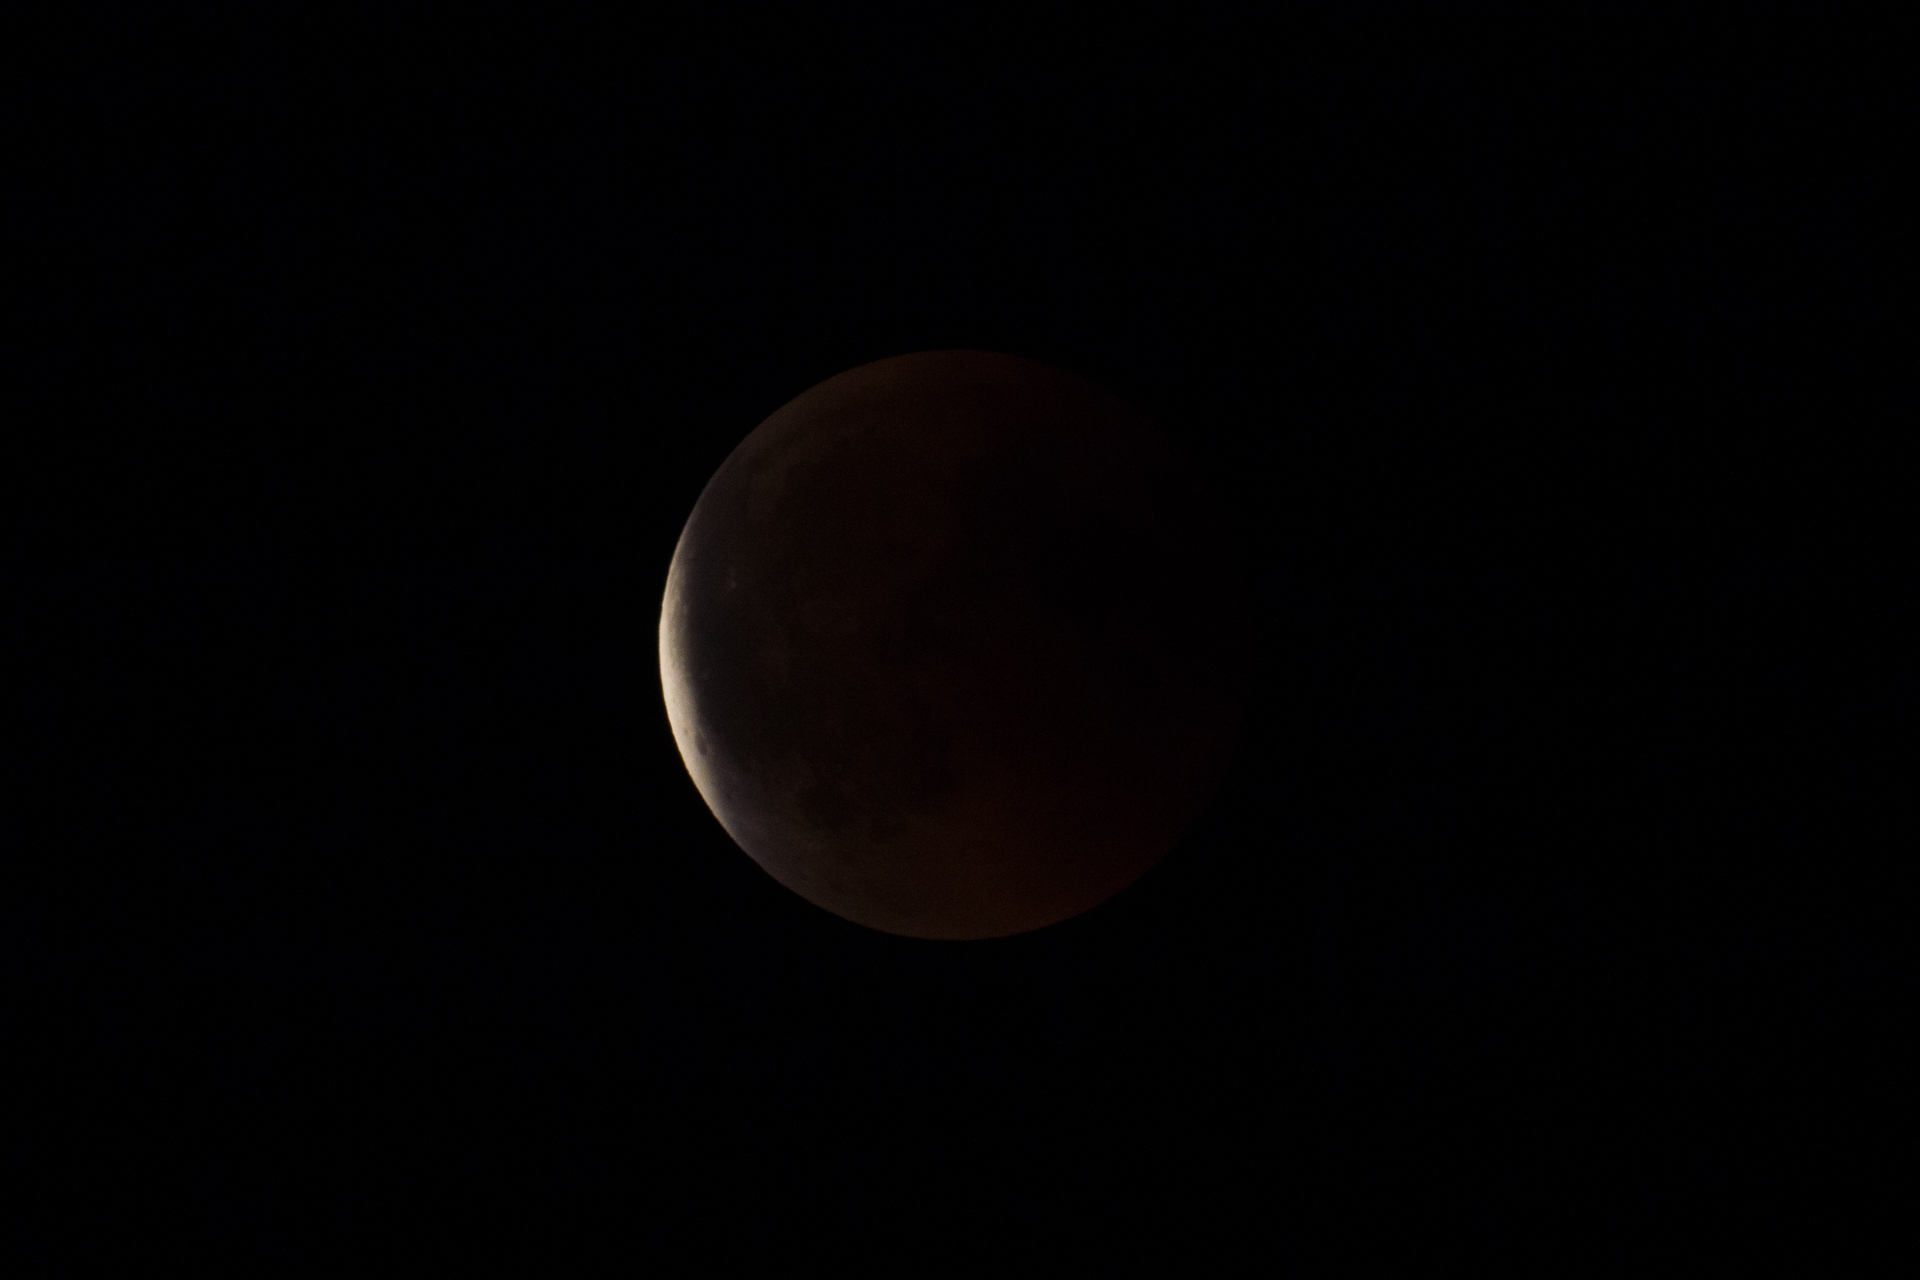
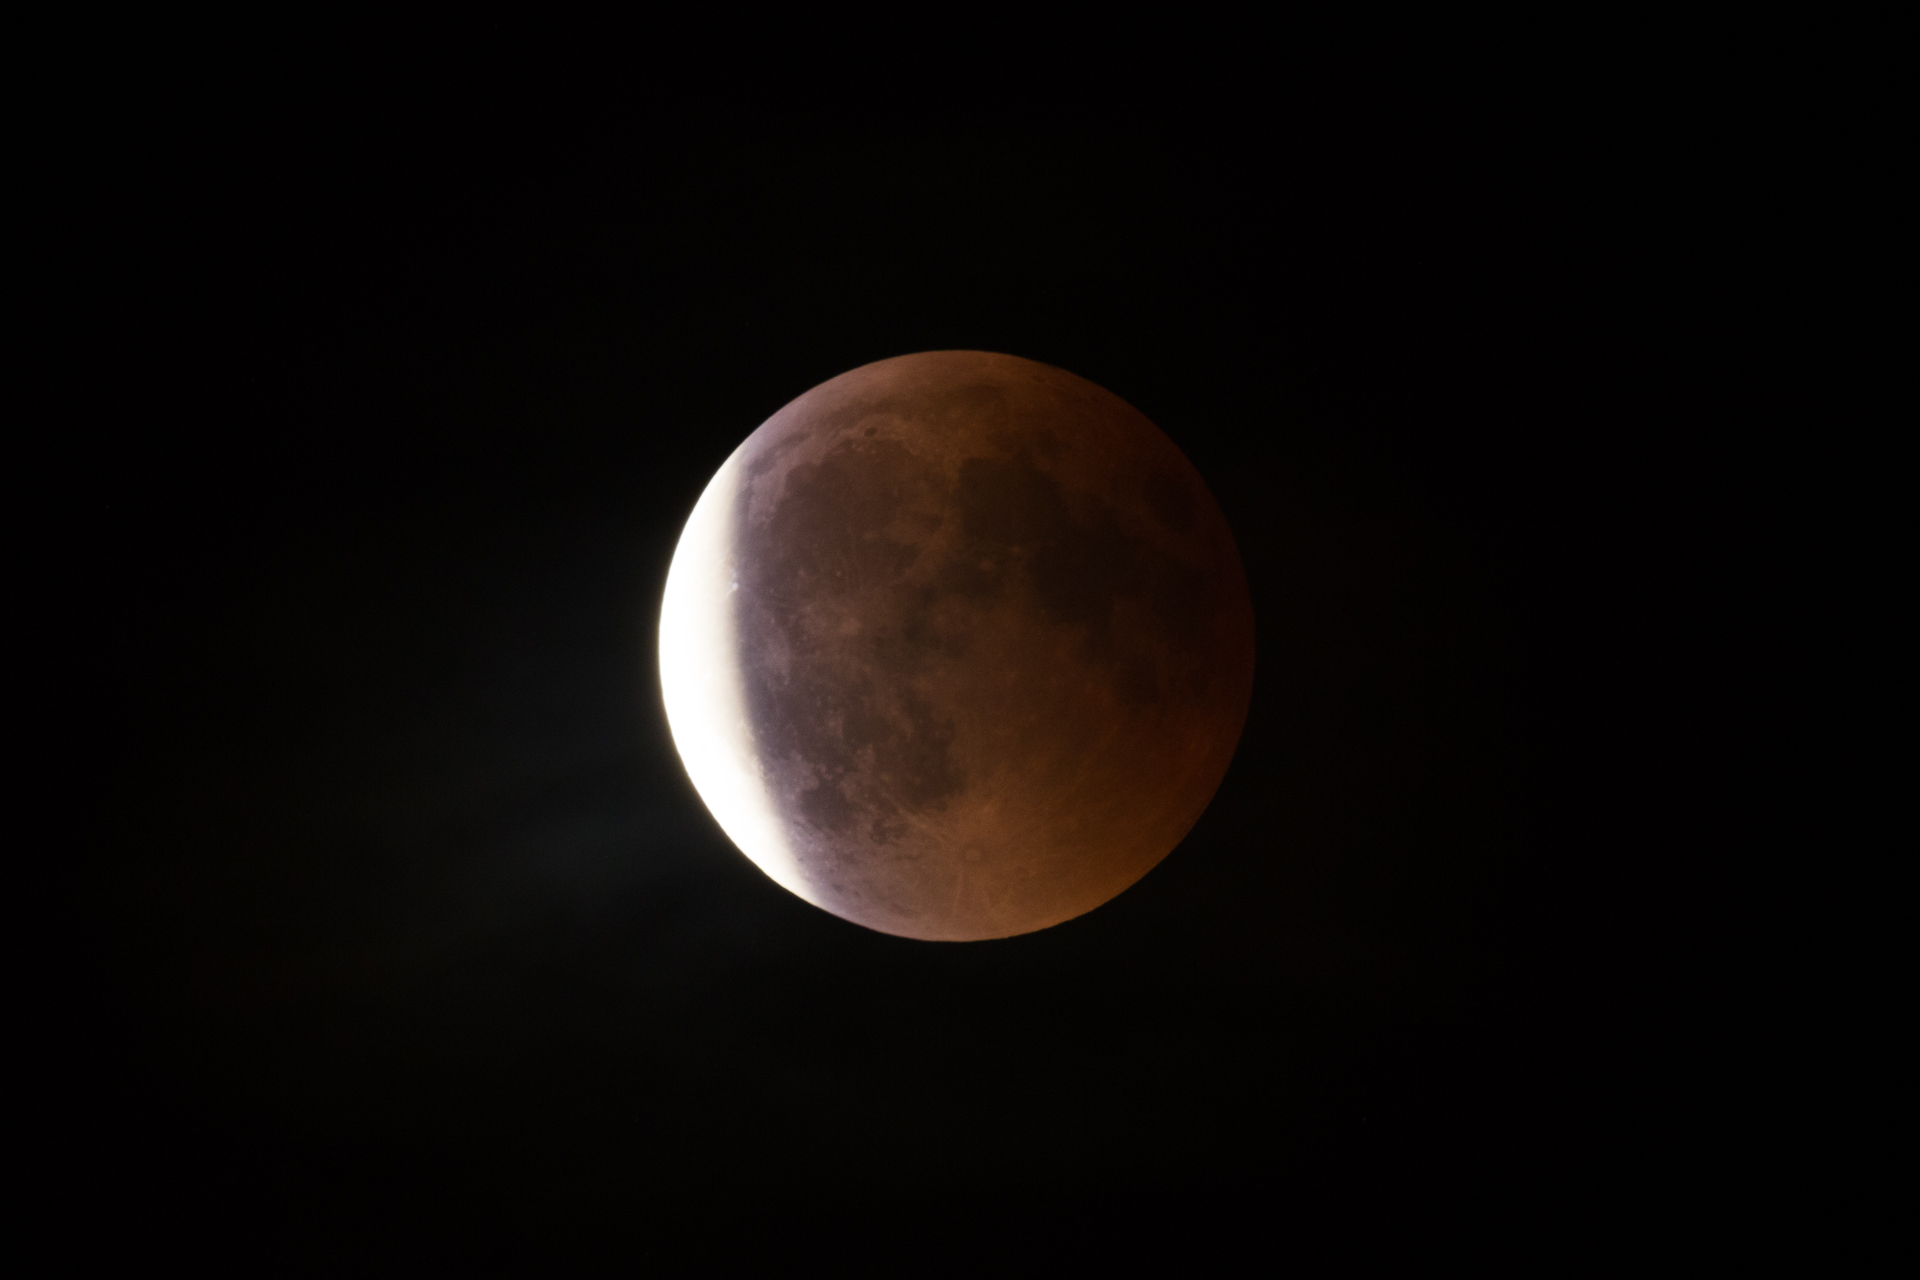
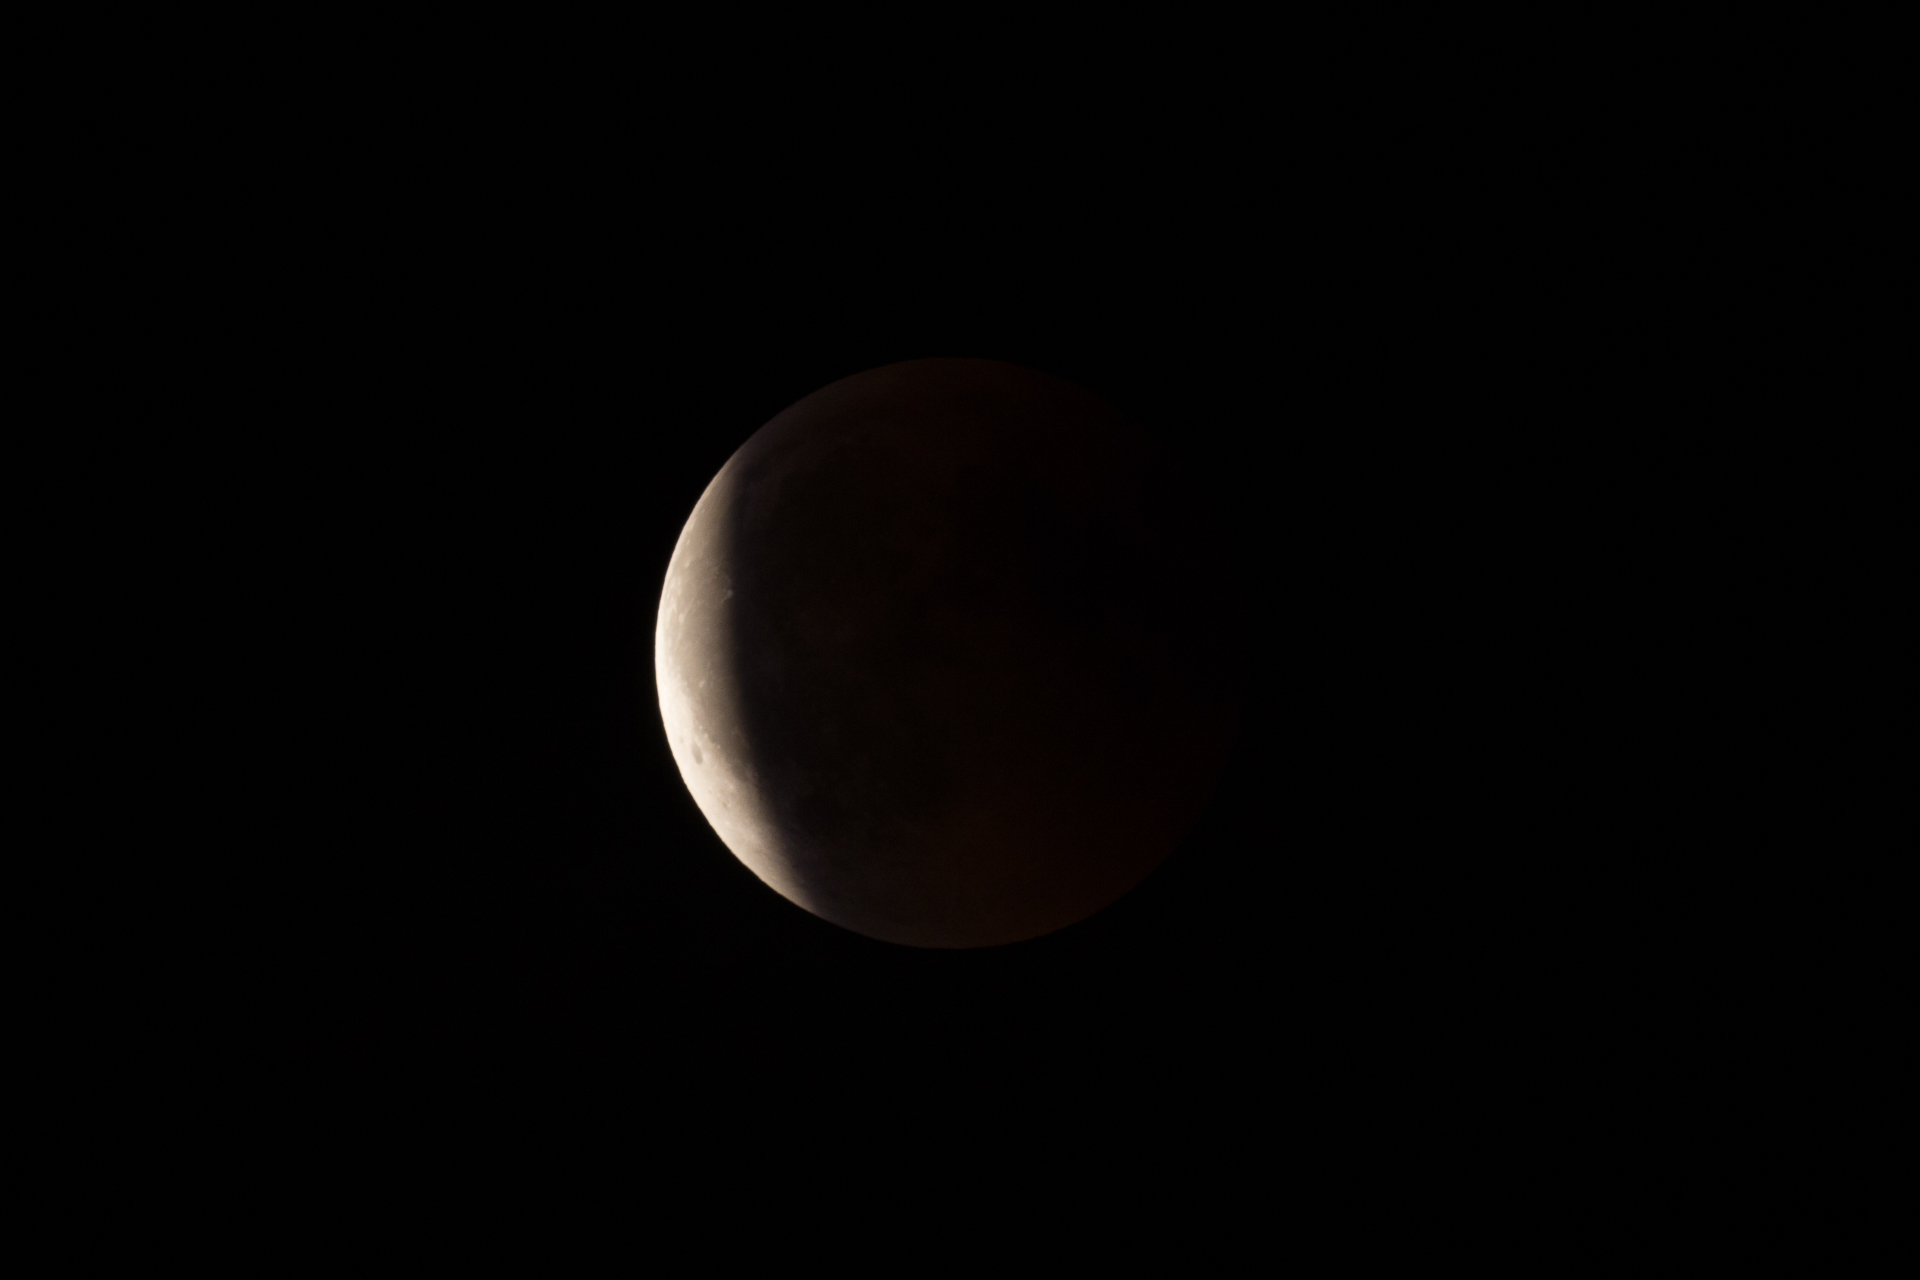
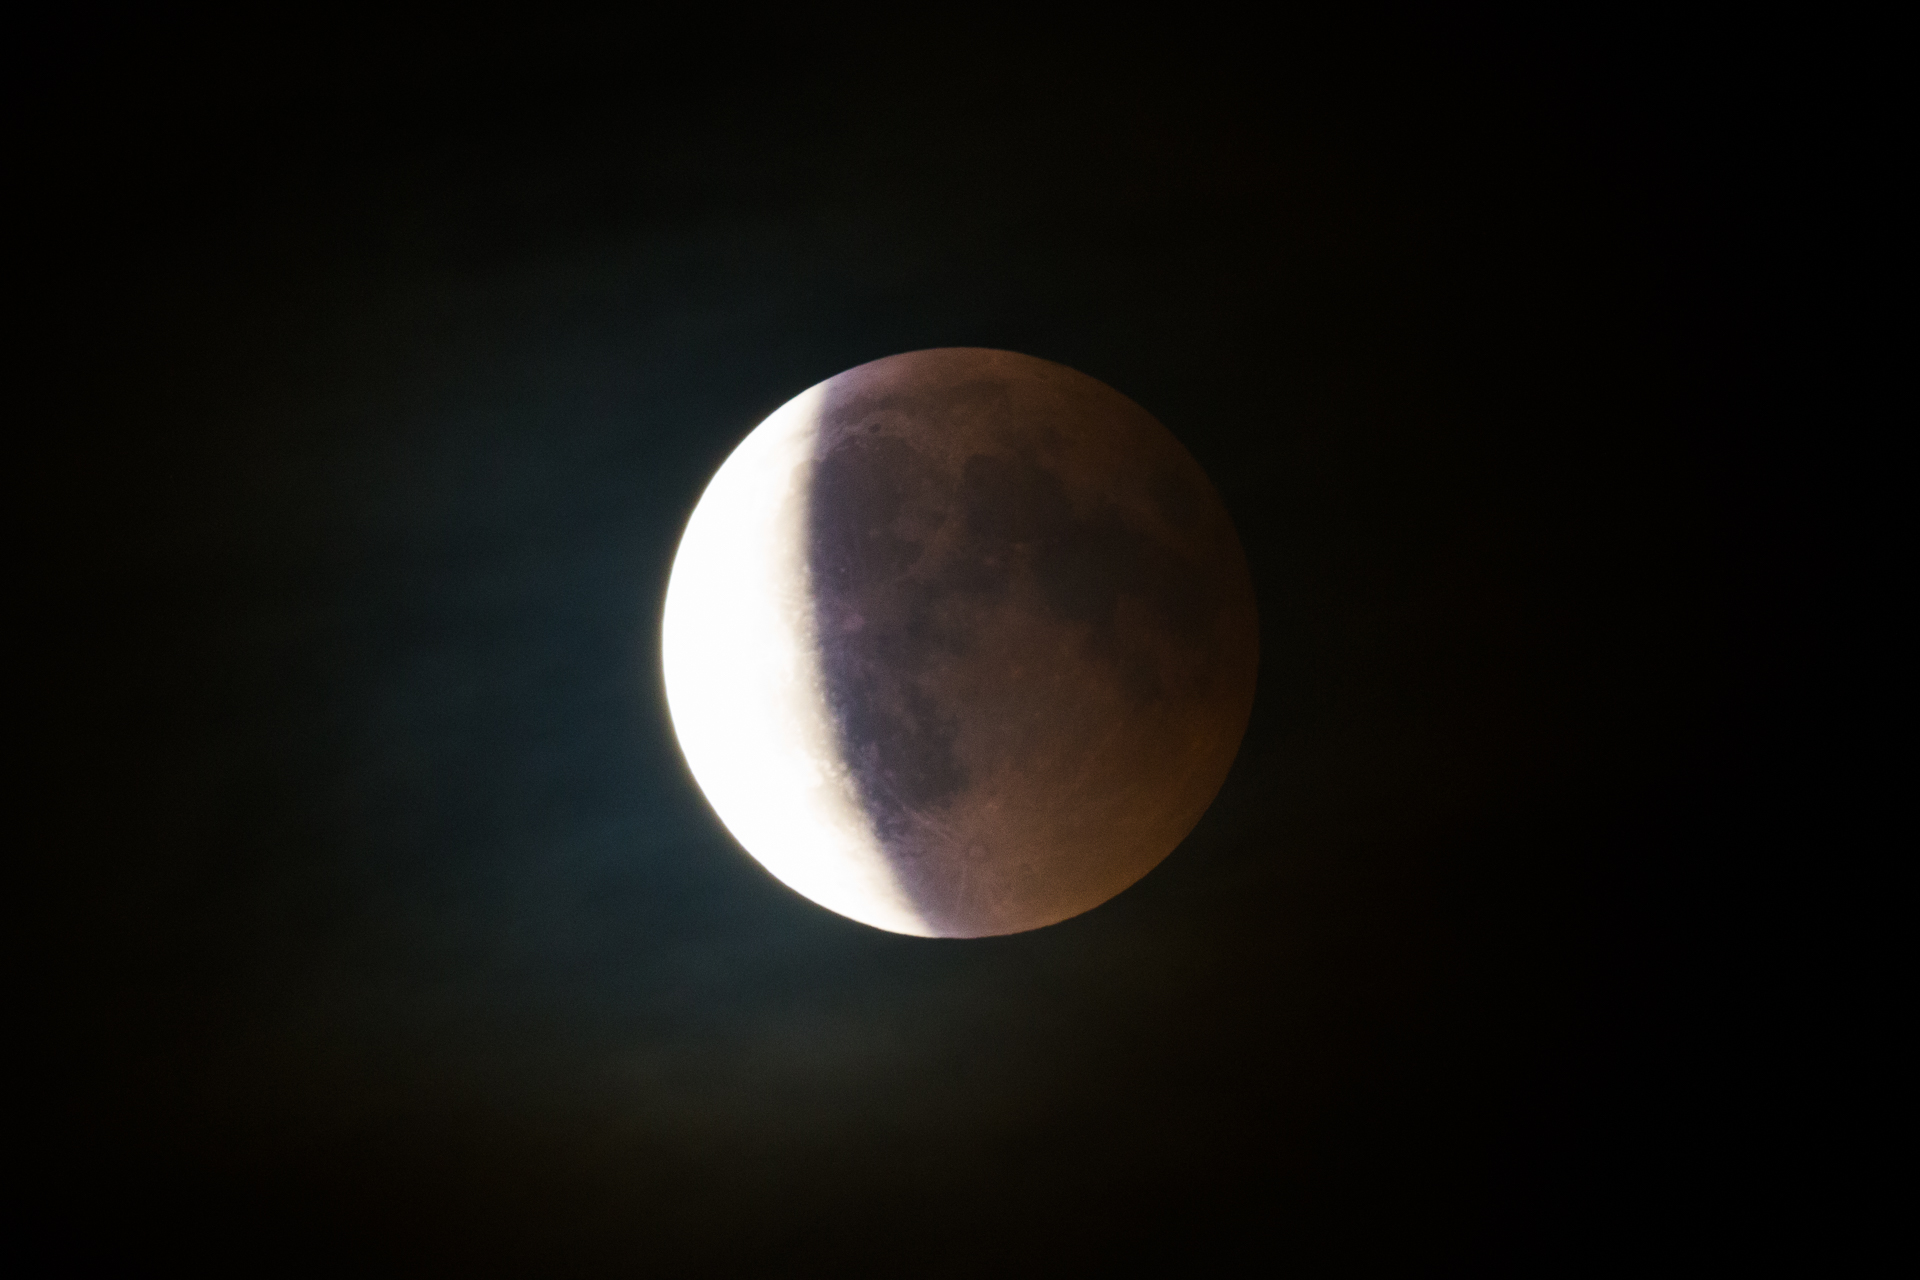
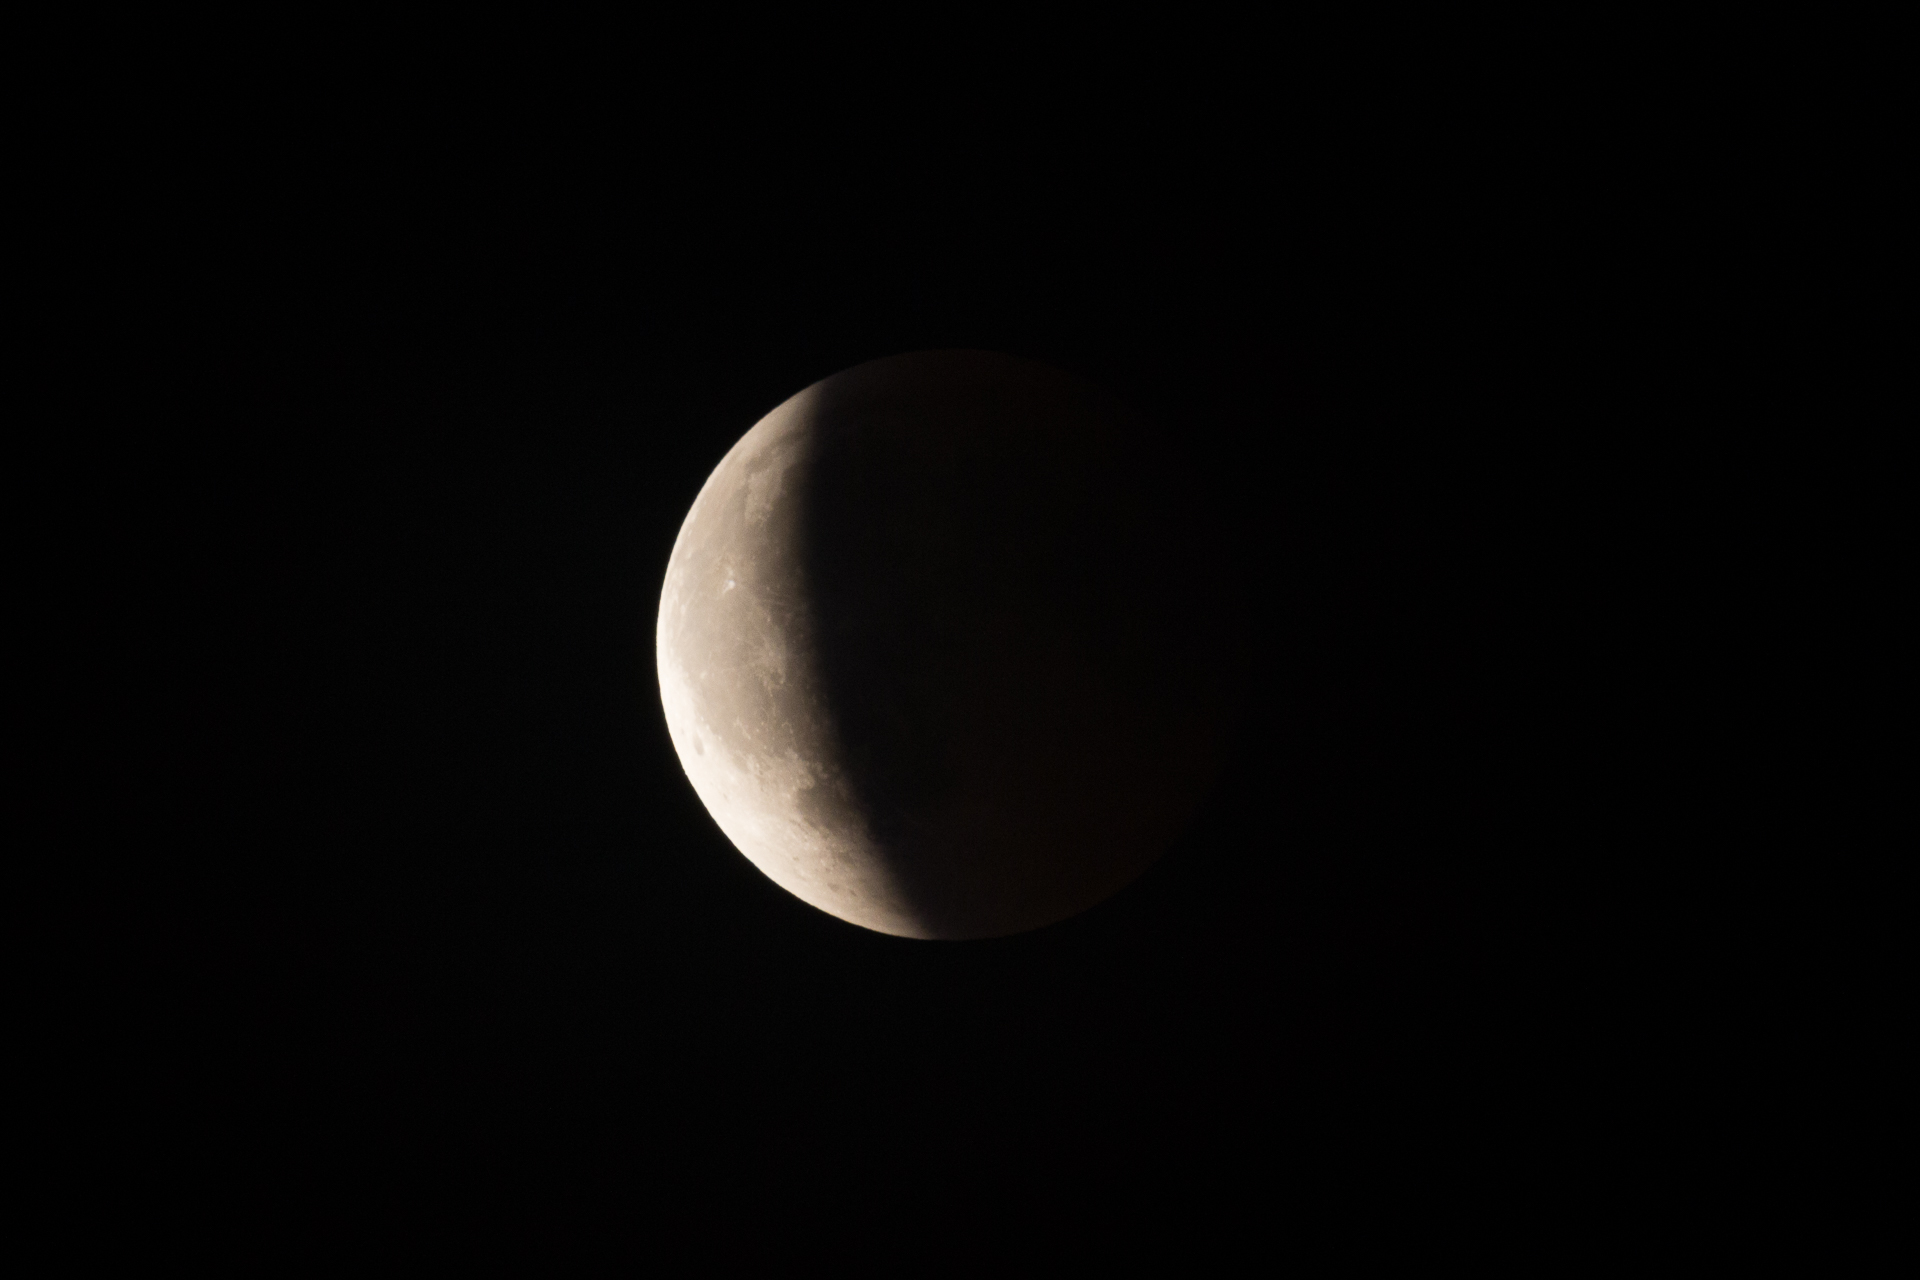
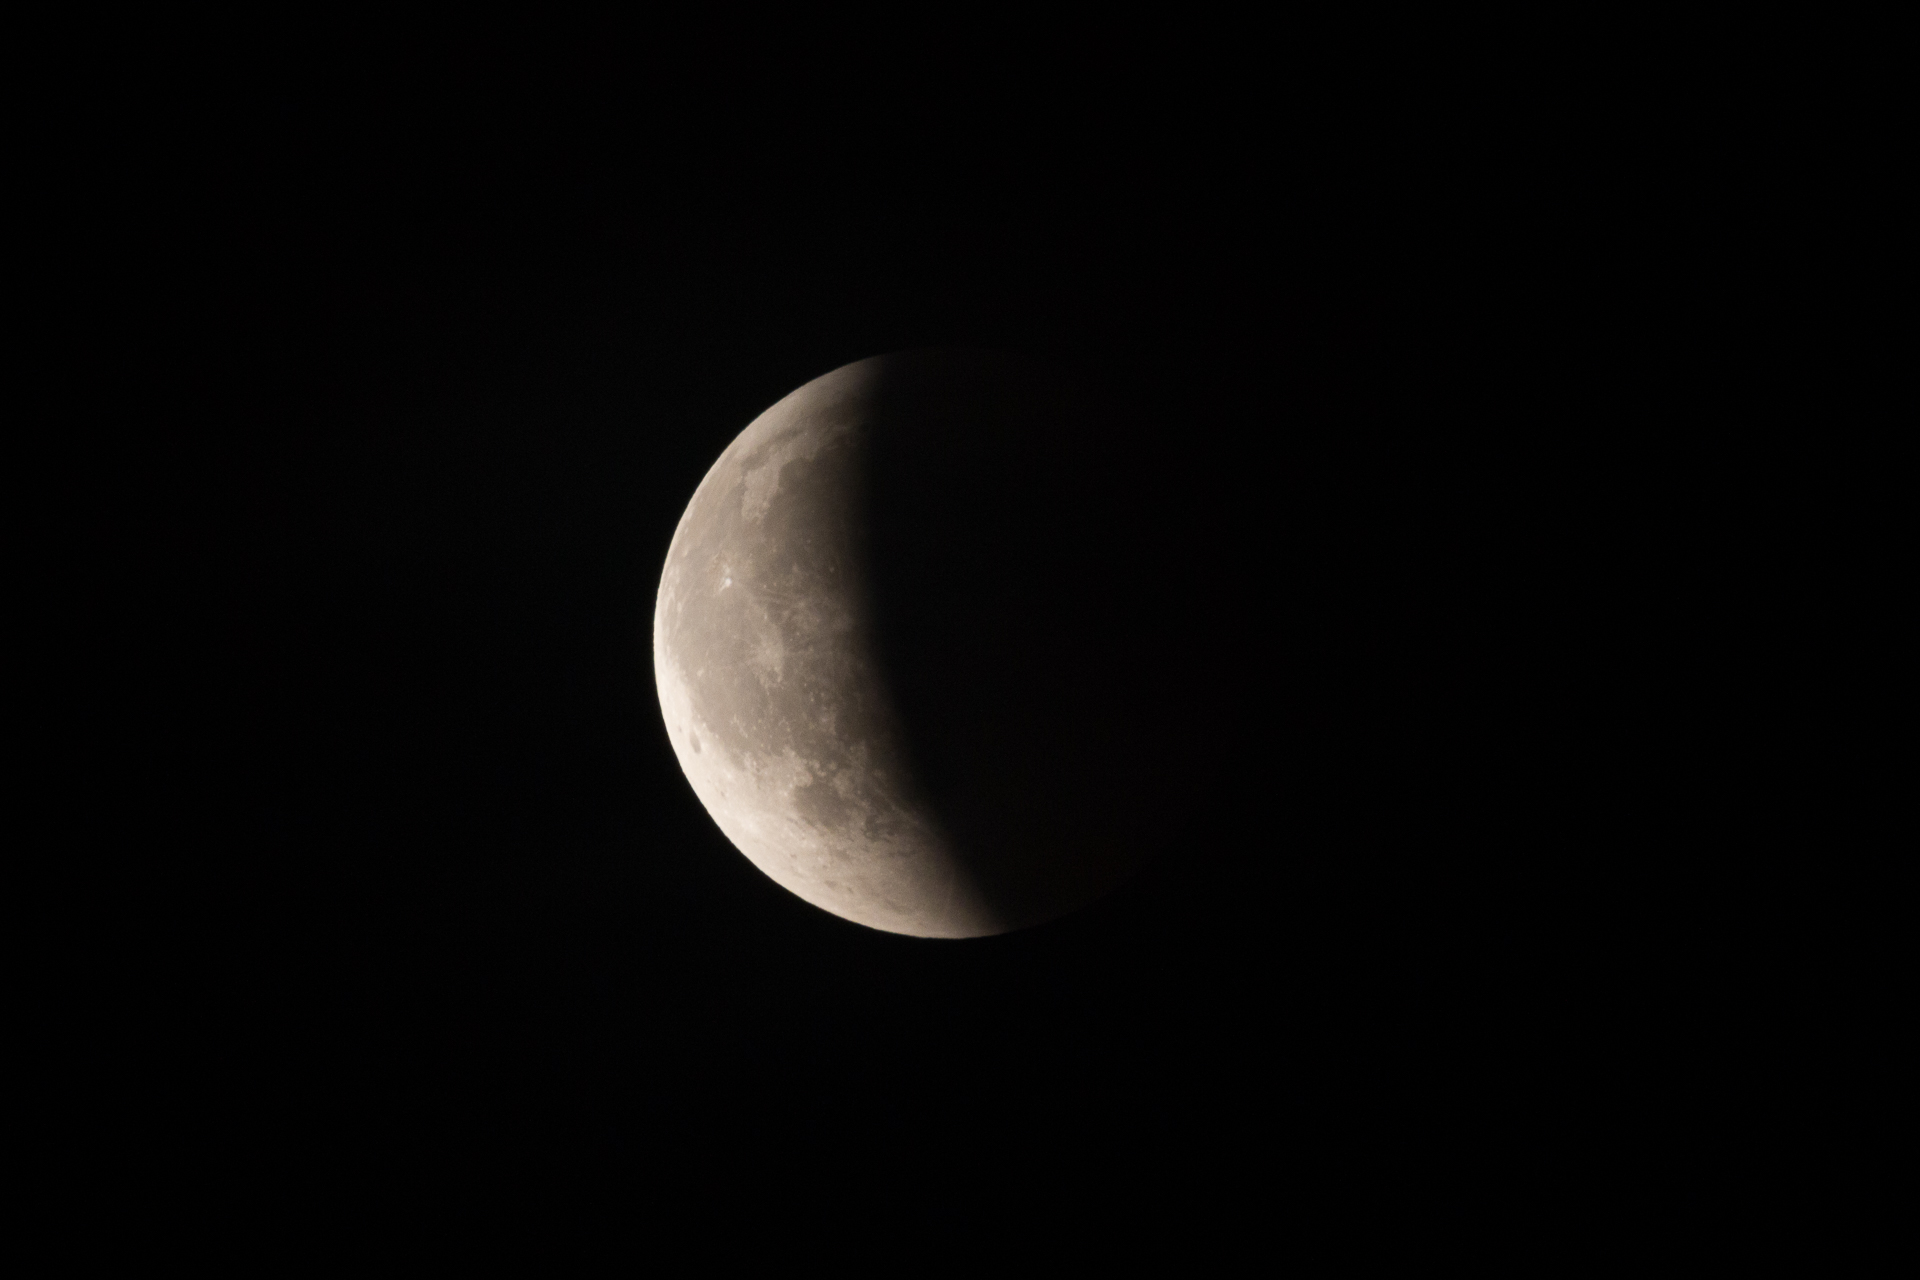
The longest lunar eclipse of the 21st century was a good occasion/motivation for me to do a bit of astrophotography again (after my wide-field adventures on La Palma last year). I wanted to take some close-up pictures of the Moon, so I bought a relatively inexpensive and compact 1000 mm f/10 Maksutov Telescope (from TS-Optics). My Sky-Watcher Sky Adventurer mount could still take the combined weight of this and my Canon EOS 6D camera, but my old Manfrotto tripod proved to be not exactly as stable as hoped for at this focal length… Of course I did not notice this during my test shots a few nights before the eclipse, because back then there was no wind at all, but later during the eclipse itself the vibrations caused by gusts were quite a bit of a problem.

The day of the eclipse was the hottest day of summer so far (although today might have broken that record), but also the last day of a heatwave, and as such, storms were closing in on the low countries from France during the afternoon. Looking at the satellite pictures and the weather models I was pretty sure that it would not stay clear in Leuven, so we got into the car and drove an hour (93 km) to the East – away from the storms – and set up the equipment on the Southern flanks of the Fort d’Aubin-Neufchâteau (which I scouted on Google Maps making sure that the view towards the Southeast would be more-or-less unobscured, as during the eclipse the Moon would stay quite close to the horizon).

20180727_LunarEclipse-1

The moon rose already fully submerged inside the shadow of the Earth, so it was very difficult to spot it in front of the bright background of the evening twilight. By the time I found Polaris (and aligned the tracking mount to be able to follow the movement of the Moon during longer exposures), the eclipse was just past its maximal phase.

20180727_LunarEclipse-2

20180727_LunarEclipse-3

20180727_LunarEclipse-4

20180727_LunarEclipse-5

As mentioned earlier, it became clear already during the initial setup (while focusing on the rings of Saturn), that my tripod was not strong enough to hold the whole system perfectly stable against the wind, so my strategy during the eclipse was the following: I kept taking pictures basically continuously hoping that there would be at least a few during which the wind would be weak or constant enough to not move the tripod too much, so with some luck I would get a few good-enough photographs at the end. This worked out as expected (with Clio’s not small contribution as a paravent), so the expedition became a total success :) The settings I used during the totality: ISO 3200, 2.5-2 sec. Settings in the partial phase: ISO 800-1600, 1/60-2 sec.

20180727_LunarEclipse-6

20180727_LunarEclipse-7

20180727_LunarEclipse-8

20180727_LunarEclipse-9

We stayed almost until the end of the partial phase, but by midnight the clouds reached us, so we had to pack in and drive home. It was still almost 30°C when we left…

20180727_LunarEclipse-10

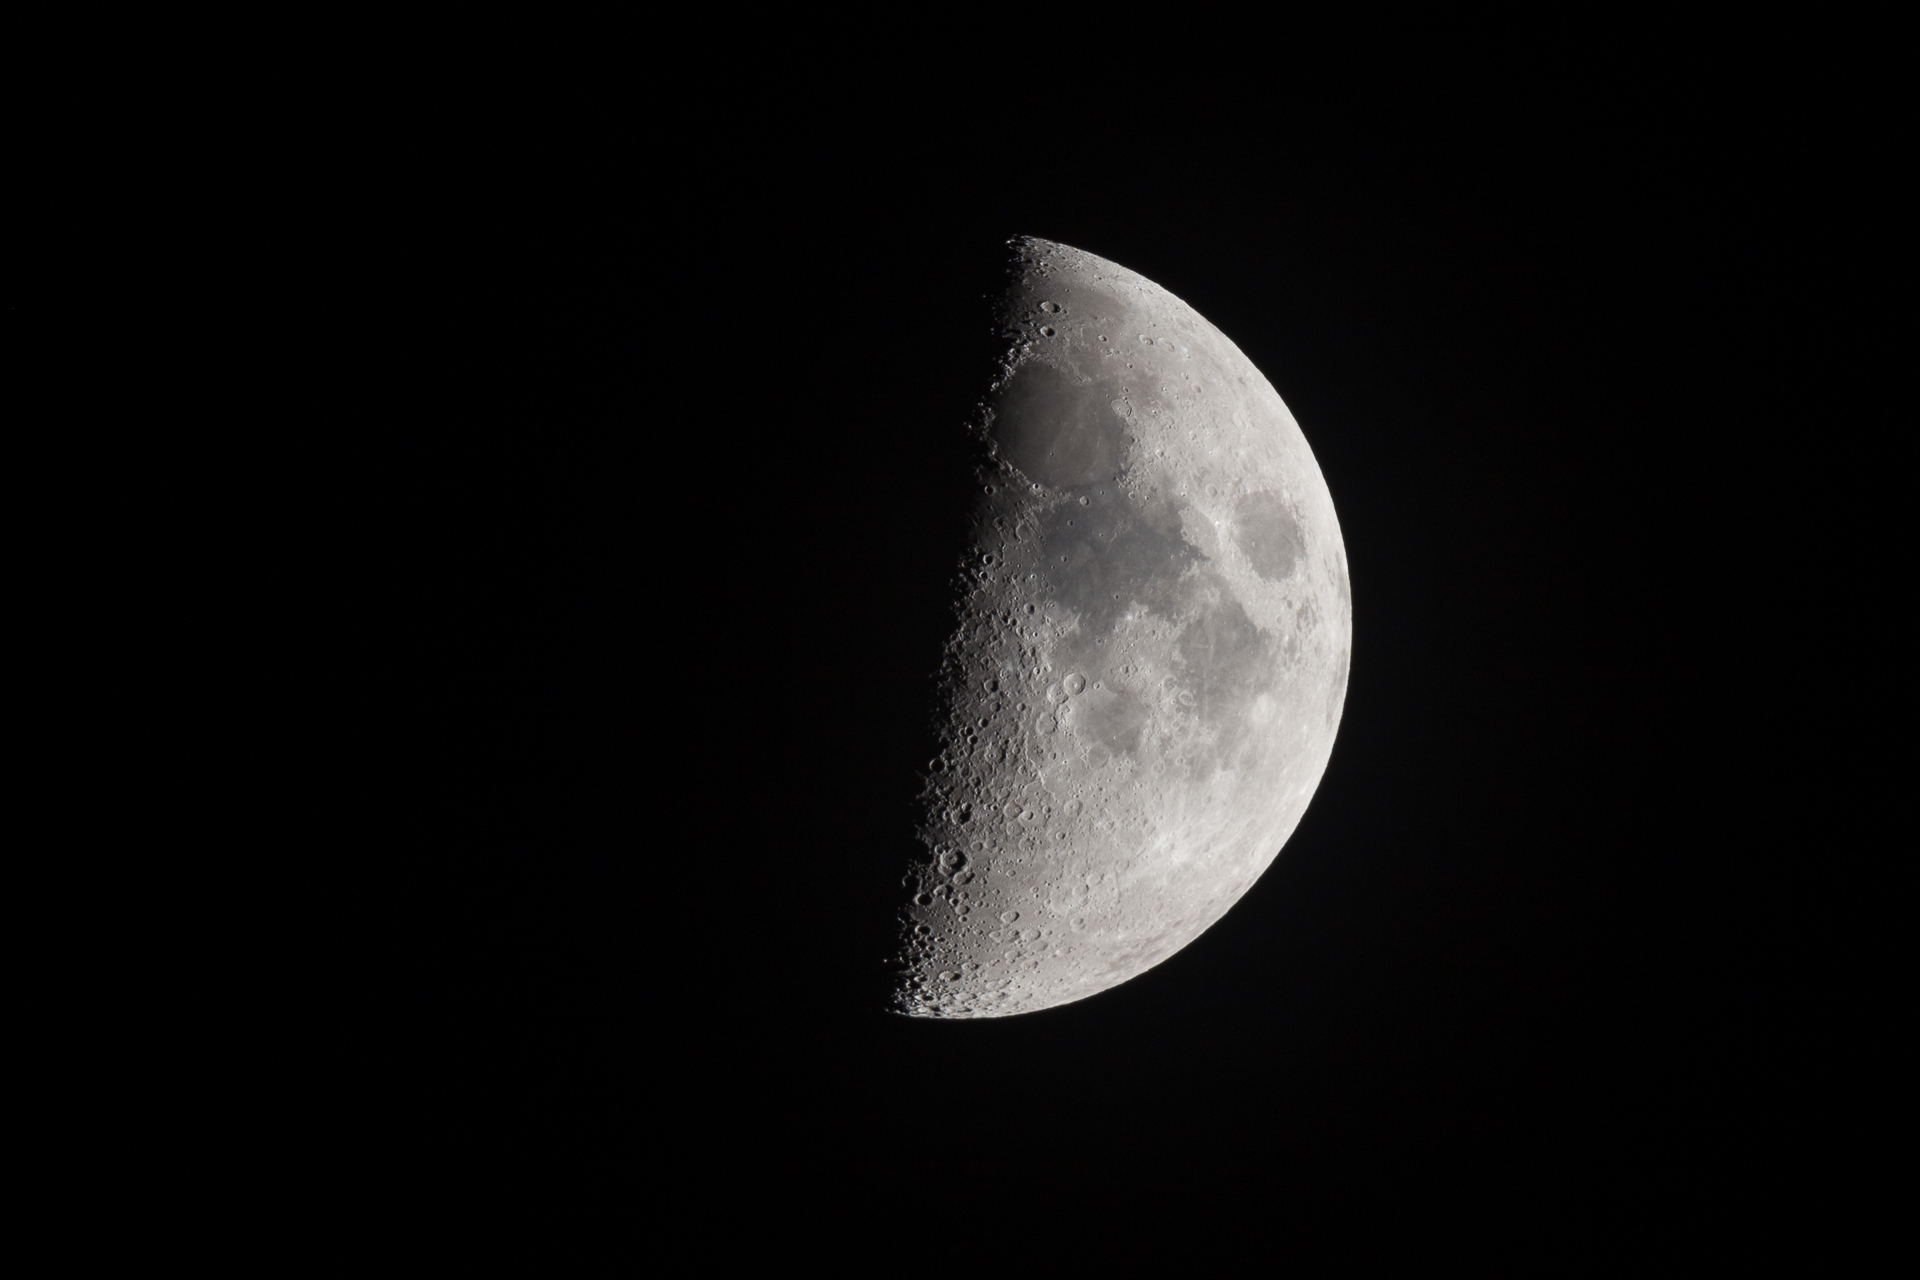
Overall I am satisfied with the results, of course with a bigger budget I could have made better images. While I really like astrophotography, living in one of the most light polluted places means that I do not feel like investing a lot of money into another expensive hobby (right now). As a bonus, here is the first test shot I made a quarter before the eclipse.

20180719_Moon-1

Holidays in Bretagne

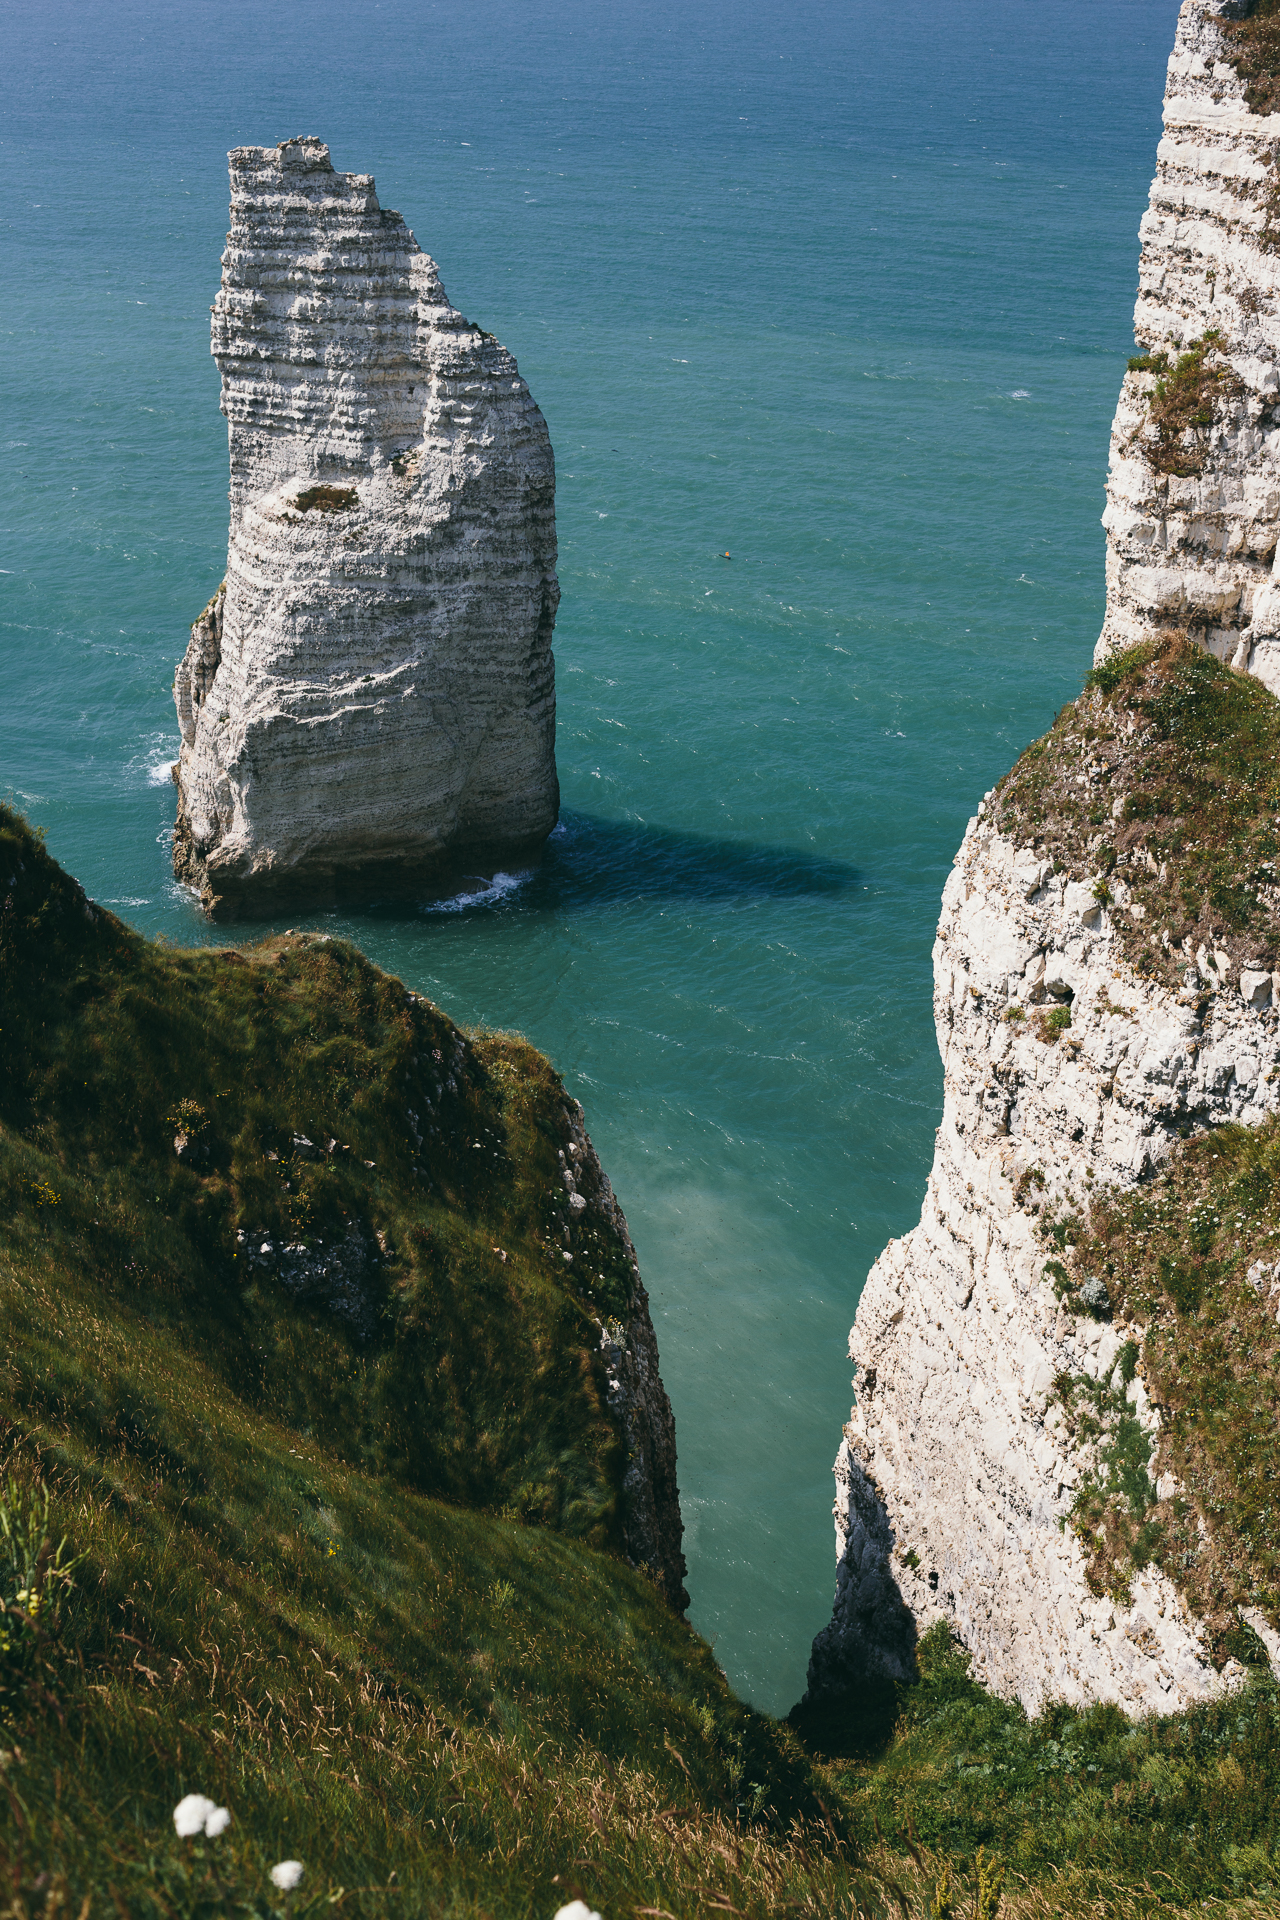
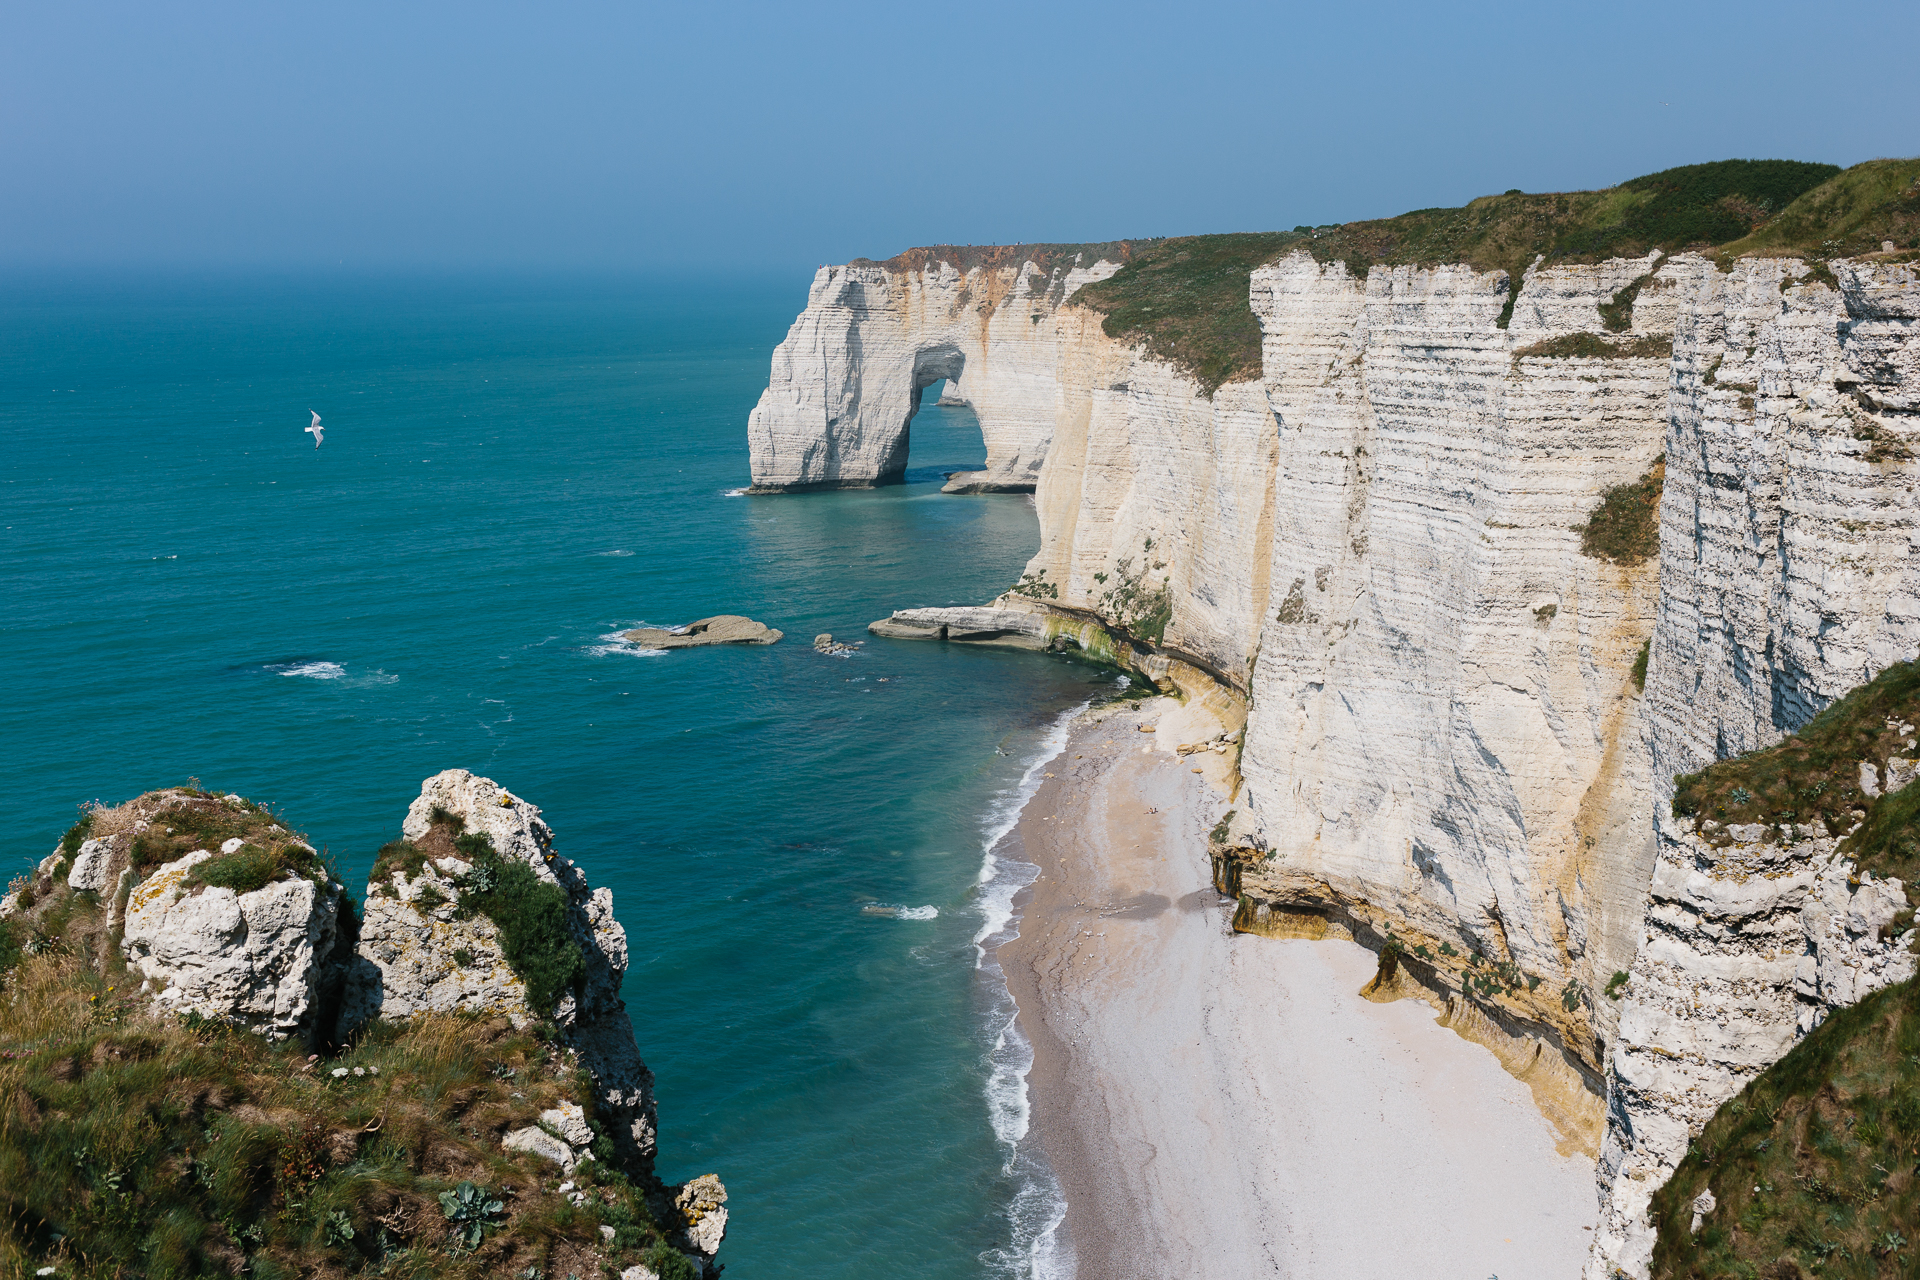
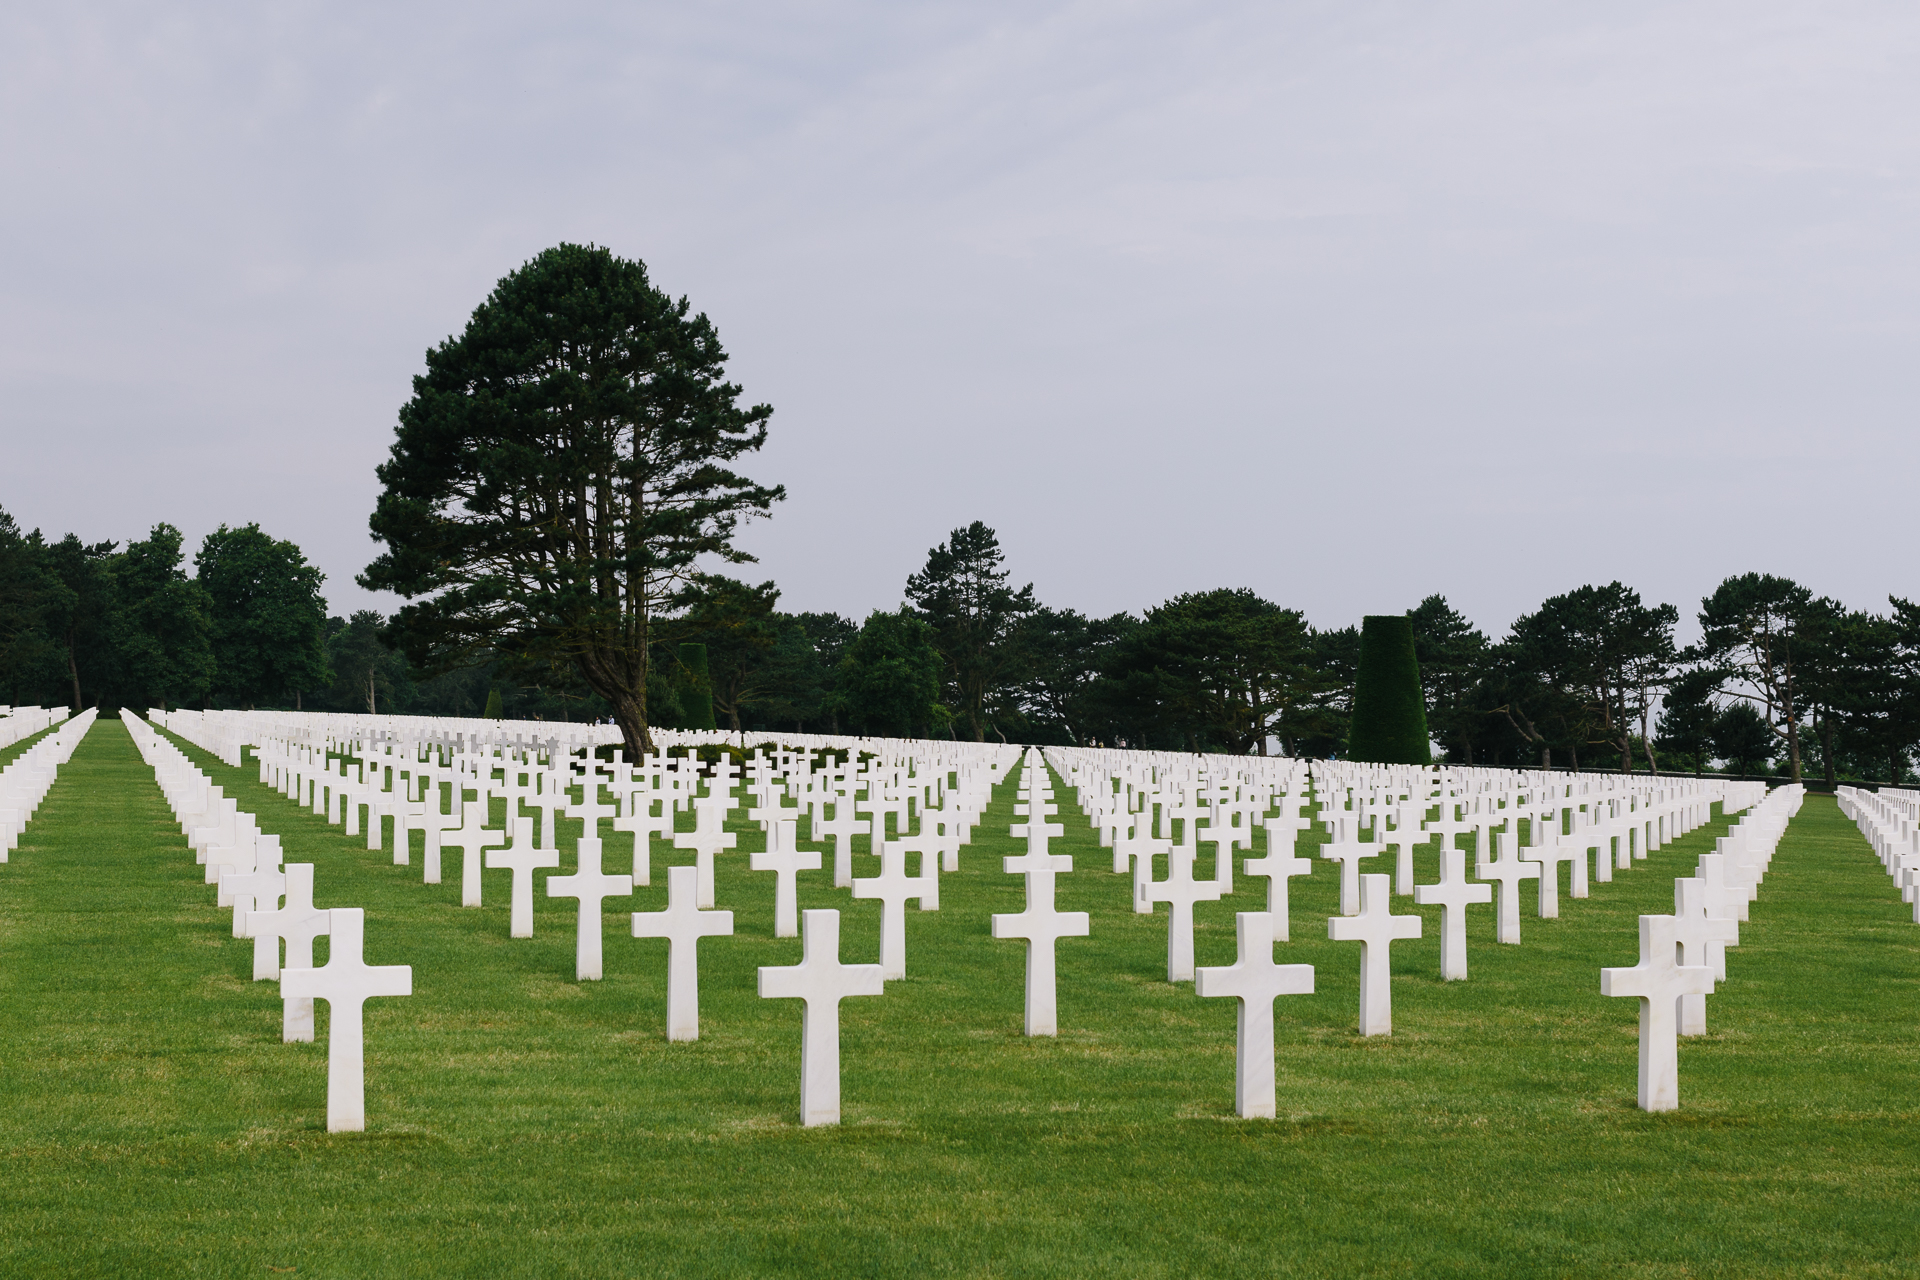
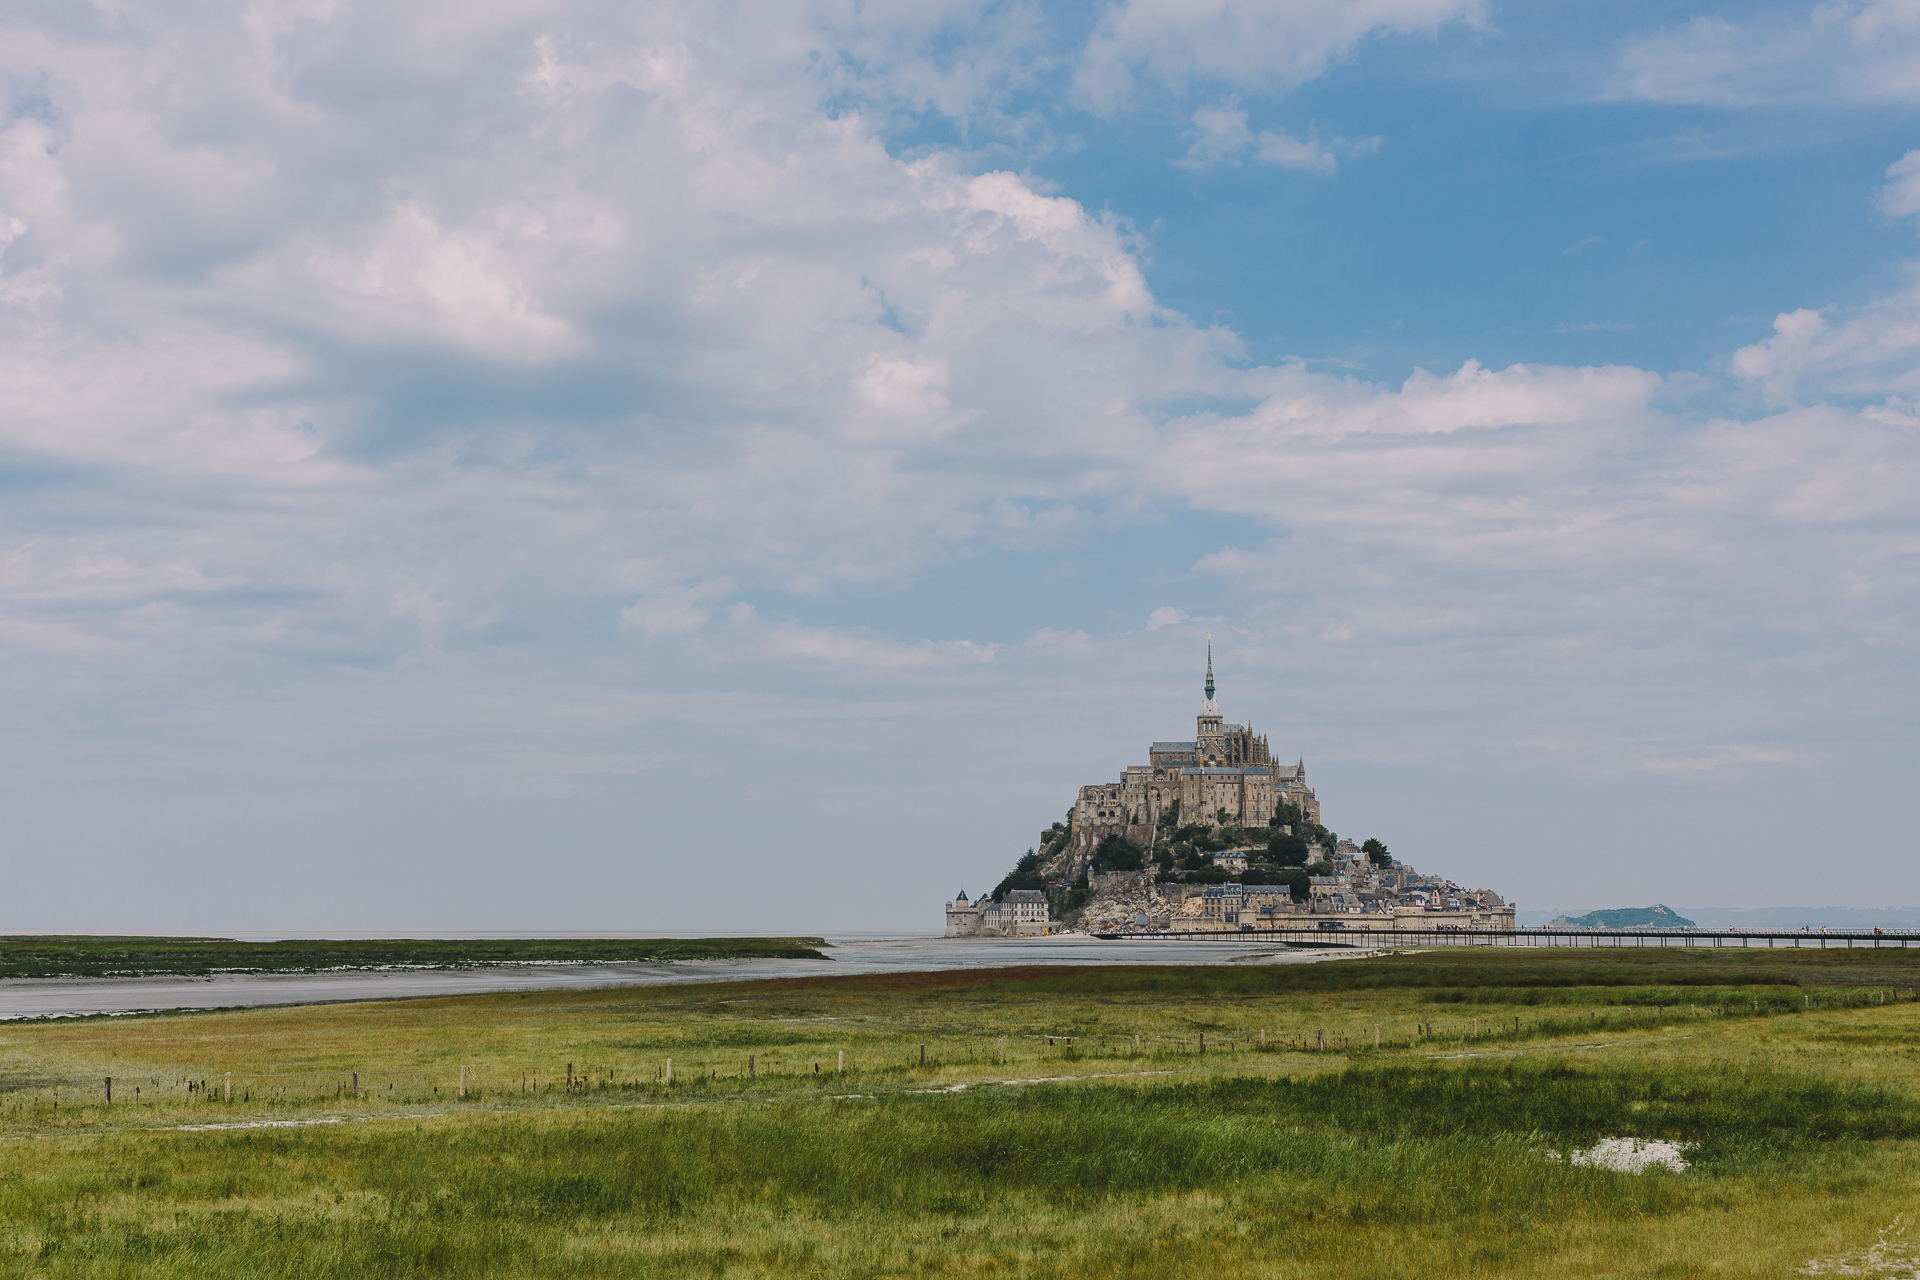
We spent the second week of our holidays this year in Bretagne. On the way there we stopped for a walk at the cliffs of Étretat, at Omaha-beach and the American Cemetery, and at Mont Saint-Michel. (Honourable mention to the steep bridges of Le Havre along the A29, they were pretty cool to drive over.)

2018_Bretagne-1

2018_Bretagne-2

2018_Bretagne-3

2018_Bretagne-4

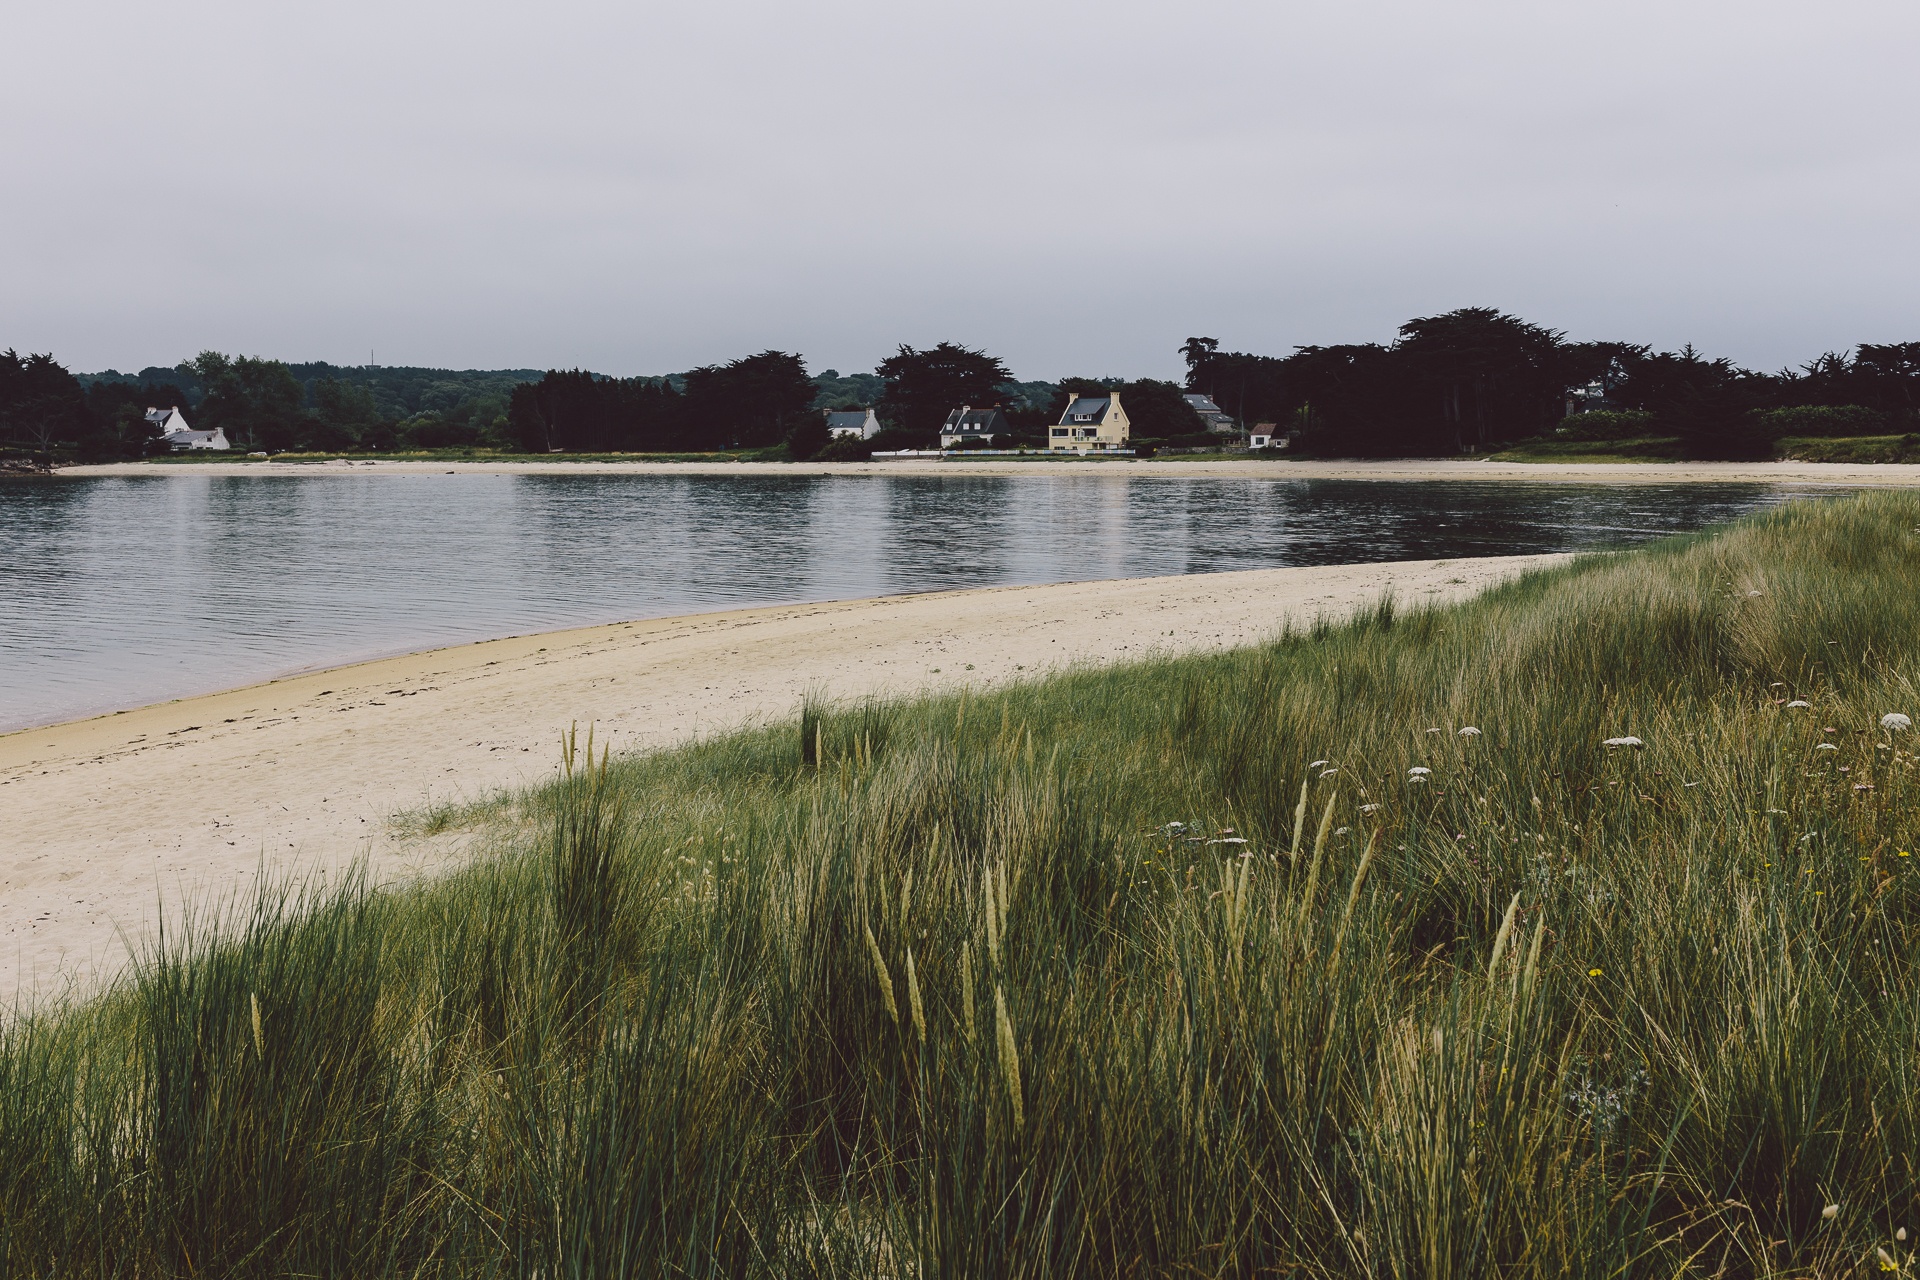
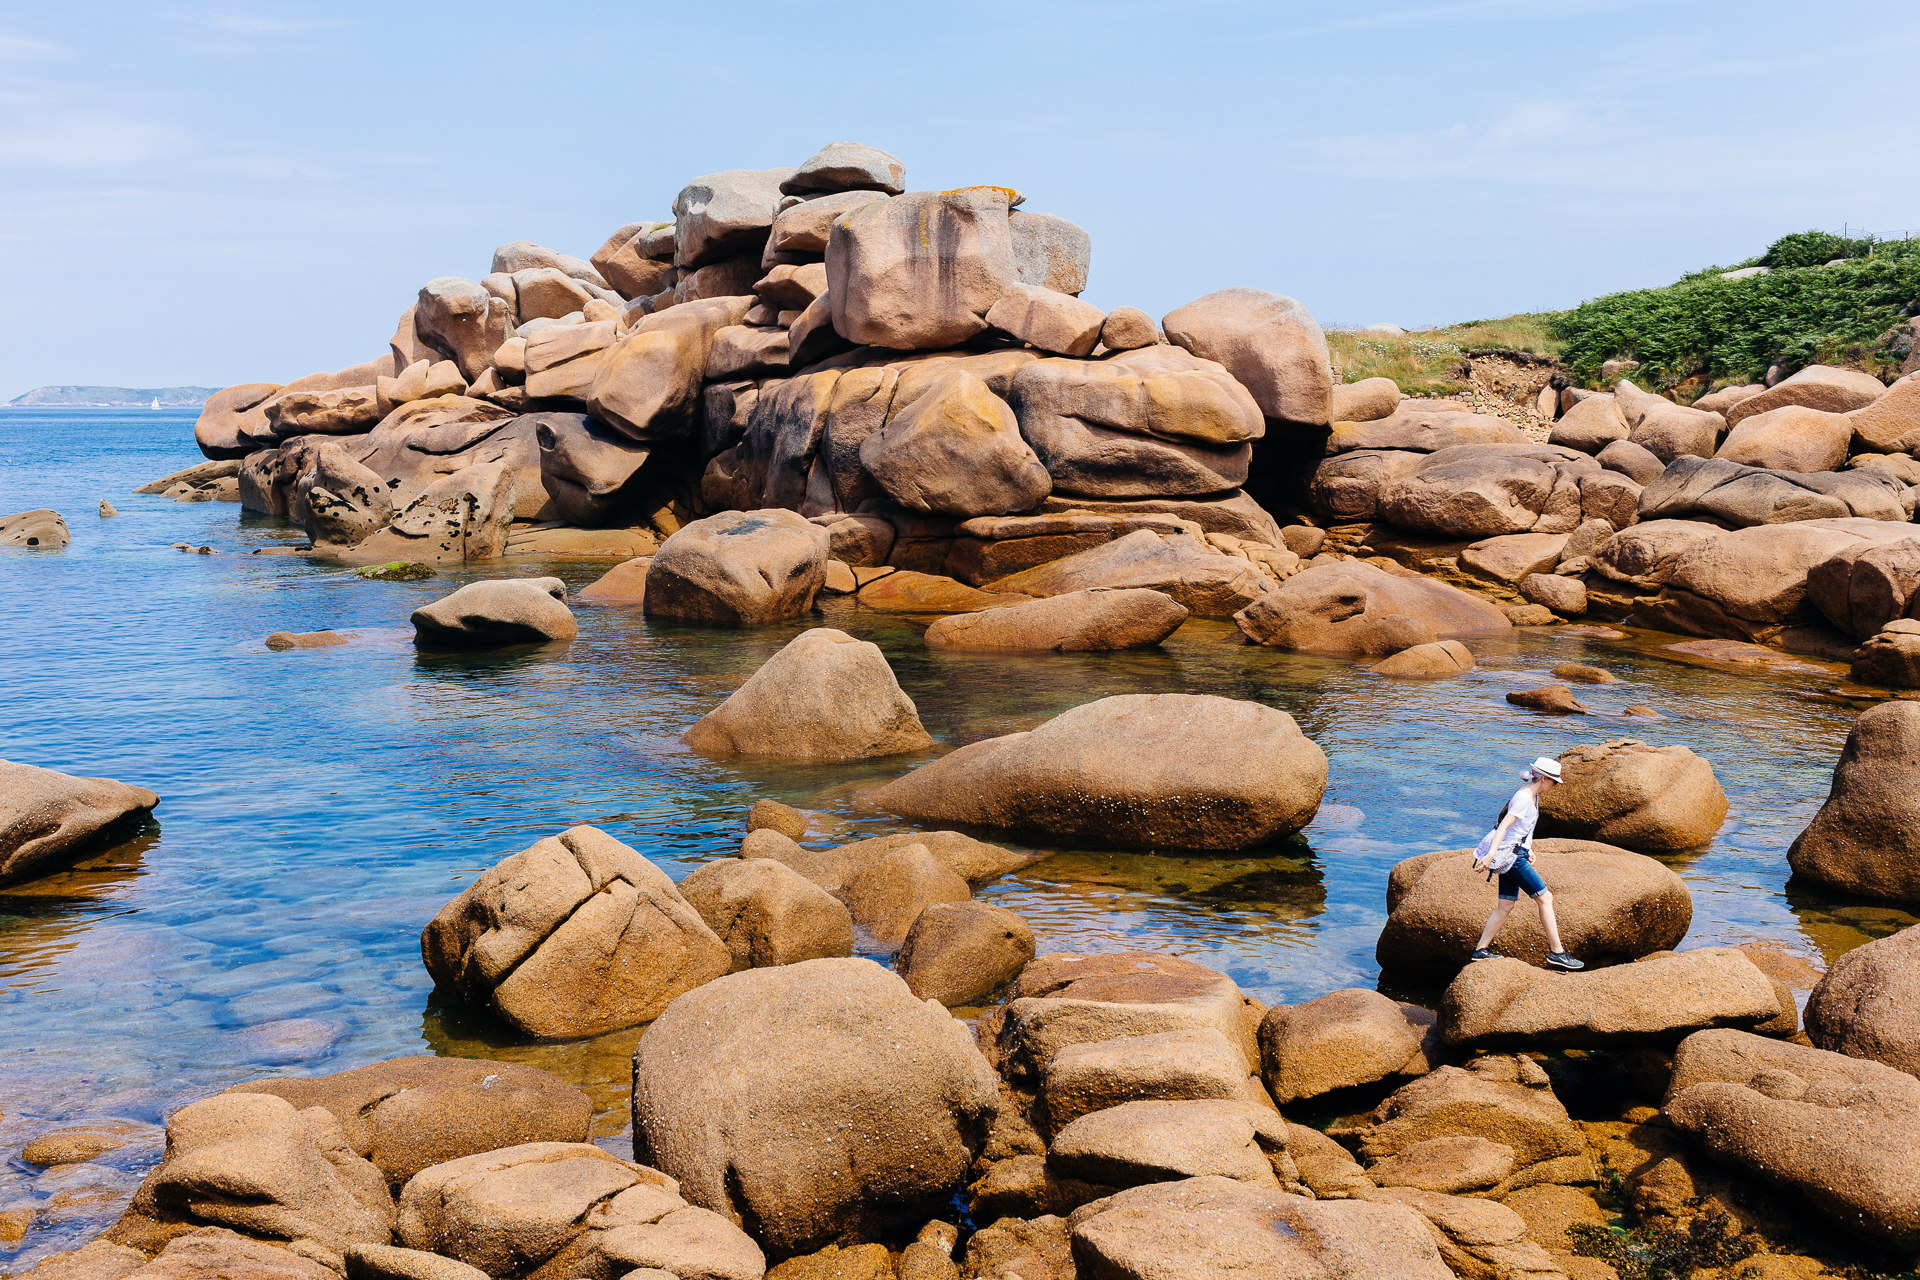
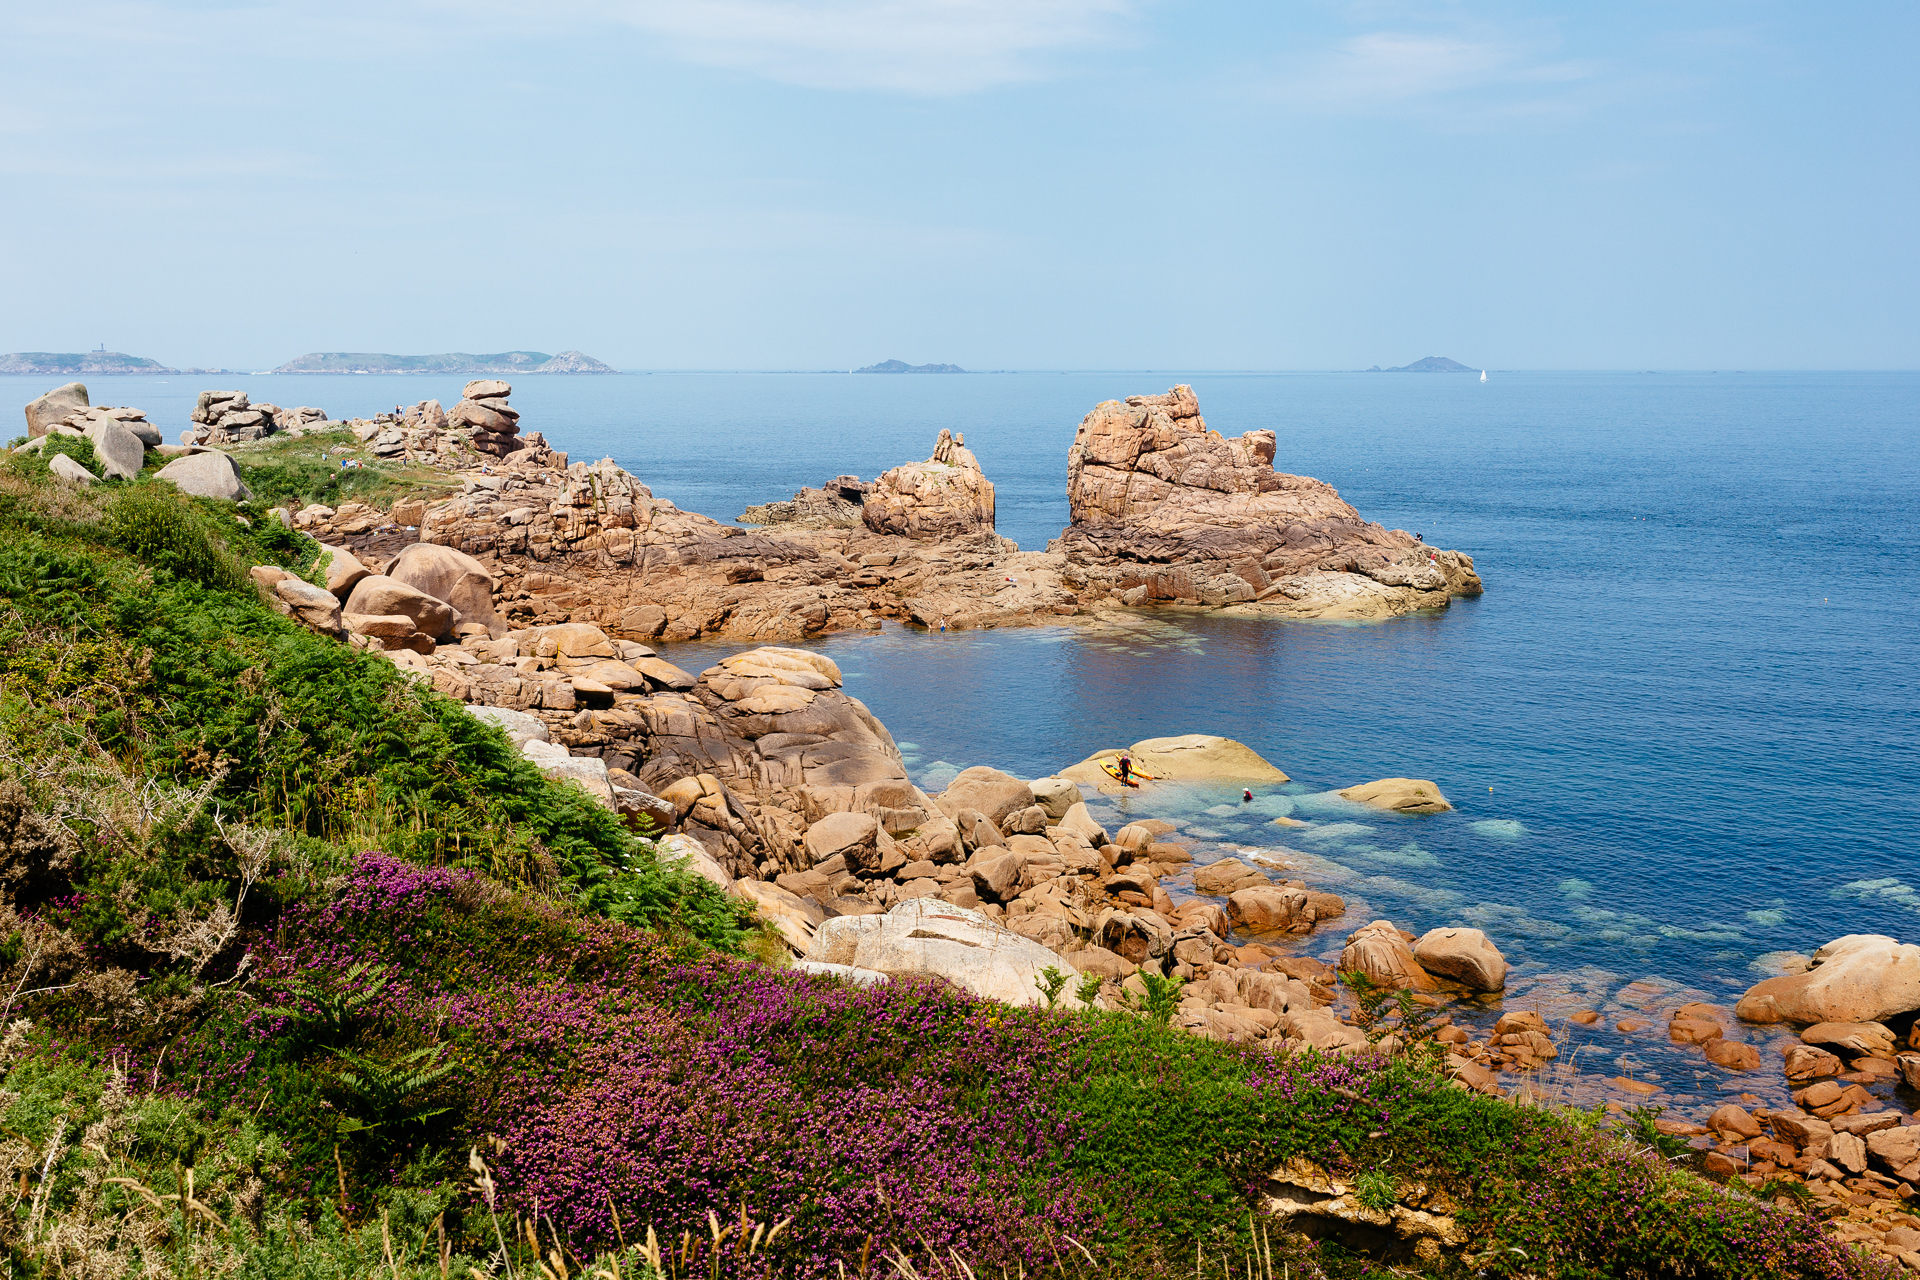
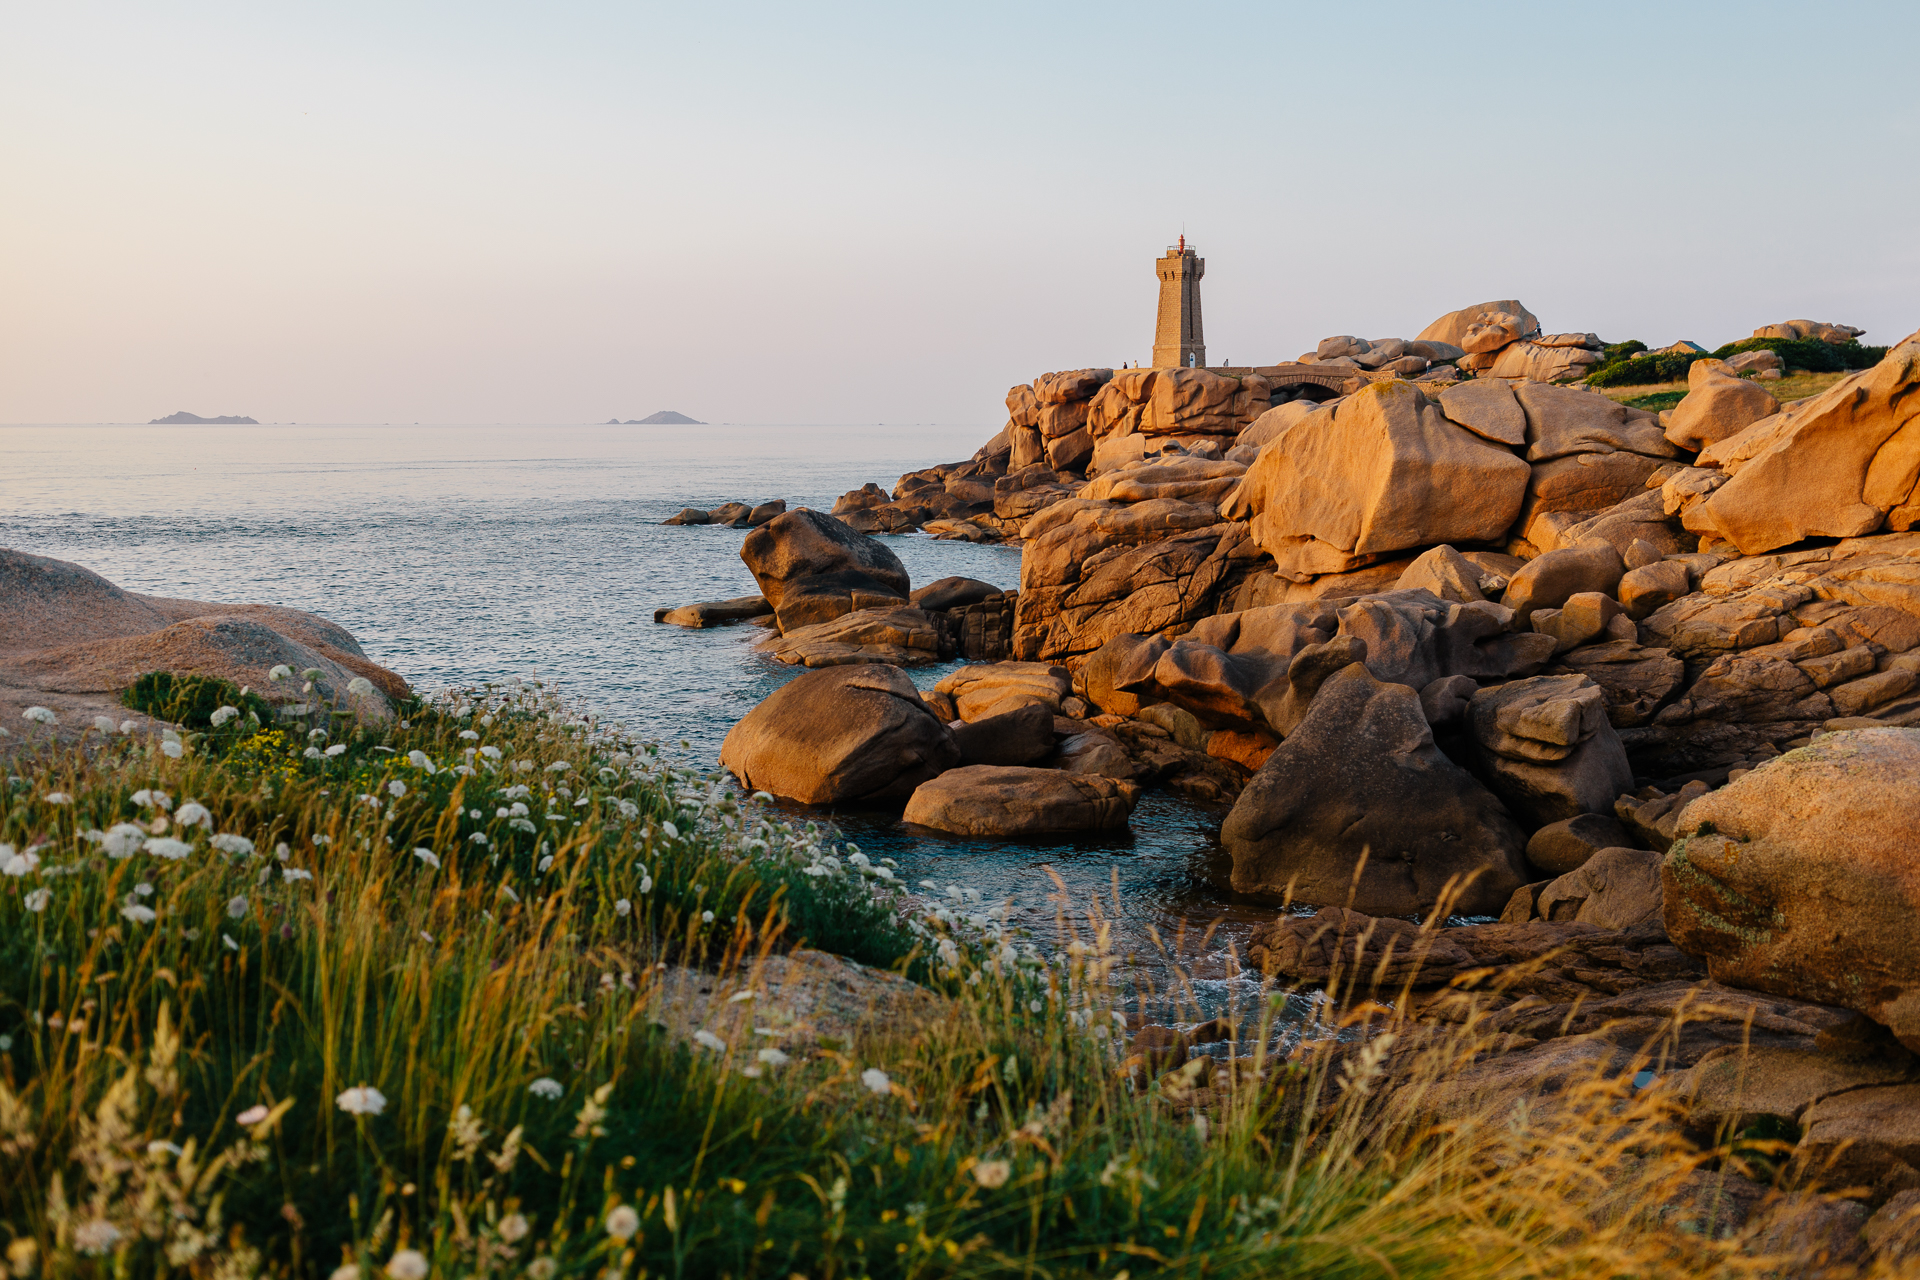
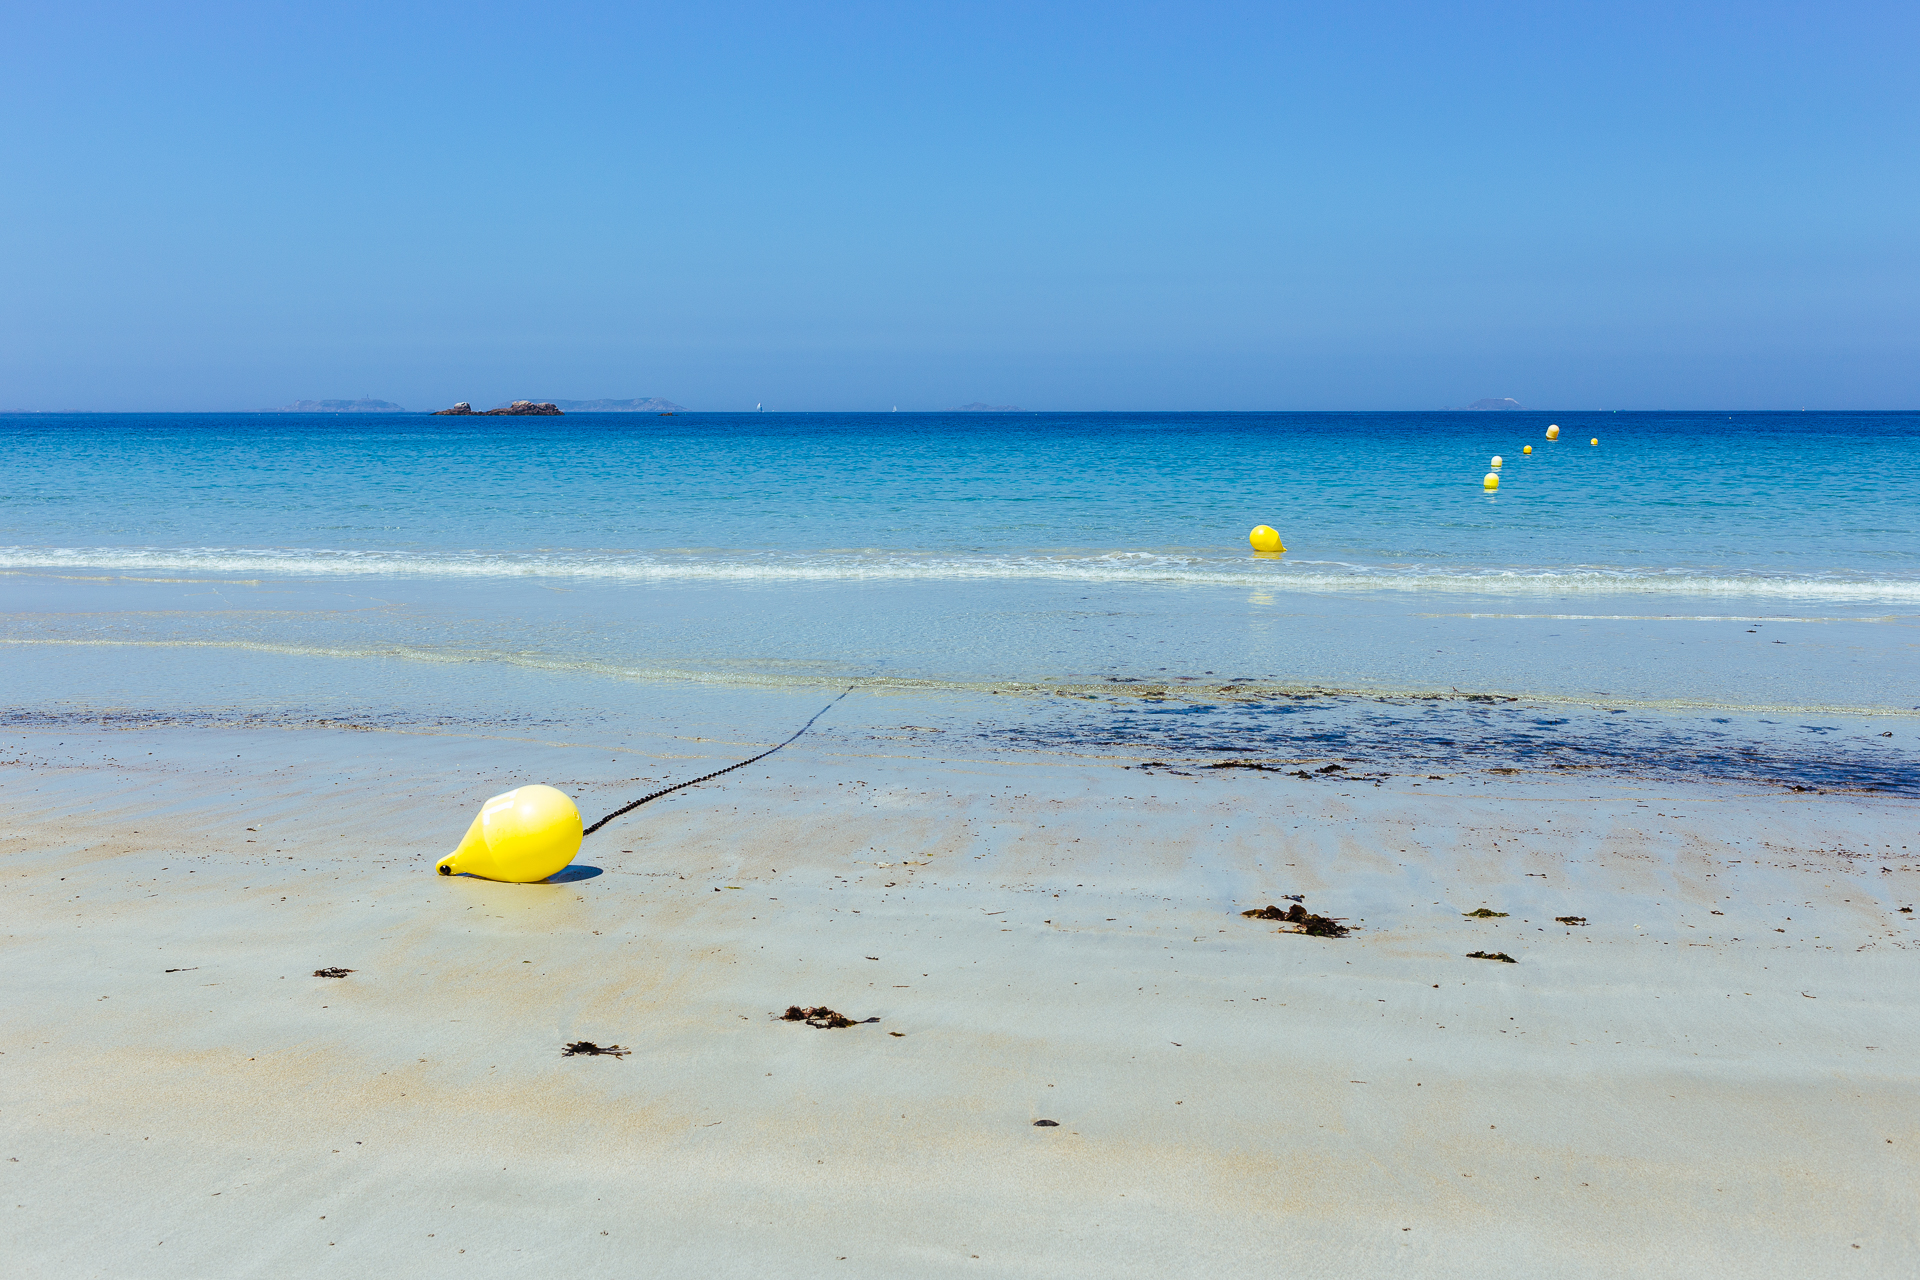
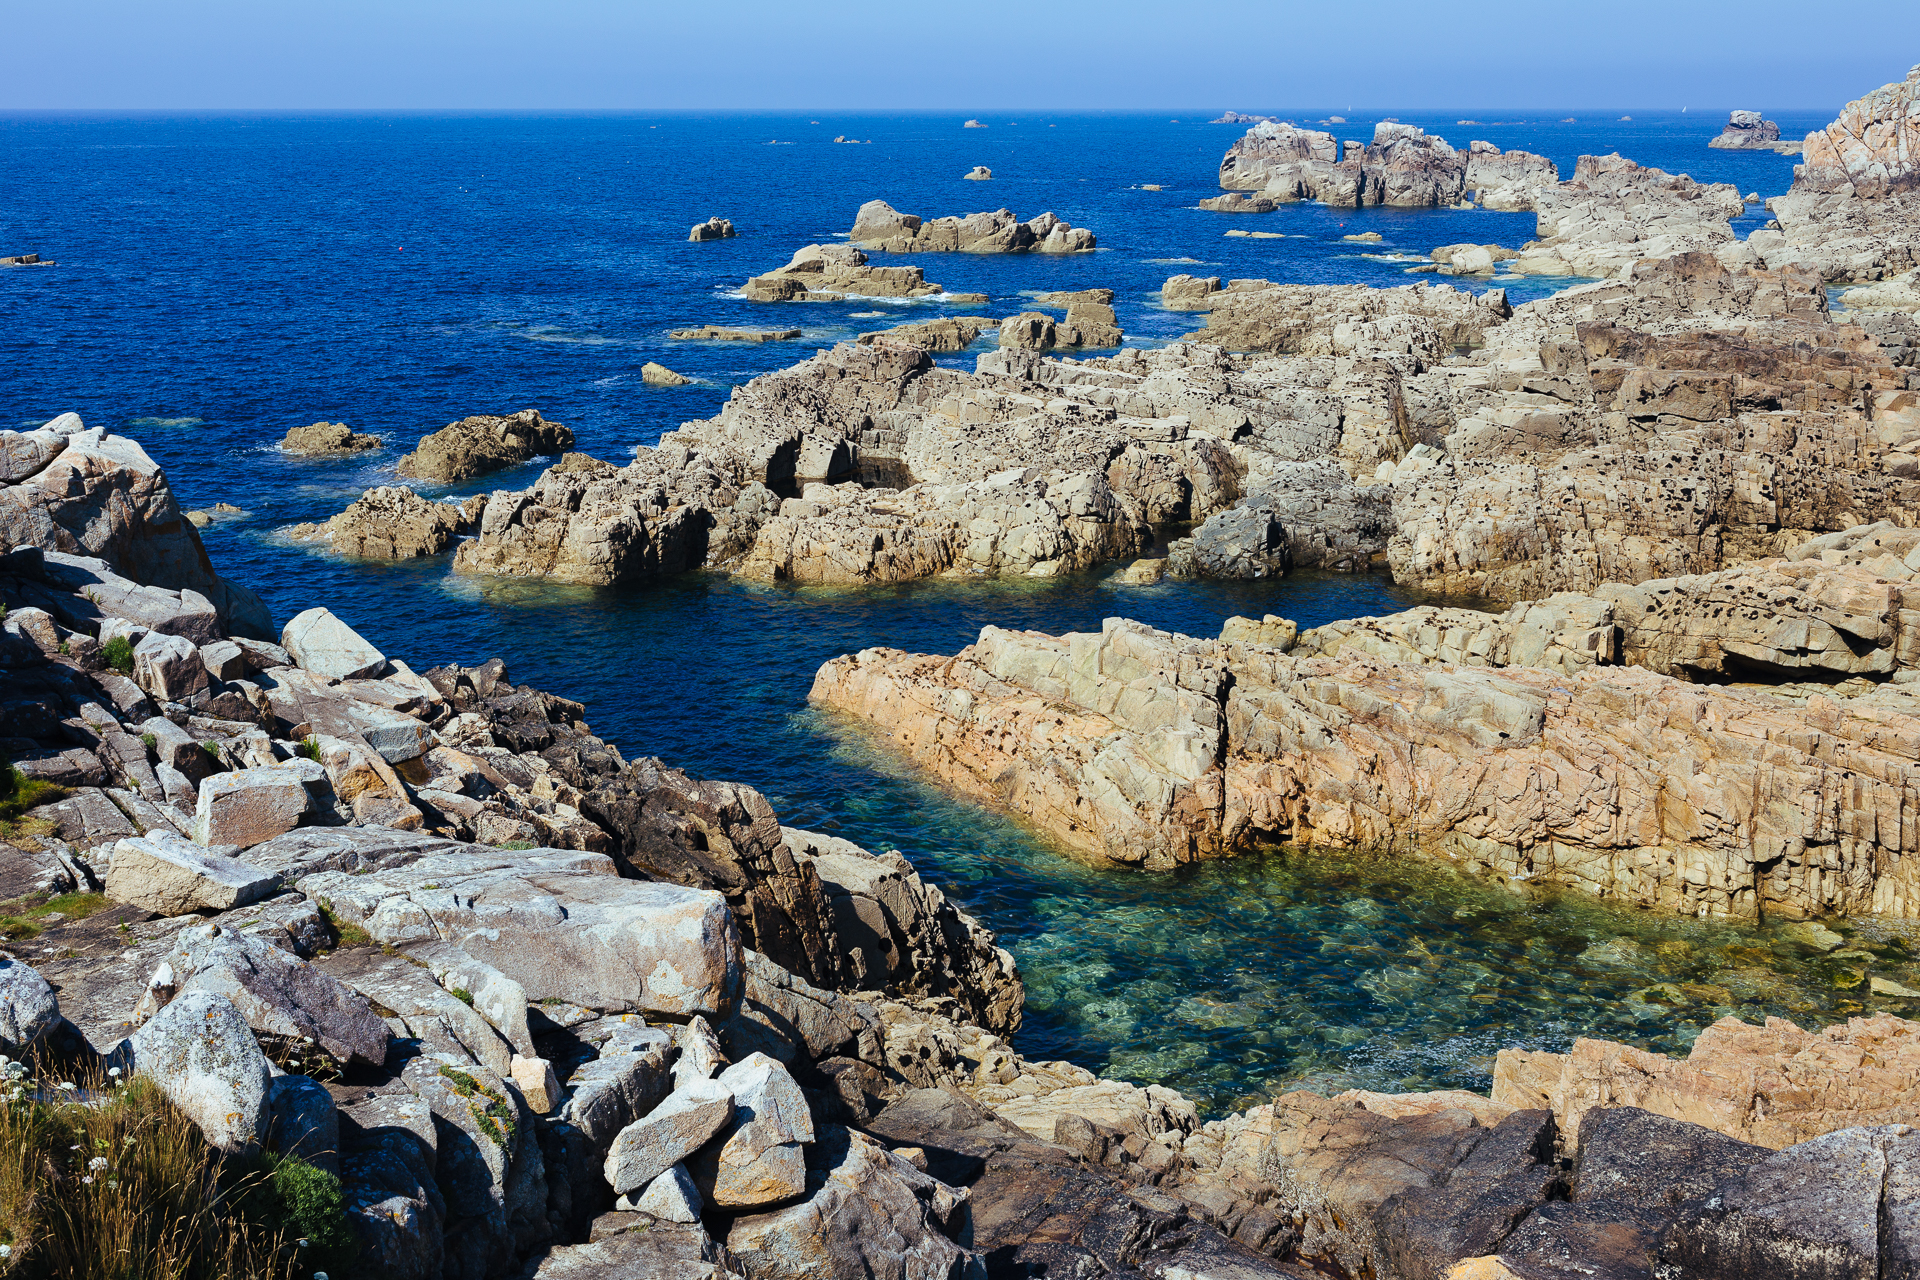
After the slightly busier schedule of the first weekend we had a much more relaxed time in and near our AirBnB apartment on Île-Grande. Since I also took my (older) road bike with me, I went cycling on three mornings, but otherwise we spent our days walking around on nearby beaches (around our island, along the Pink Granite Coast of Saint-Guirec, the white beach of Trestrignel, the rugged coastline north of Plougrescant, and the tiny and beautiful bay of Pont Roux), or eating pancakes and galettes (and Clio got her share of seafood too).

2018_Bretagne-5

2018_Bretagne-6

2018_Bretagne-7

The weather was also nice, we had rain only once, and the temperature definitely felt much warmer every day than the lies of the weather forecast, so we were positively surprised. The coasts were all beautiful and not at all too busy, the pancakes were delicious everywhere (especially at the small bar just 5 minutes walking from our place), and finally we really managed to have a not too exhausting holiday :)

2018_Bretagne-8

2018_Bretagne-9

2018_Bretagne-10

I even managed to just play some Celeste on the Nintendo Switch, or watch the Belgian football team (without constantly hanging on social media) make it past the Japanese and Brazilian team to reach the semi-final of the World Cup. On the last day we went sea kayaking, so for the first time in my life I got to wear a wetsuit.

I definitely need more holidays like this one.

Weather and air-quality monitoring system (DIY)

As mentioned in the previous post, I got involved in the citizen science project called LeuvenAir a few months ago. This started out as simply setting up a low-cost fine-dust sensor on our terrace (following the description that can be found here) and connecting it to the LeuvenAir database. This was the first time in my life that I was connecting pieces of hardware together with jumper wires, and I found it interesting enough to want to do a bit more…

First I wanted to simply display (and log) the recorded values locally on a small screen, so I bought a Raspberry Pi 3+ (RPi) and a Sense HAT, and combining these I made a data logger that also displayed (scrolled) the recorded air pollution and weather measurements using the small led-matrix of the Sense HAT (colour-coded according to specific pollution/comfort levels). The RPi was running 24/7, while the display could be turned on and off by putting the RPi in an upright or horizontal position (using the accelerometer sensor of the Sense HAT). At this point life was easy, I got the fine dust data along with the outside temperature and humidity values from the LeuvenAir sensor (via the API of the original German project, luftdaten.info – which gave the idea to LeuvenAir -, as all LeuvenAir sensors are also sending data there), and the barometric pressure from the Sense HAT. All of this was handled by a small script that I wrote in Python.

Then I decided that I wanted better sensors outside, and that I wanted to measure inside too, preferably both in the living room and the bedroom. Of course these new units had to be wireless, and preferably everything had to work even after a power cut more-or-less automatically. Oh, and I wanted to push the data to an Internet of Things (IoT) platform and also make an only locally reachable website that displays live data and graphs for everything – a bit like the weather status page of the Mercator Telescope… This is where things became slightly more complex. Below I am going to give a description of the system as it is now, without discussing the timeline because a) you are not interested in that, b) I don’t remember all the details anymore…

Central computer

  • Hardware: Raspberry Pi 3+ [with Sense HAT]
  • Role: Data logger, data plotter, Apache web server, MQTT “server”, dot-matrix display
  • Measurements: Processor temperature, barometric pressure
  • Description: The Raspberry Pi is an extremely small (bit bigger than a card deck) computer that is running a Linux-based operating system. This is the main hub of my sensor-network. It is placed in a black Short Crust Plus case under the TV. On it there are two python scripts running continuously: 1) monitor_home.py taking care of the data logging (saving all measurements – read in from an internet API or received through the MQTT protocol – to daily .csv files once every ~2 minutes), feeding the current values to the matrix display of the Sense HAT (if it is in the on-orientation position), and publishing these to an only privately accessible IoT platform called Cloud4RPi so I can easily check the status of all sensors from anywhere. It does not use more than 1-2% of processor power, and most of the time it is simply idle – waiting for time to pass between two measurements. 2) grapher.py is responsible for an around-the-clock generation of plots that are displayed on a website that is placed on the Apache web server on the RPi (these pages automatically reload every minute in a browser). It runs in one minute intervals (using 25% of processor power when not idle) and creates daily, weekly, monthly, and yearly plots of (selected) temperature, humidity, pressure, and fine dust concentration sensor measurements. Besides these plots, it also creates a colour-coded overview table of the latest measurements. These processes are light enough that the RPi does not need any active cooling. The RPi has a preferred IP address, so if no other device on our network gets assigned this IP (after a network/power outage some devices need less time to restart/reconnect and I can not give fix IPs directly from the router of our internet provider, so in theory it can happen that by the time the RPi restarts its preferred IP is already taken), then the RPi has a practically fix IP. For full automation I would need to implement that these two scripts run automatically after reboot, but I can always reach the RPi using a virtual desktop using VNC Connect / VNC Viewer, so it is not such a burning issue right now.

2018_sensors_leuvenair4

There is a video showing how the very simple colour-coded scrolling display works on my YouTube channel, while here below there is an image of the main local webpage that shows the daily plots, and an image of the page where you land after clicking on the humidity plot (which displays the daily, weekly, monthly, and yearly plots).

2018_sensors_overview

2018_sensors_humidity

These are more than a month old screen shots, but at that time the fine-dust concentration was high, thus you could see a lot of different colours in the overview table ;) Also these were taken just 4 days after we came home from our holidays in France, so in the weekly plot you can see that while we were away the humidity in the bedroom stayed more-or-less constant throughout the day, then after we came home, it always went up during the night (we sleep with doors and windows closed most of the time, so there is not much air-circulation during the night).

LeuvenAir sensor-cluster on the edge of the terrace

  • Hardware: NodeMCU ESP8266 [with SDS011 fine-dust sensor, DHT22 temperature/humidity sensor, BME280 temperature/humidity/pressure sensor, jumper cables, transparent flexible tube, zip ties, USB power supply, plastic tube housing, netting against animals]
  • Role: Monitoring outdoor fine-dust concentrations and weather
  • Measurements: Temperature, humidity, barometric pressure, PM 10 and PM 2.5 concentrations
  • Description: This cluster controlled by the firmware of luftdaten.info does its work without me having to program anything. The three connected sensors are recognised automatically (after an initial setup). Every 2.5 minutes (it is a default setting to extend the lifetime of the fine-dust sensor) it takes a measurement using the connected sensors and uploads these to the database of luftdaten.info and LeuvenAir. I am simply using the API of luftdaten.info to get these values onto the RPi. Normally it is possible to reach the latest values locally too (using an API that runs on the ESP8266 itself), but I found this route to be very unstable, depending on the wireless connection and the processor load of the ESP8266. It would be better if I could send data using the MQTT protocol directly to the RPi, but since I can not change the firmware here (without writing my own), I have to depend on the luftdaten.info servers being online instead… Originally only the DHT22 was connected, I bought the BME280 a bit later to get more accurate values, and to have pressure measurements too. The whole system boots up and starts working without any interaction after a network/power outage.

2018_sensors_leuvenair1

2018_sensors_leuvenair2

2018_sensors_leuvenair6

Wireless indoor sensor 1 in the living room

  • Hardware: ESP32 Feather Board [with DHT22 temperature/humidity sensor, USB power supply, jumper cables]
  • Role: Indoor weather monitor
  • Measurements: Temperature and humidity
  • Description: This was my first bigger extension to the system, also the first time I had to do the whole thing from scratch. I followed the description here, almost everything is exactly as it is written there. The script that is running on the ESP32 board is written in MicroPython (a compact version of Python for microcontrollers), and it simply polls the DHT22 sensor to take a measurement every four seconds and publishes the values to the MQTT broker (the RPi). I have written the code in a way that after a network/power outage everything reconnects and starts running again automatically. (In practice this does not always work, maybe because after a power outage it takes much longer for the RPi to restart, therefore there is no MQTT broker yet to connect to when this sensor restarts, so things fail, but this only happened twice in the past two months and it is difficult to debug…) For this sensor I even built a nice housing from LEGO and placed it on a bookshelf (behind some books).
2018_sensors_leuvenair5

Wireless indoor sensor 2 in the bedroom

  • Hardware: ESP32 Feather Board [with BME680 temperature/humidity sensor, USB power supply, jumper cables]
  • Role: Indoor weather monitor
  • Measurements: Temperature, humidity, and volatile organic compounds (VOC)
  • Description: This was the last addition to the system, the setup is basically the same as for the other wireless sensor, except for some small changes in the coding and wiring due to the different sensing chip.

2018_sensors_leuvenair3

And what is the point of having this system? Nothing, I simply like gadgets data and plots :D But seriously, even though this is my number one reason (and my interest in weather), it is also quite handy that now I can see when it is worth opening windows to improve the indoor temperature/humidity. Also, it turns out, that blue-coloured haze on sunny mornings is simply high fine-dust concentration, a.k.a. air pollution :(