Tag Archives: statistics

The year (2018) in cycling (and other sports)

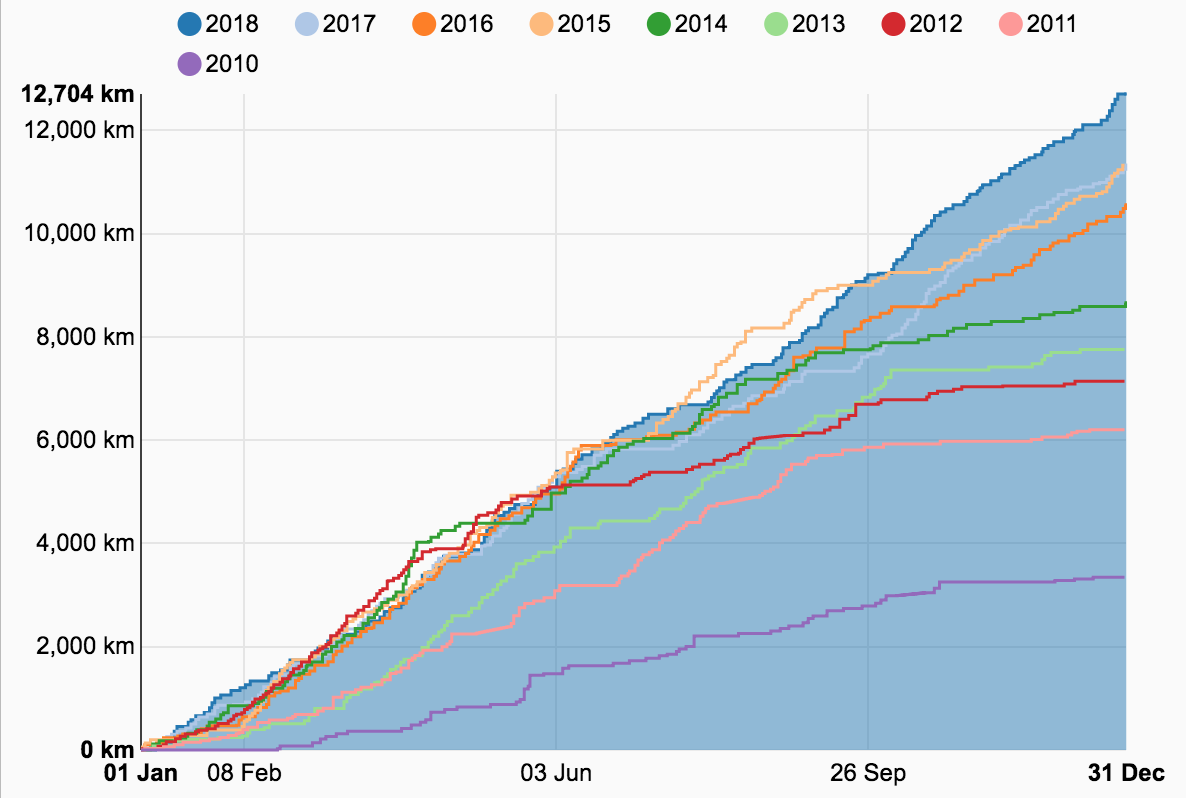
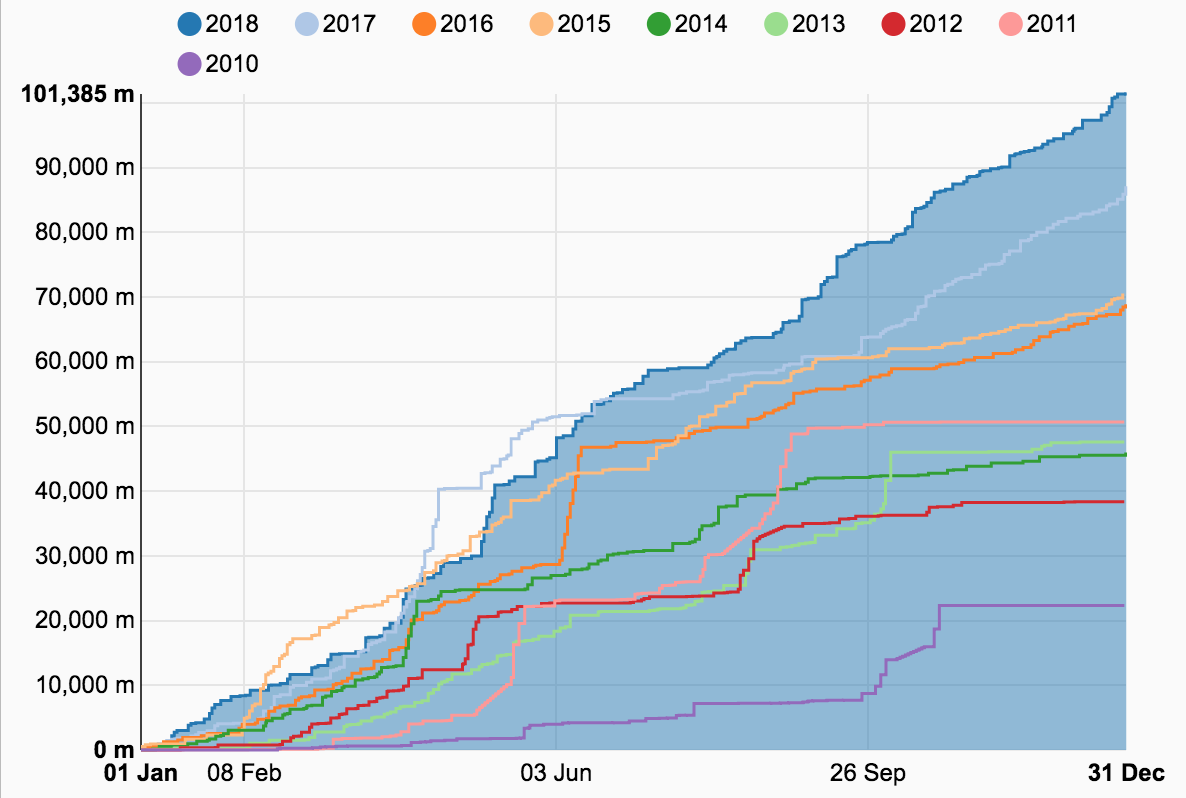
2018 was the fourth year in a row that I managed to bike more than 10000 kilometres, but this was the first time that I finished the season with more than an average of 1000 km per month (my best months were September and October with 1340 km and 1329 km, while my worst were July and February with 628 km and 676 km). Therefore my best cycling-year ever is now 2018 with 12704 km (with a not even small margin of 1374 km – 10.8% – over 2017). For the first time ever I broke the 100000 meter elevation gain limit too.

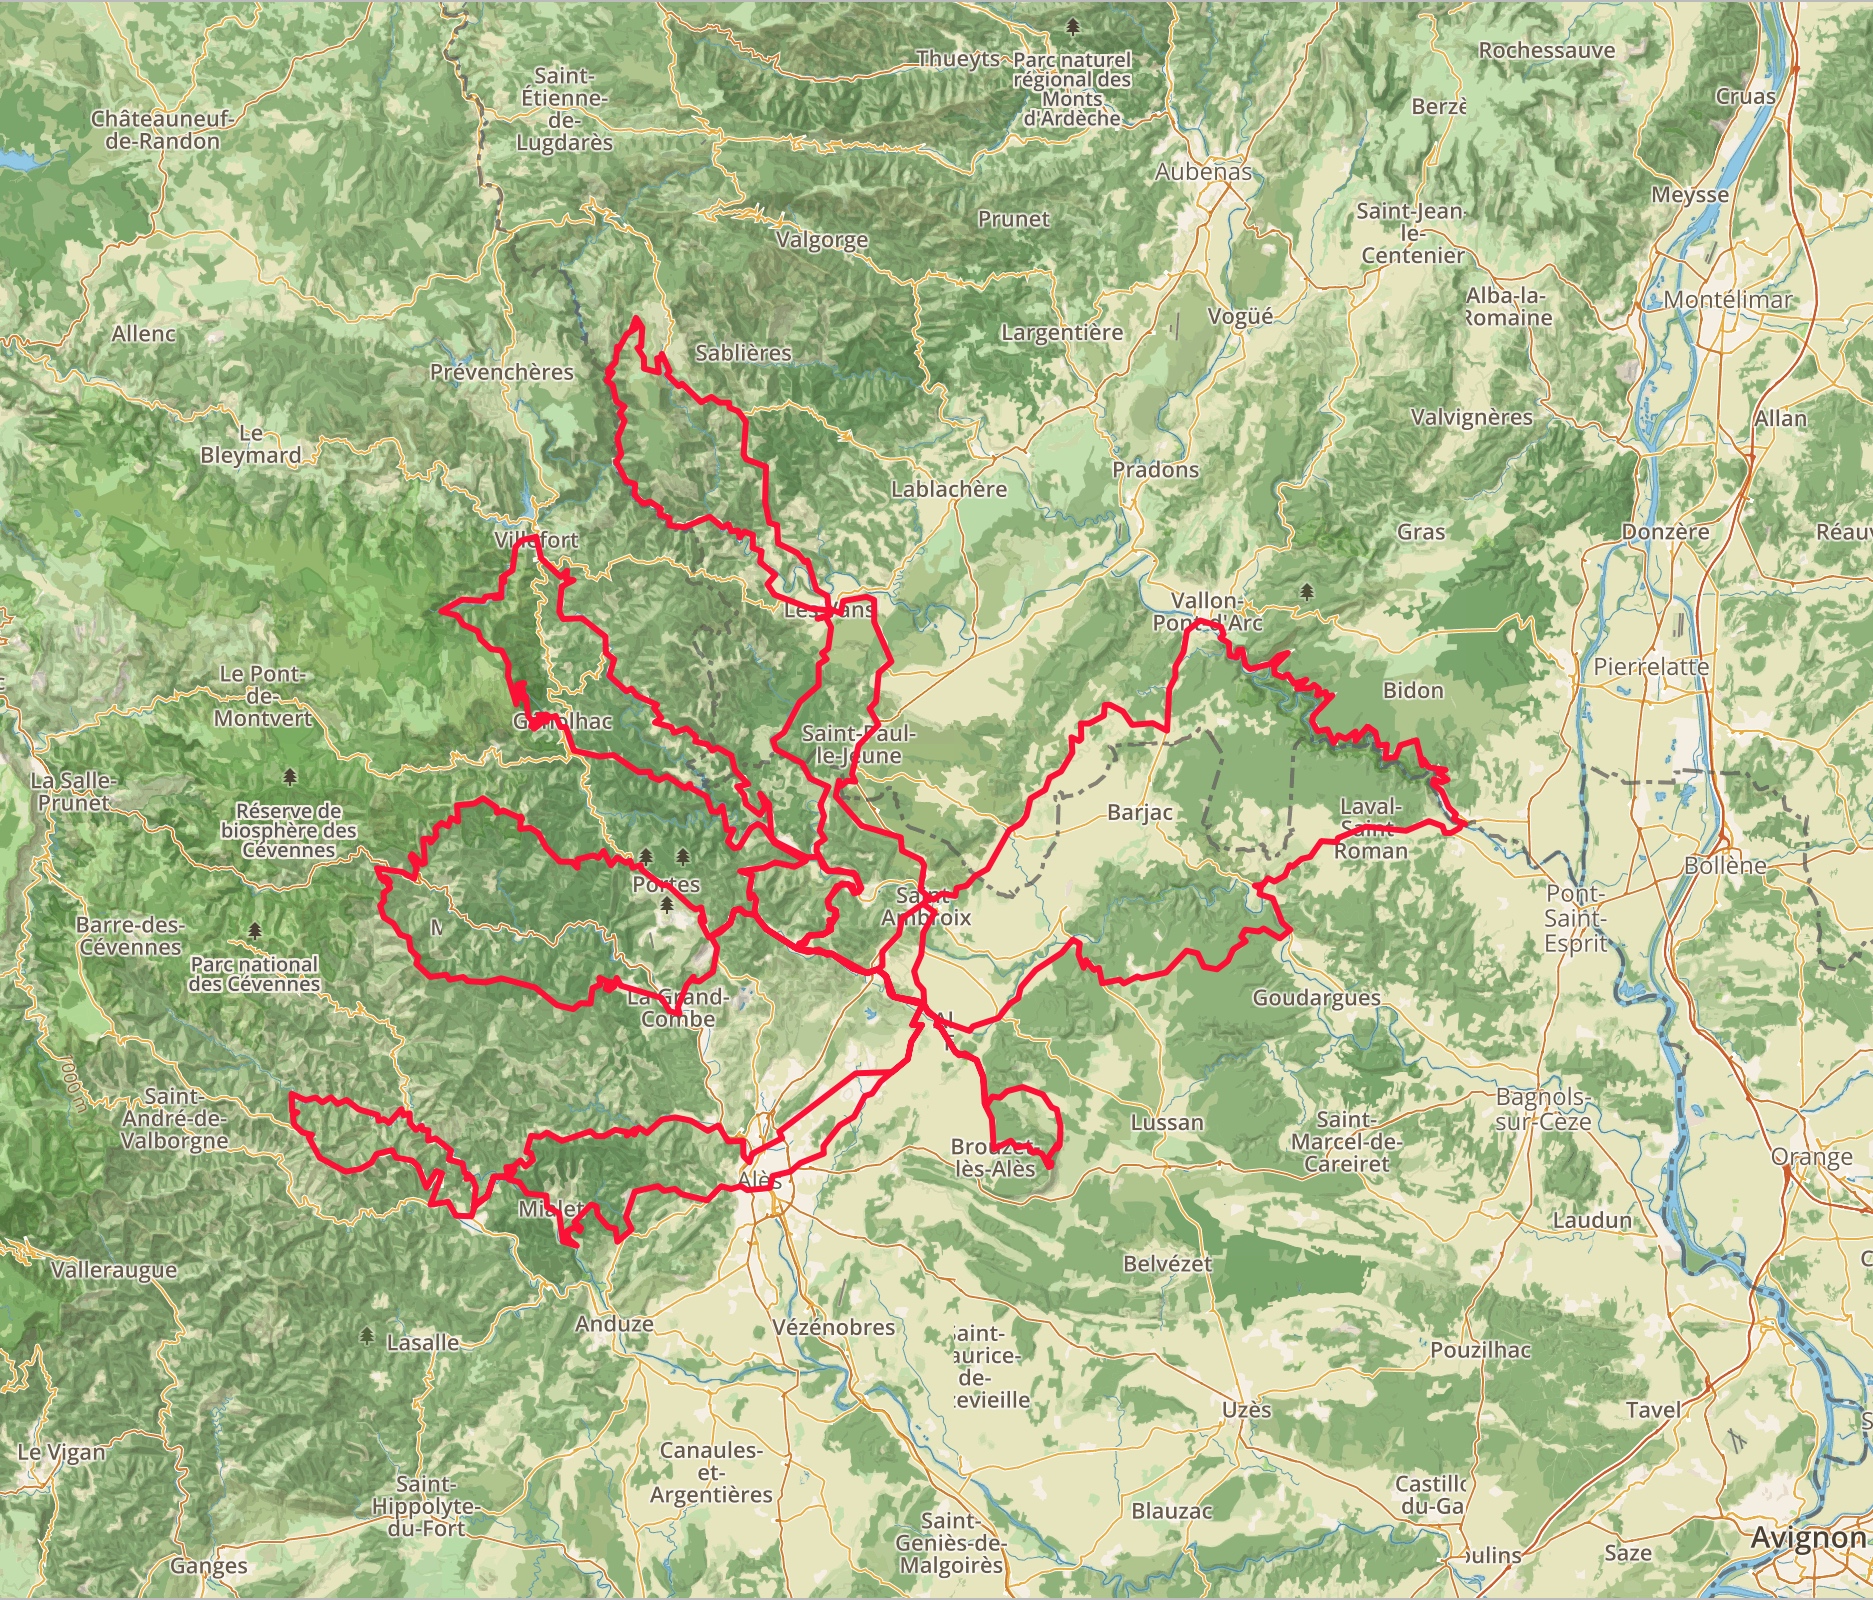
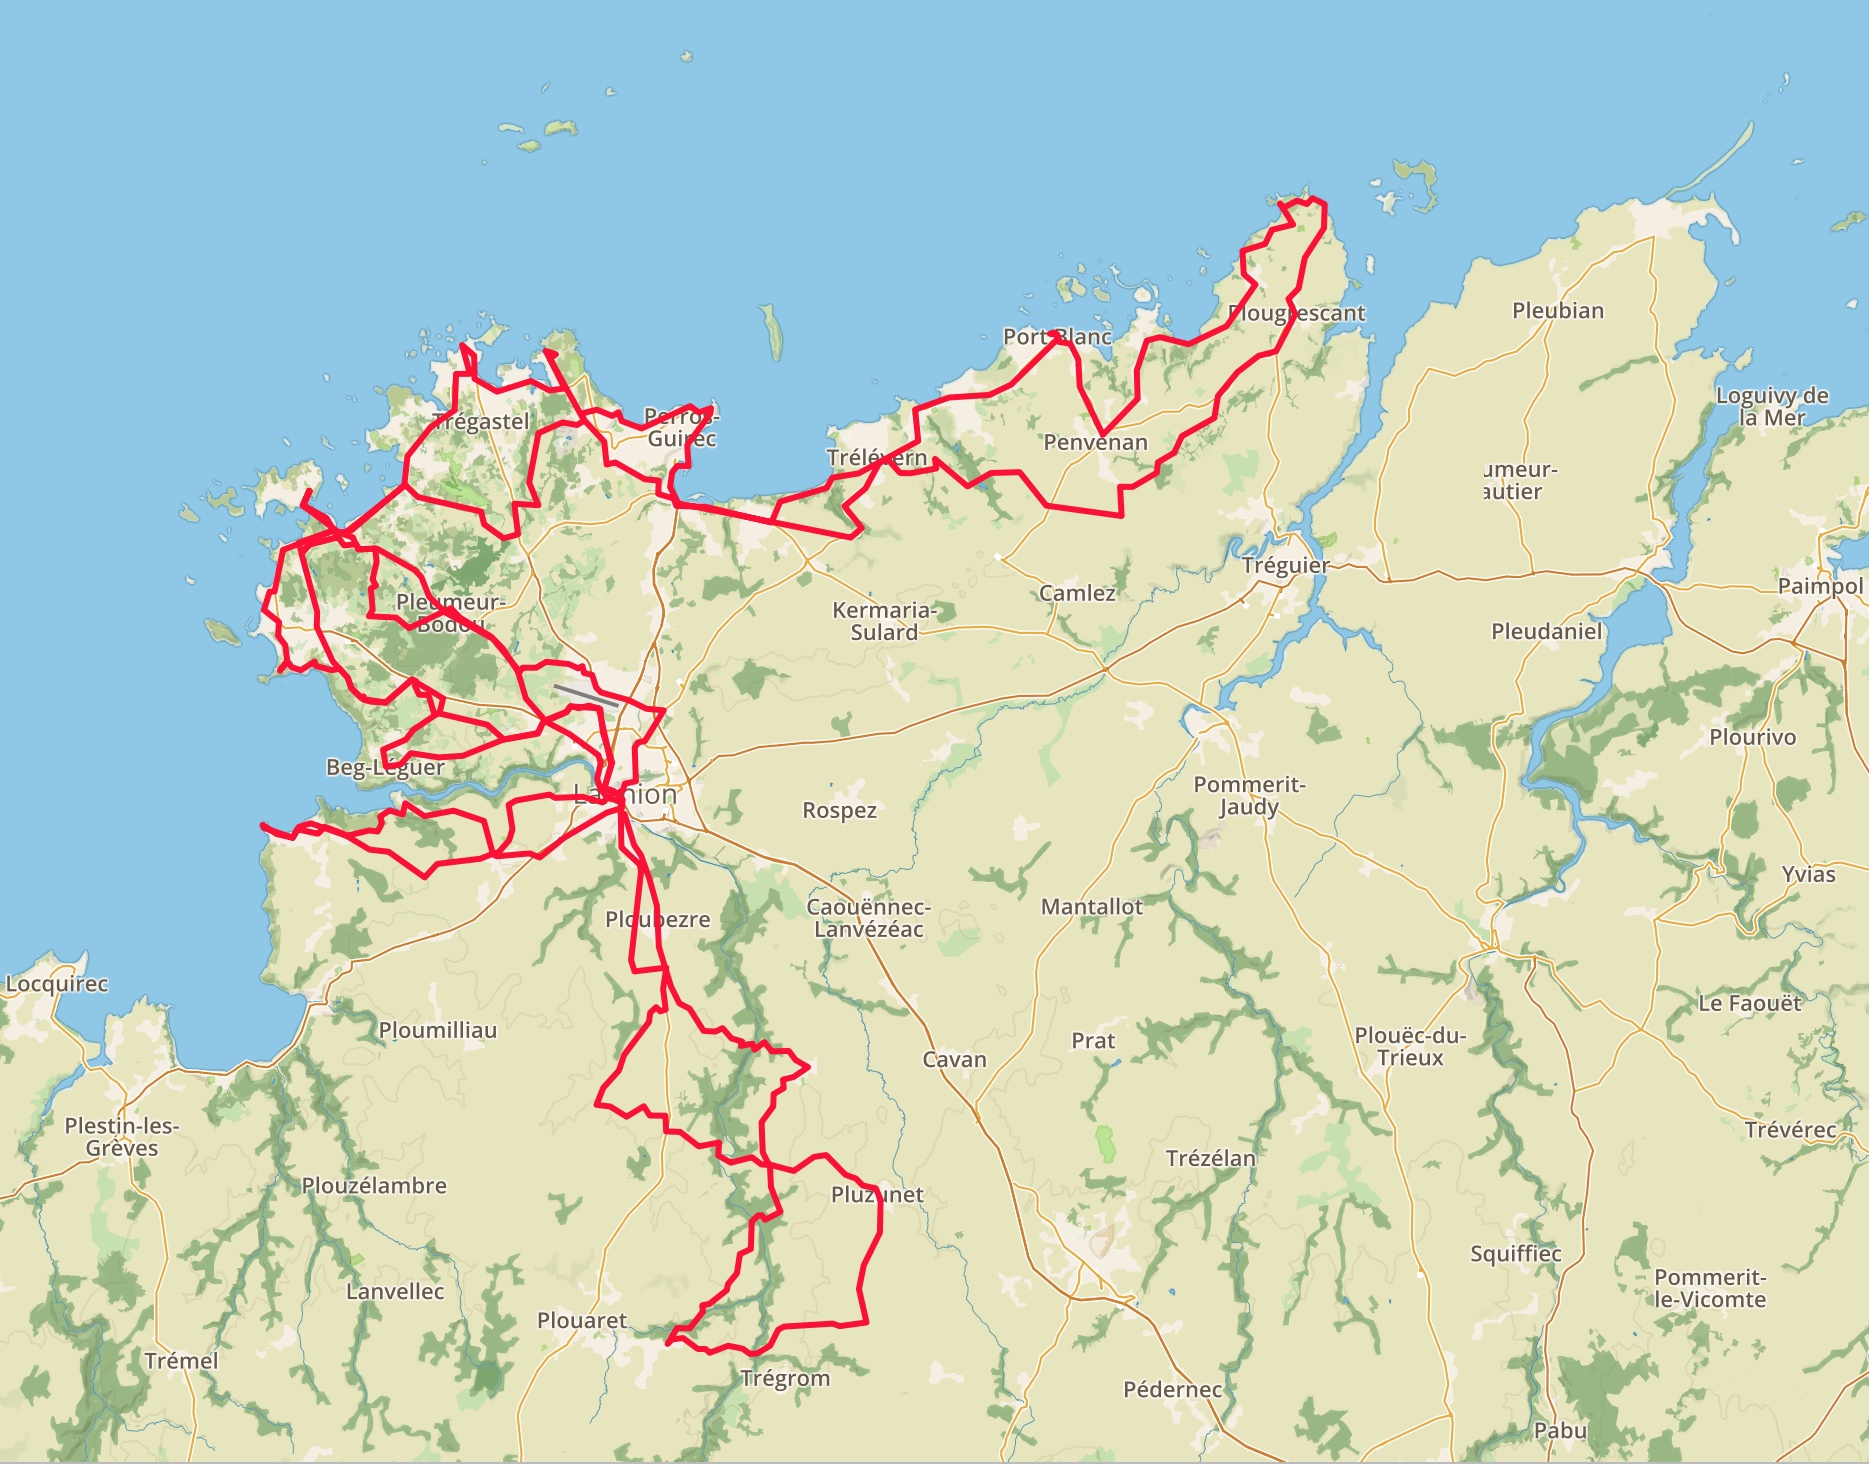
As usual I had no real plans for the year, but I still managed to make it somewhat special. First of all, I had quite a few nice rides in the Ardennes (and the Eifel, once even Clio joined me for a while along the Vennbahn), maybe not as many as I wanted, but still much more than the previous years. I hope to continue this trend in 2019 too, because I know the roads around Leuven way too well (and as I get older more experienced I seem to tolerate the crap infrastructure and the intolerant drivers of Flanders less and less). Furthermore, I had a really enjoyable (except maybe for that crazy thunderstorm with hail) cycling holiday in France with a small group of friends, and I also took the bike along to Bretagne where I made three nice morning rides (to make up for all those pancakes which we ate with Clio). Thanks to these non-local rides, I have ridden more on previously unseen roads than ever before. My biggest achievement this year was biking to the highest point of Belgium and the highest point of the Netherlands alone, which is now my longest solo ride with 306 km and 3057 m elevation gain (and by duration also my longest ride – including group rides too – with 11 hours and 32 minutes). Finally, my latest achievement is completing the Rapha Festive 500 in five consecutive days (I did it in 6 non-consecutive days back in 2015), being amongst the first thousand people who have crossed the threshold :)

The raw numbers for my cycling – without the daily commutes of course – in 2017:

Total distance: 12704 km
Total elevation gain: 101385 m
Total time: 460 h 31 m
Activity count: 192 (over 155 days*, just like in 2017)
Average speed: 27.6 km/h
Average heart rate: I stopped wearing a HR strap, I only look at power now.
Average cadence: 87.5 rpm (but I have no sensor on my cross bike)
Average temperature: 13.2°C (coldest: December with 1.9°C, hottest: July with 22.4°C)
Total calories burned on the bike: 302730 cal

*Starting from the last days of July there were a lot of days when I did my training rides immediately before and/or after work, and on those days I rode my race bike also to work to save time, therefore creating days with two activities (of which one was most of the time less than 5 kilometres).

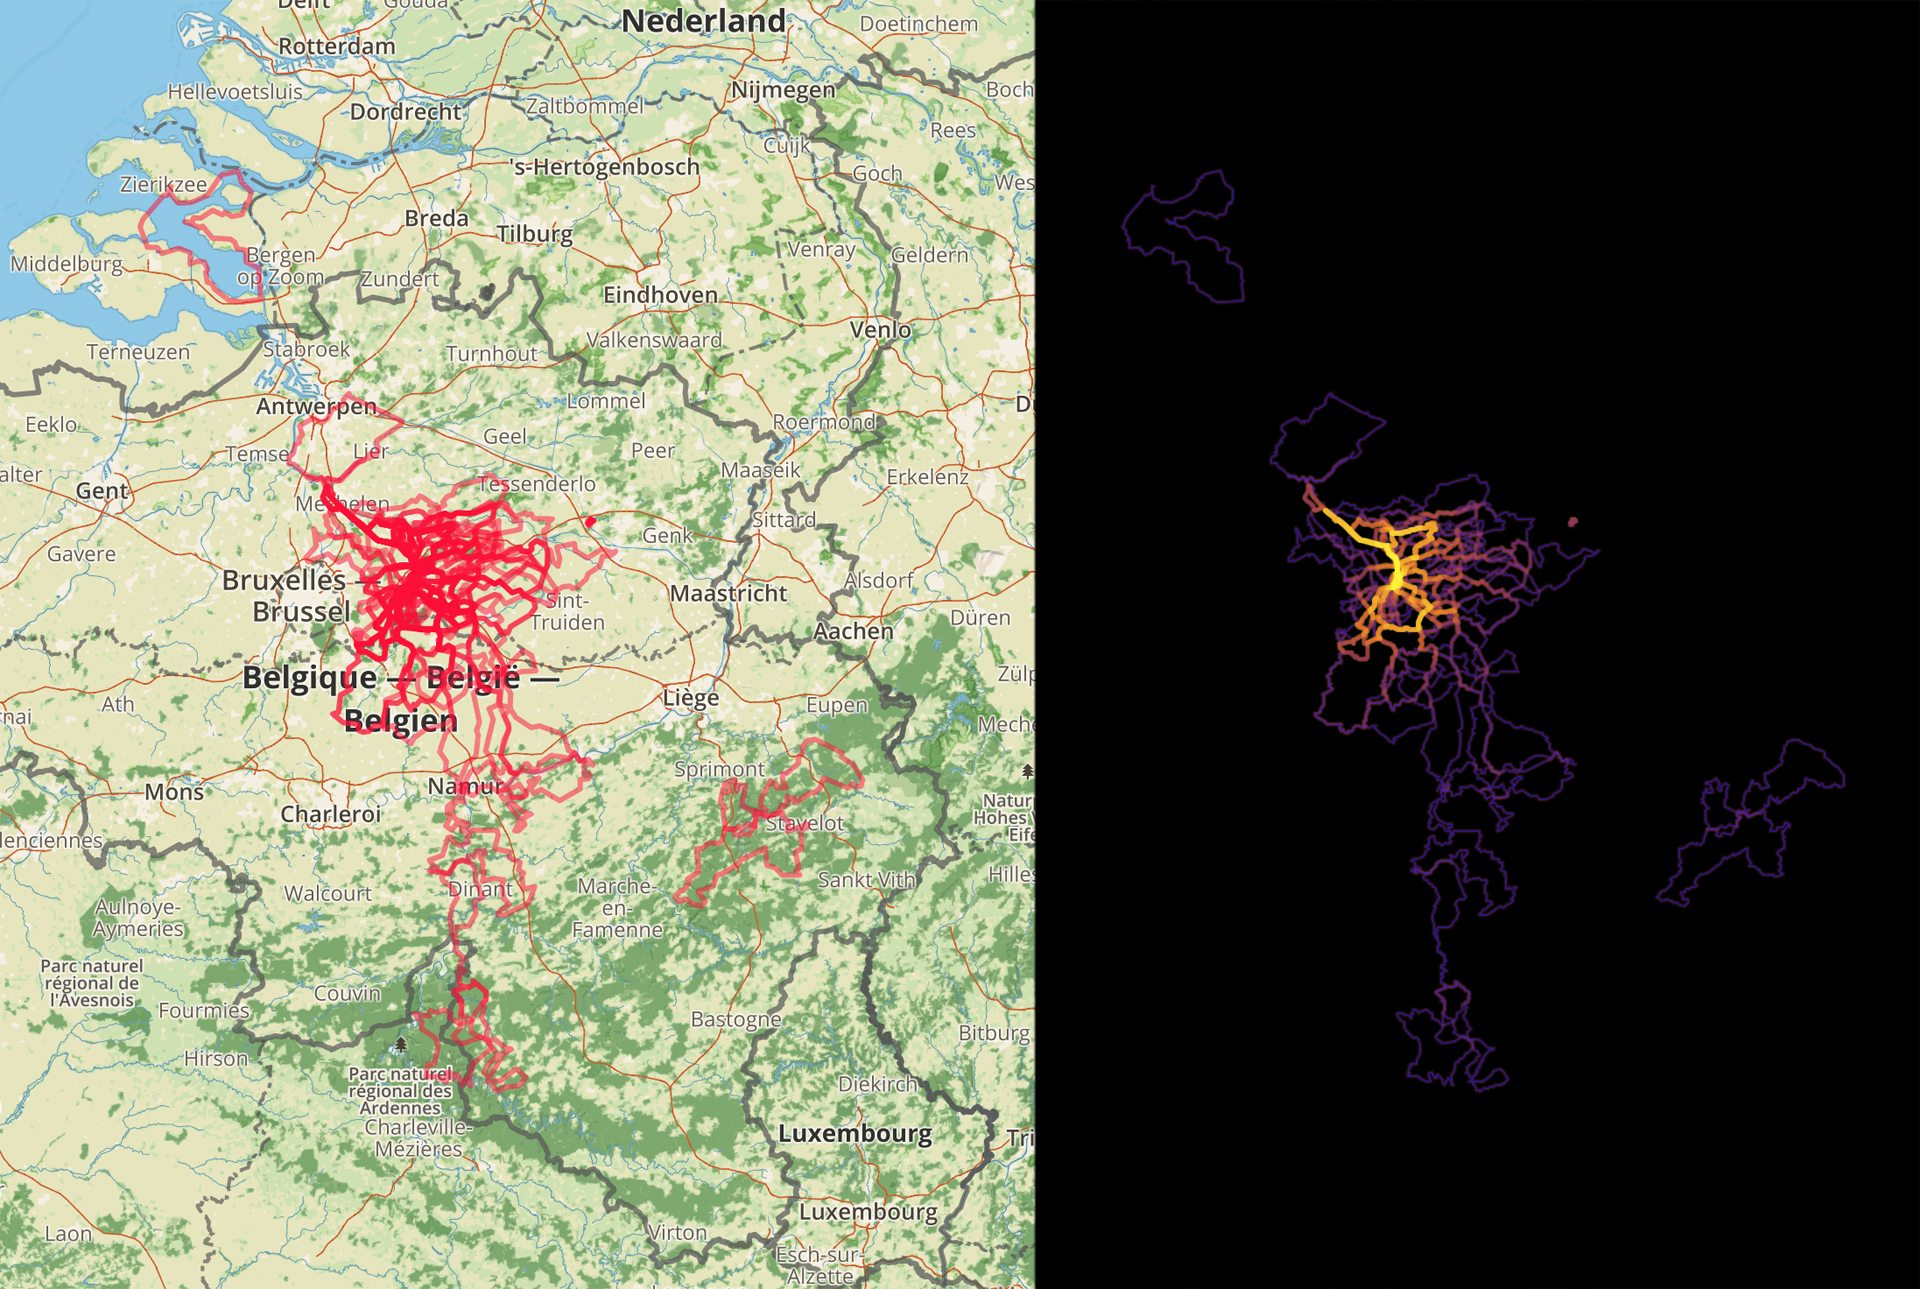
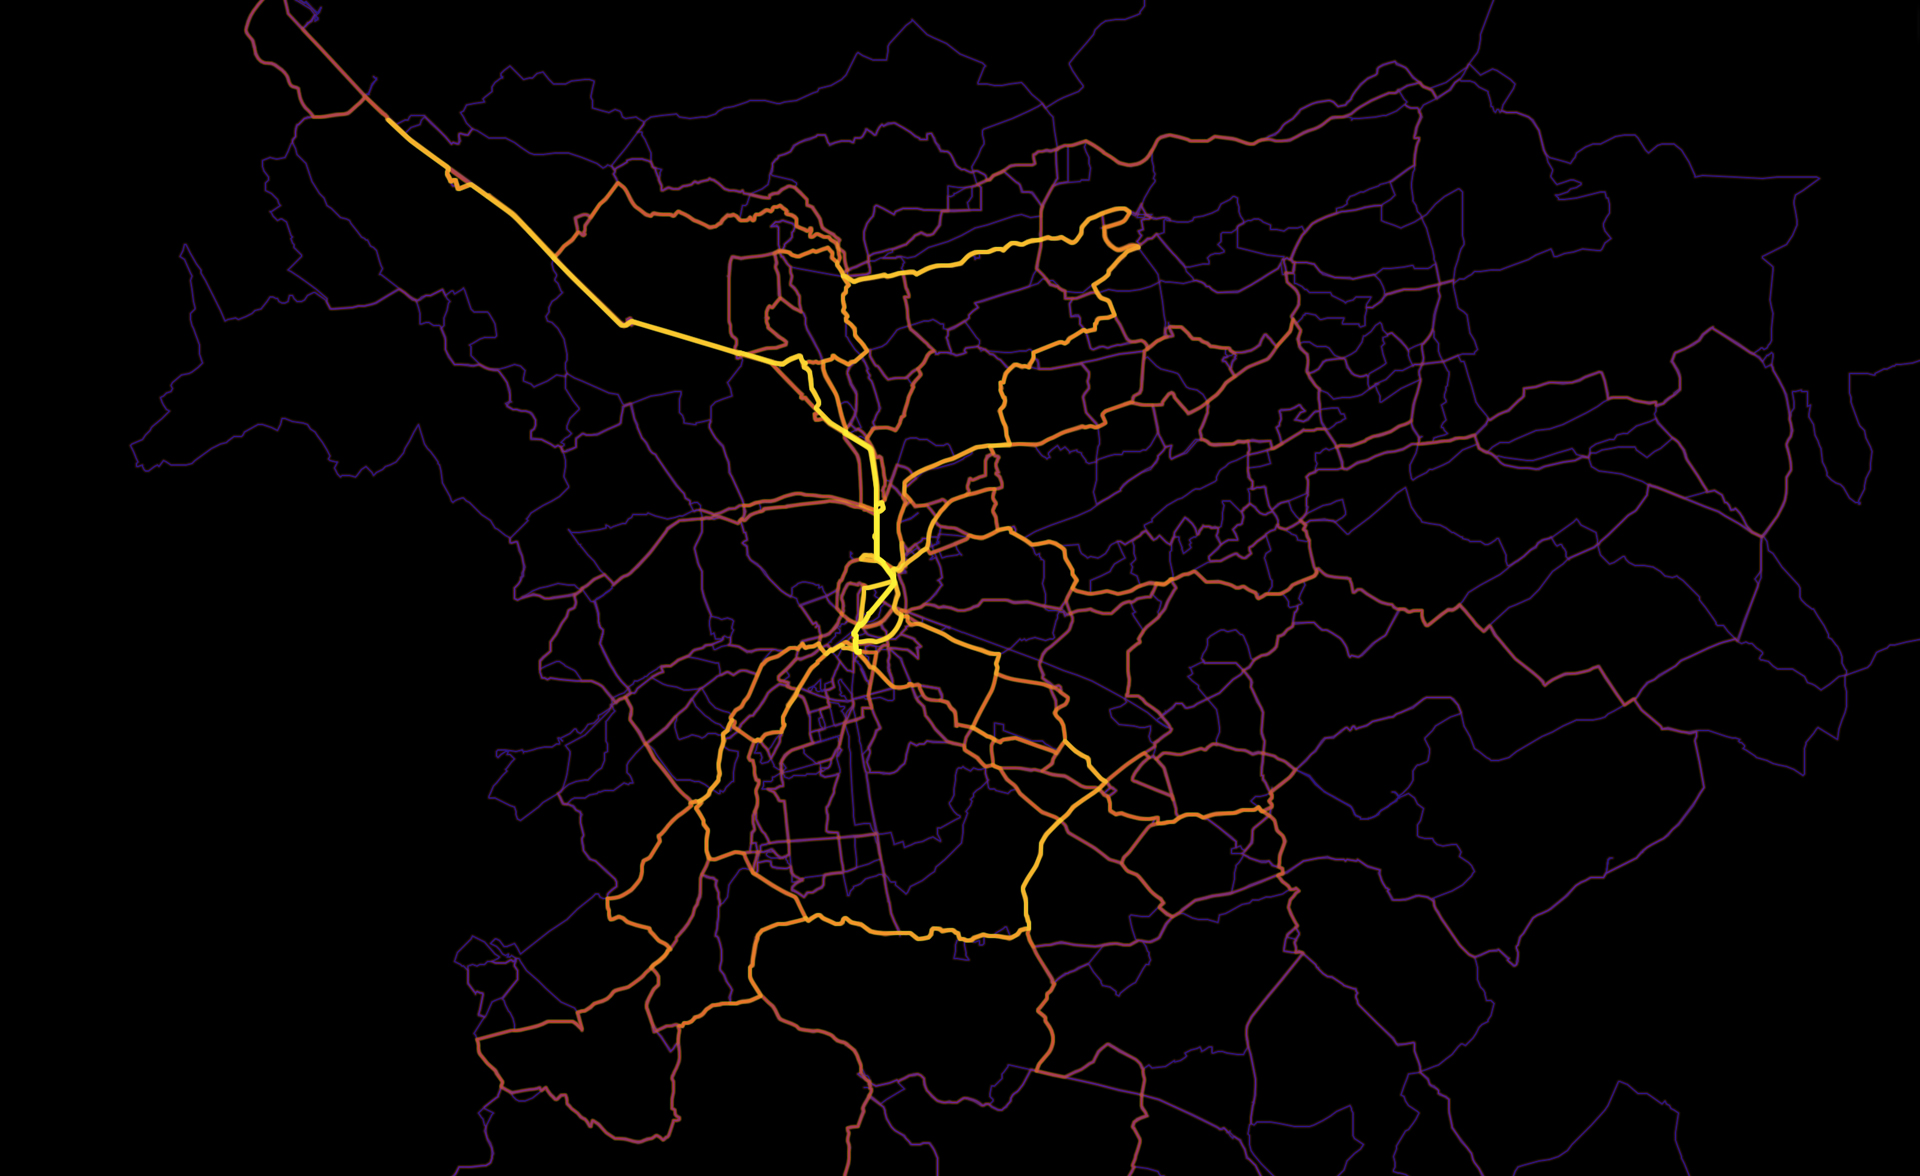
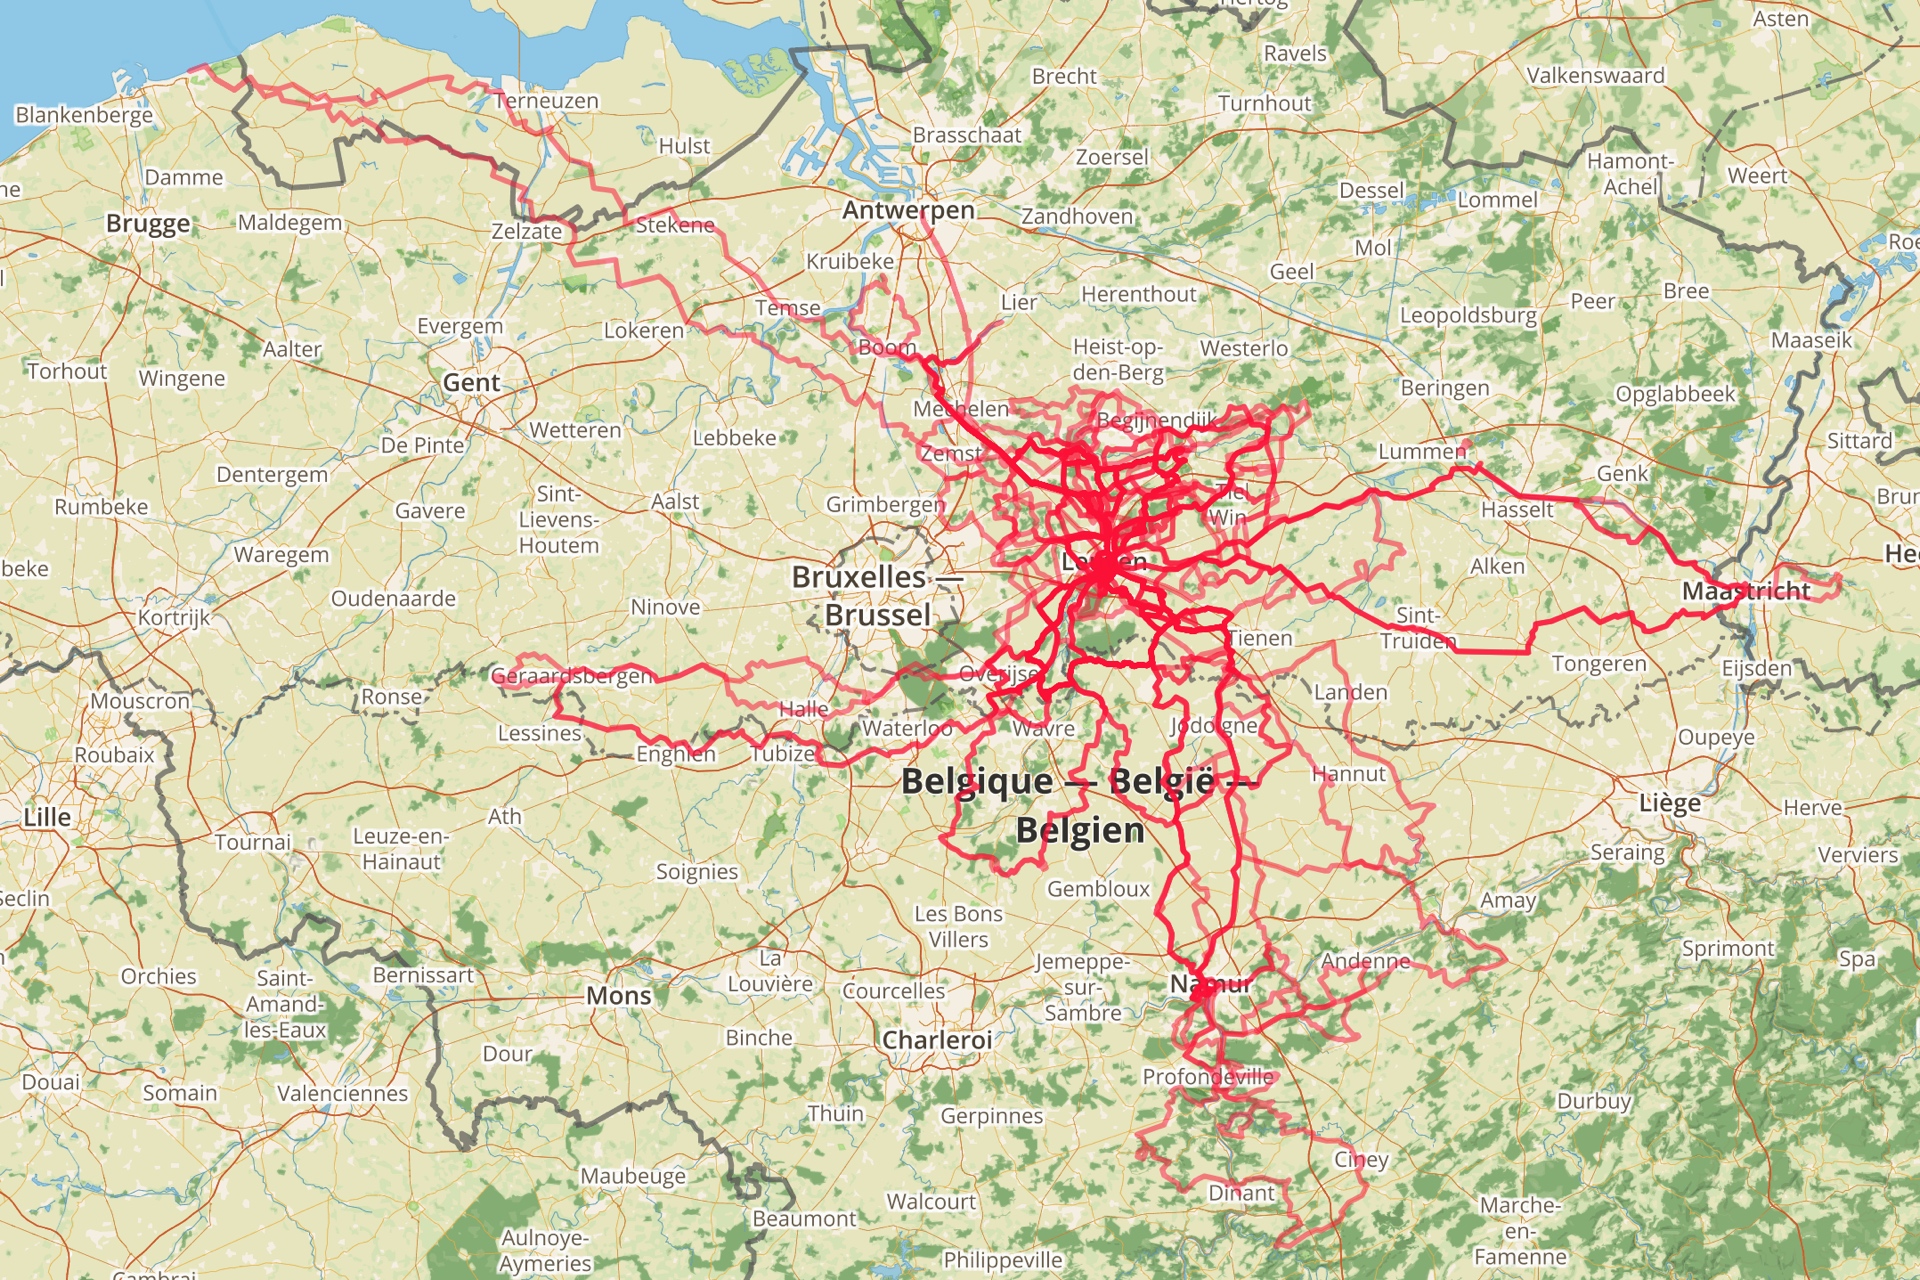
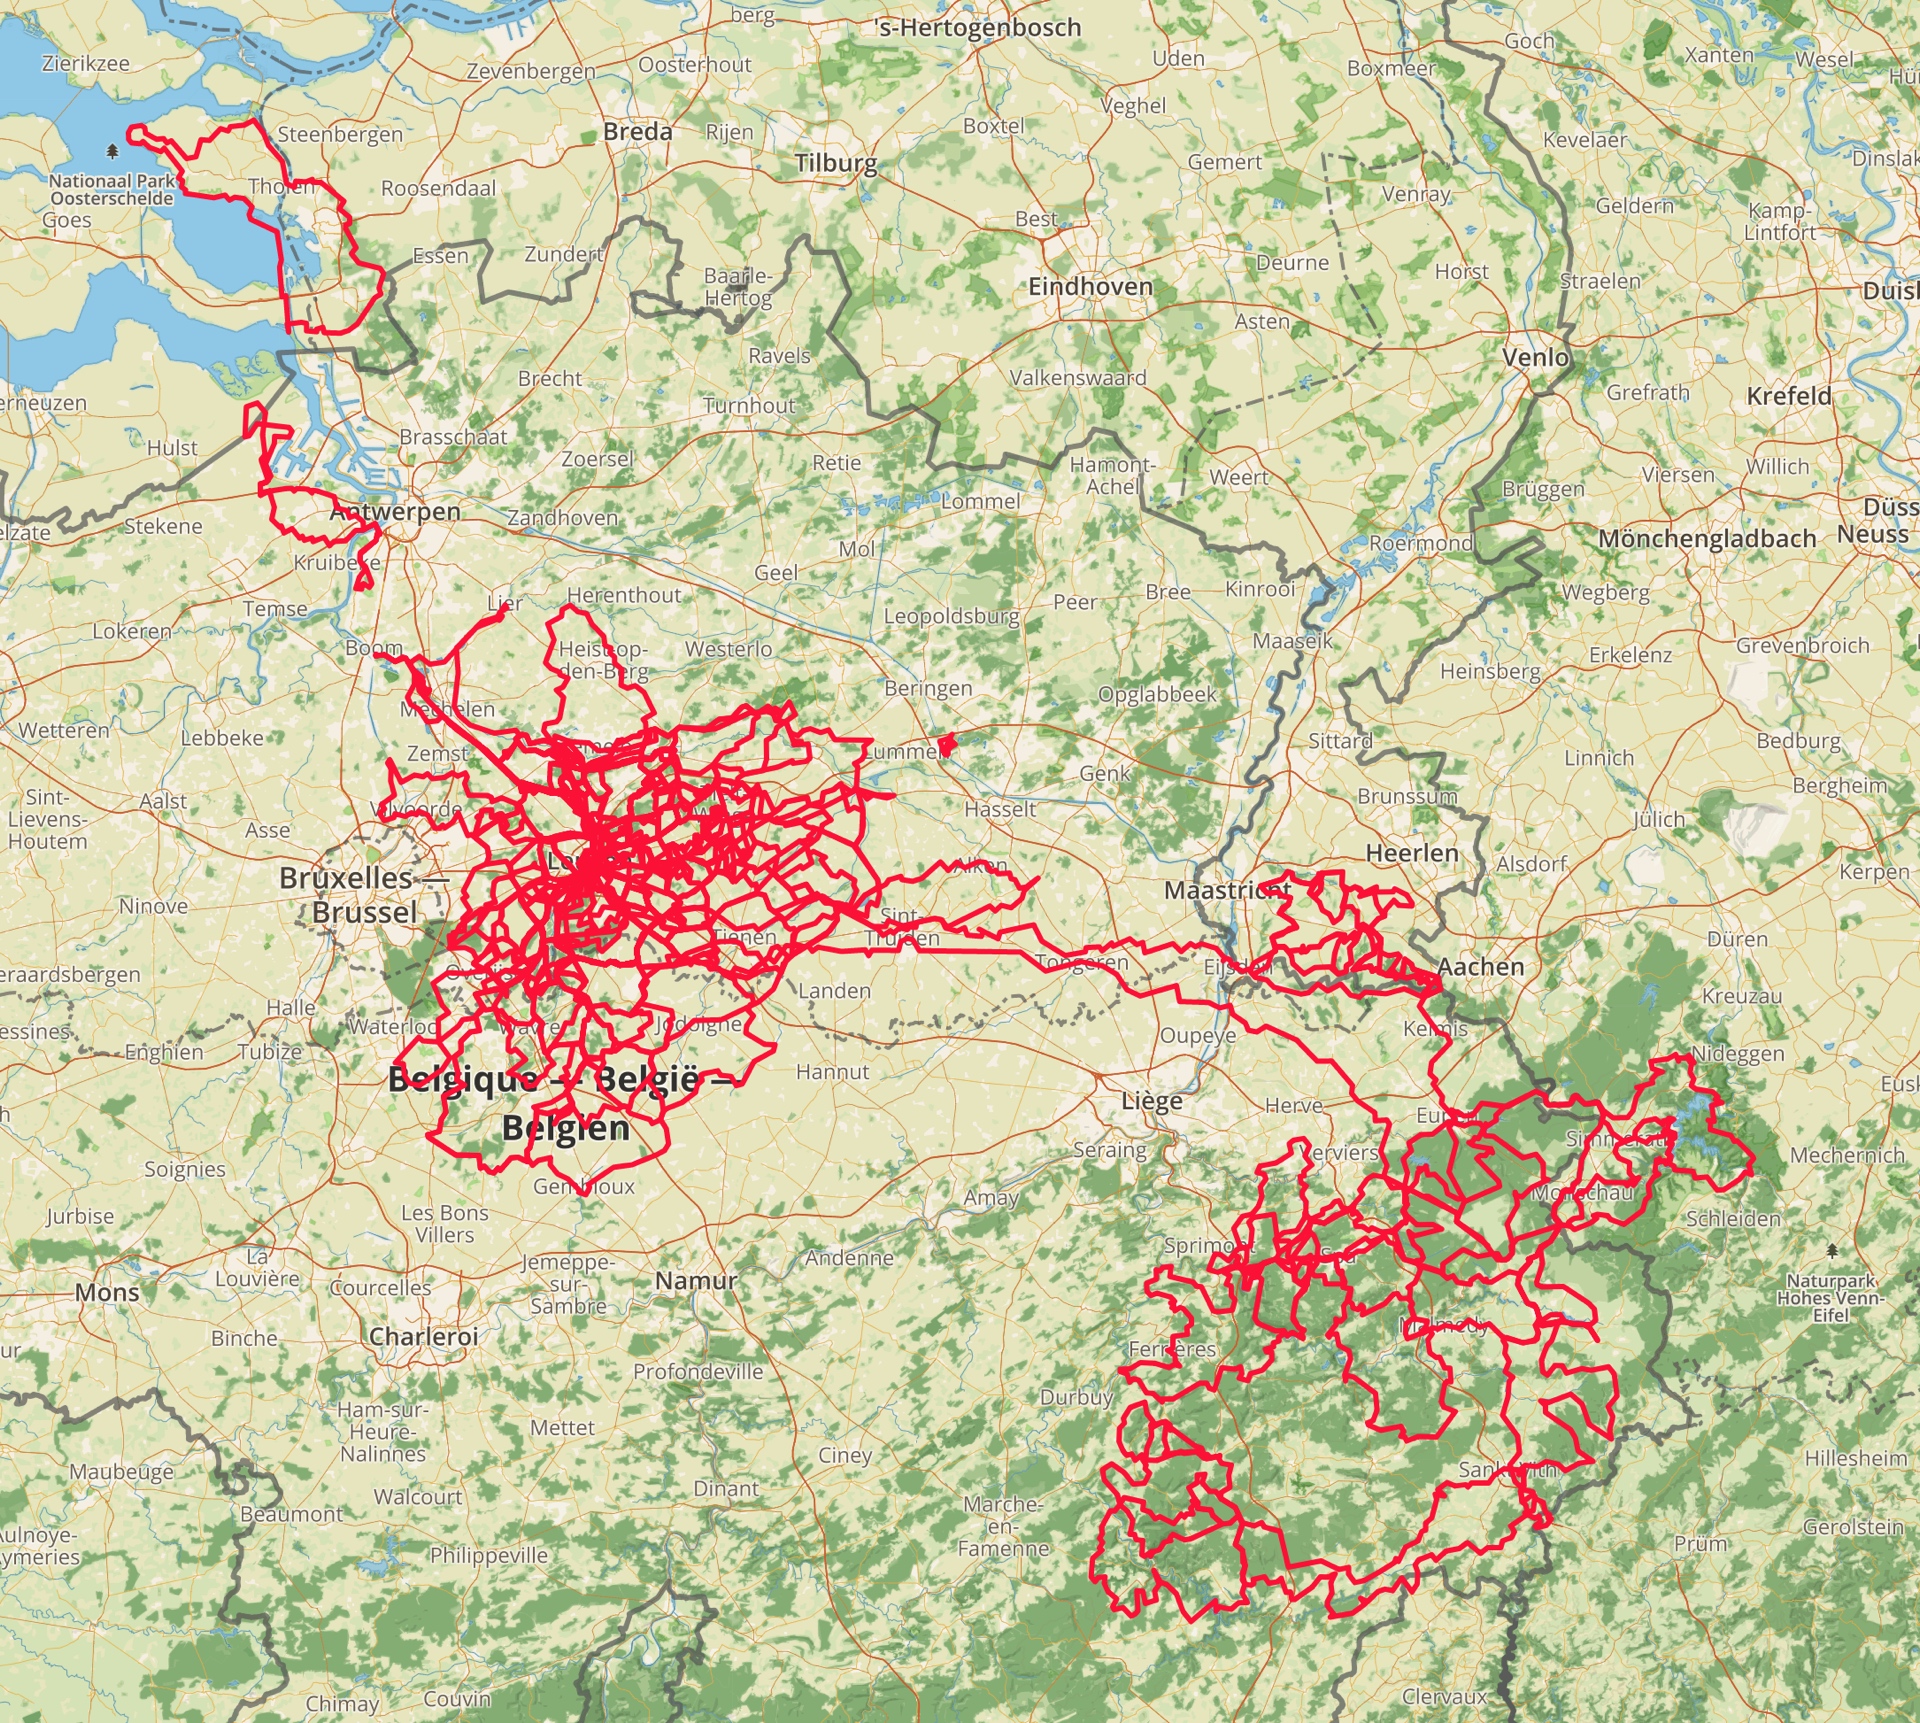
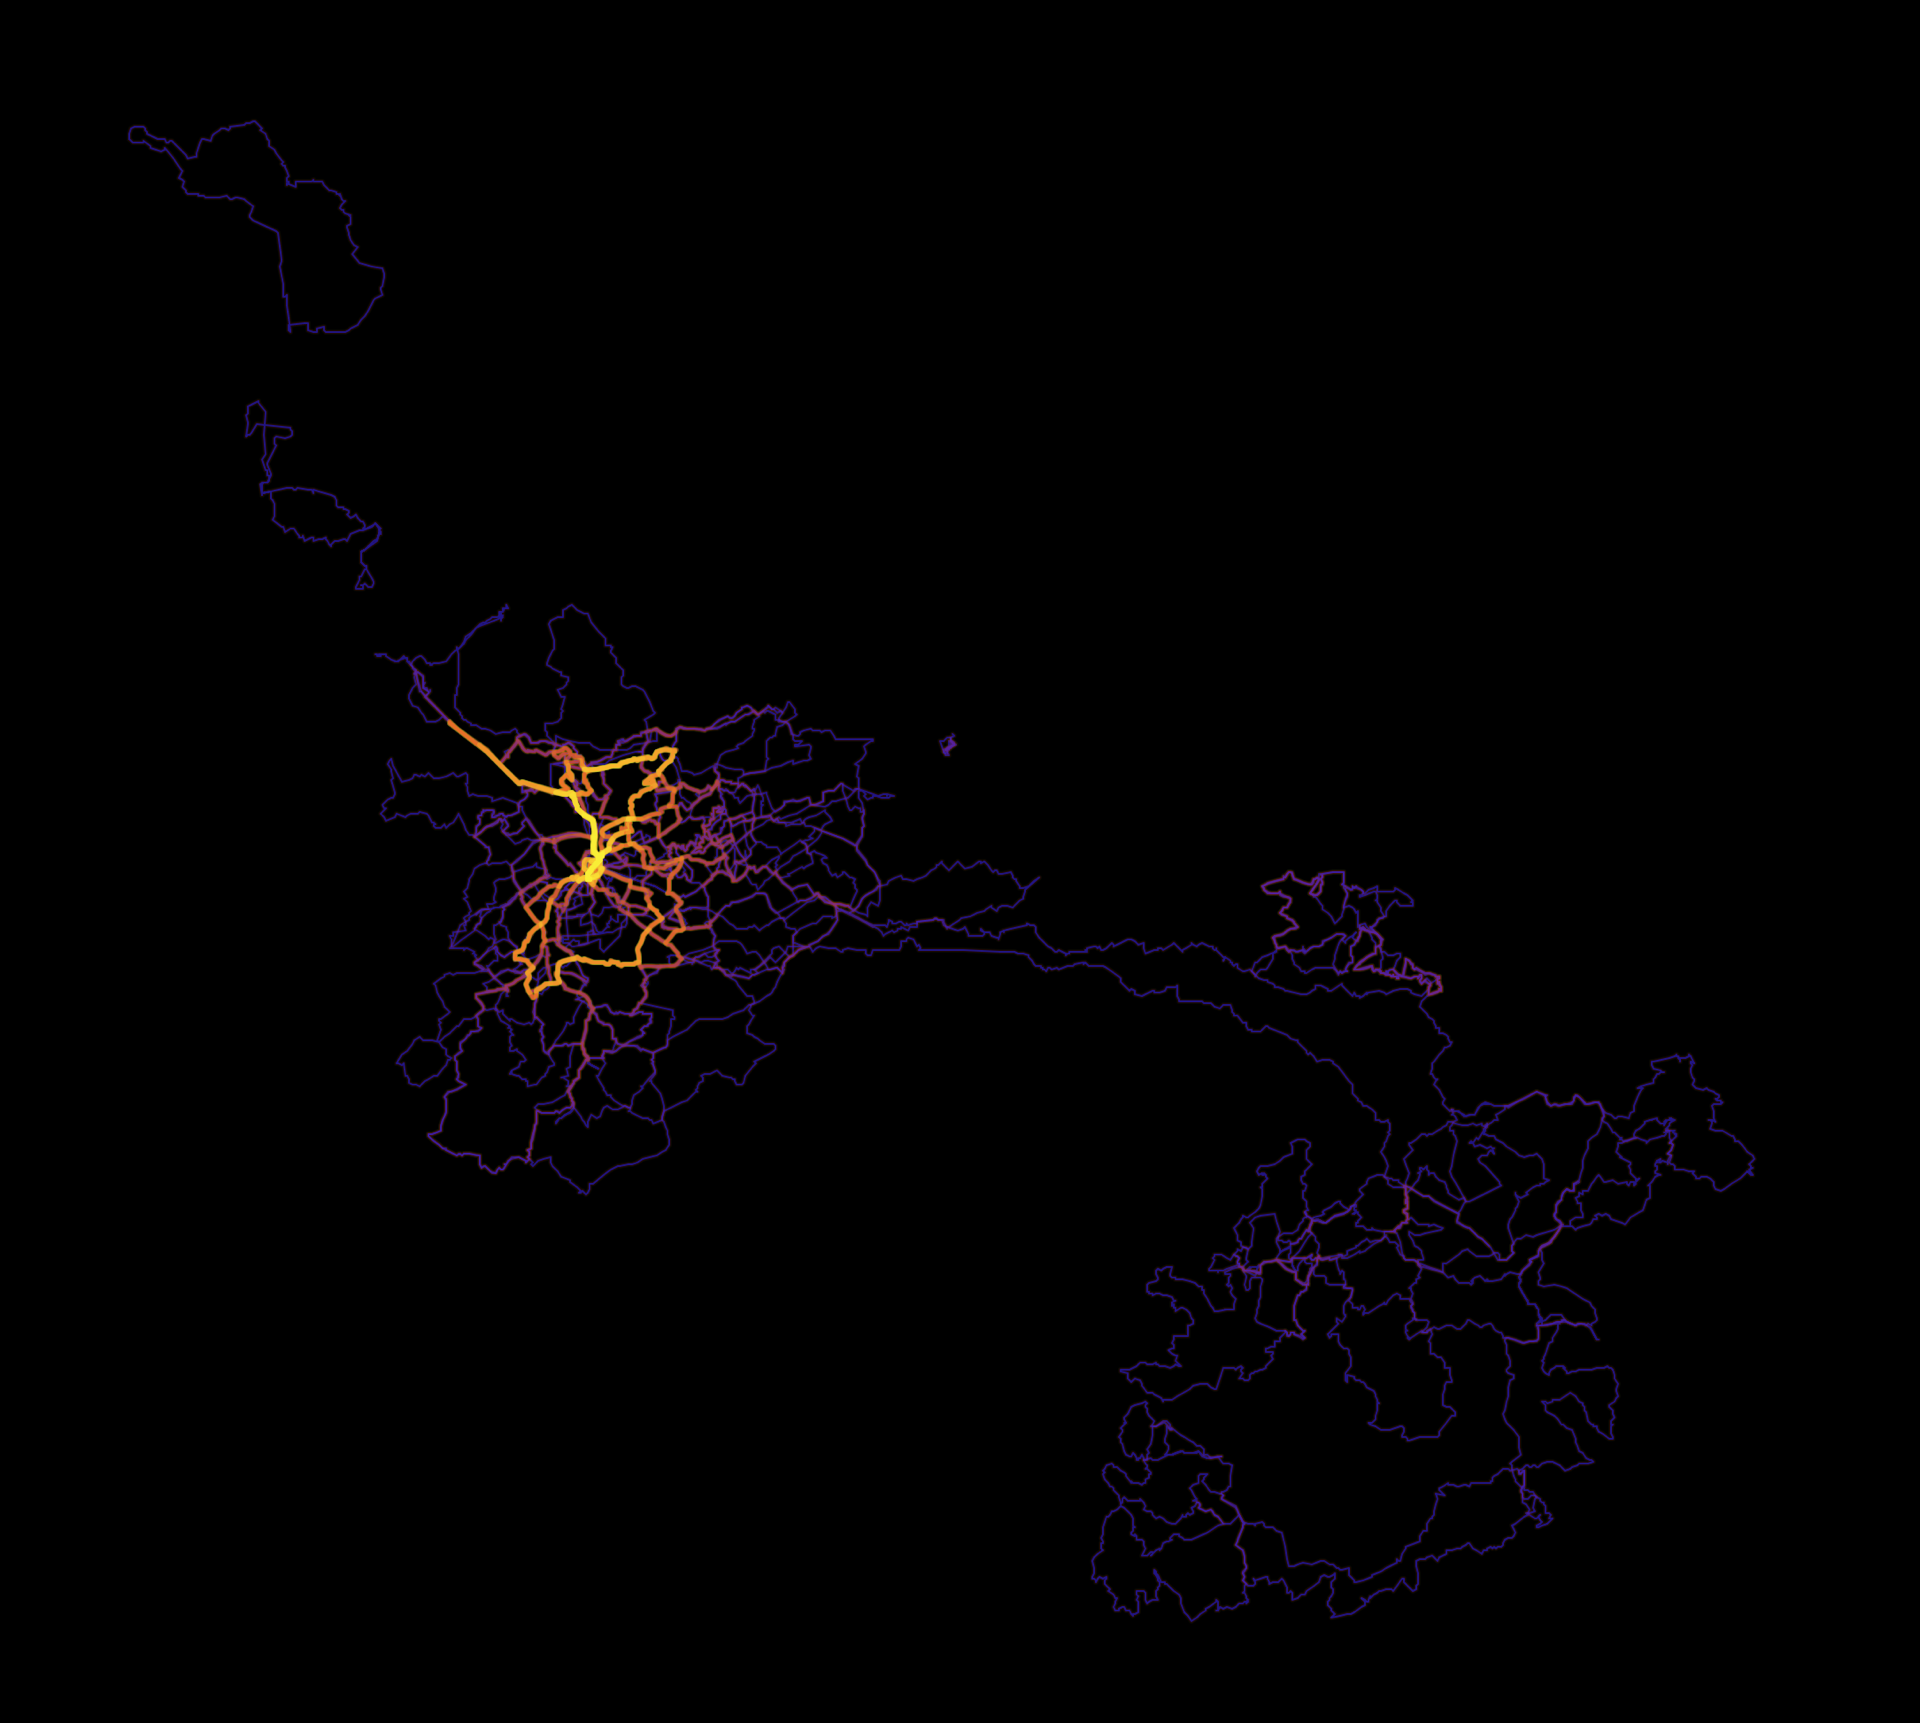
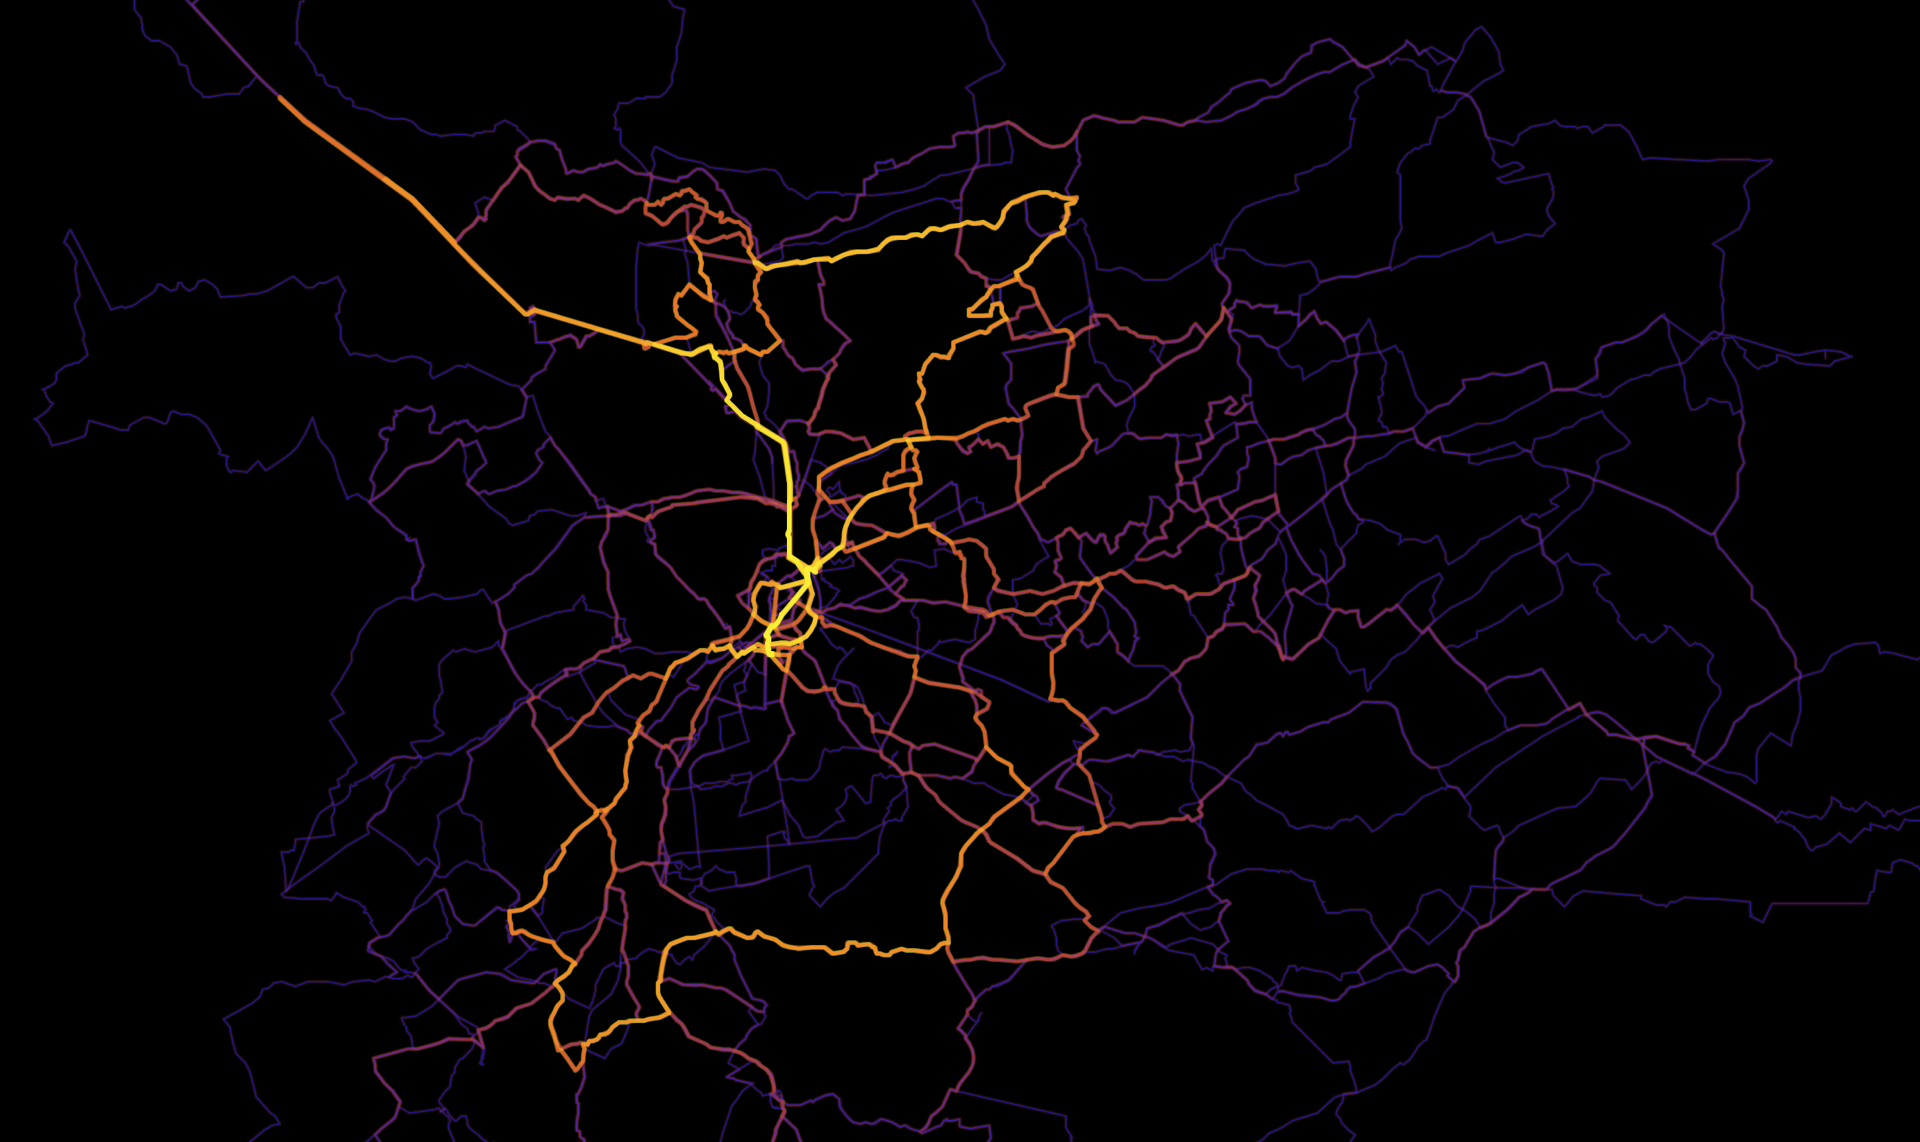
And now it is time to look at some maps and figures. Let’s start with the maps of cycling I have done this year. The first figures show the location and (for Belgium and the area of Leuven on a separate zoomed-in map) heat-map of my rides.

Out of the 155 active days, I rode solo most of the time: only on 44 days was I riding with at least one other person. As usual, most of the time that was Willem (22 rides, and a total time of 2.9 days), or Hao (17 rides, 2.4 days). The distribution of these non-solo rides over the year can be seen below.

The next one is a summary table (click for legible size) of the bikes I have been riding during the year. I used the new Endurance and the old Ultimate parallel until I sold the latter early October (to make space for a new custom built steel bike that I am working on right now).

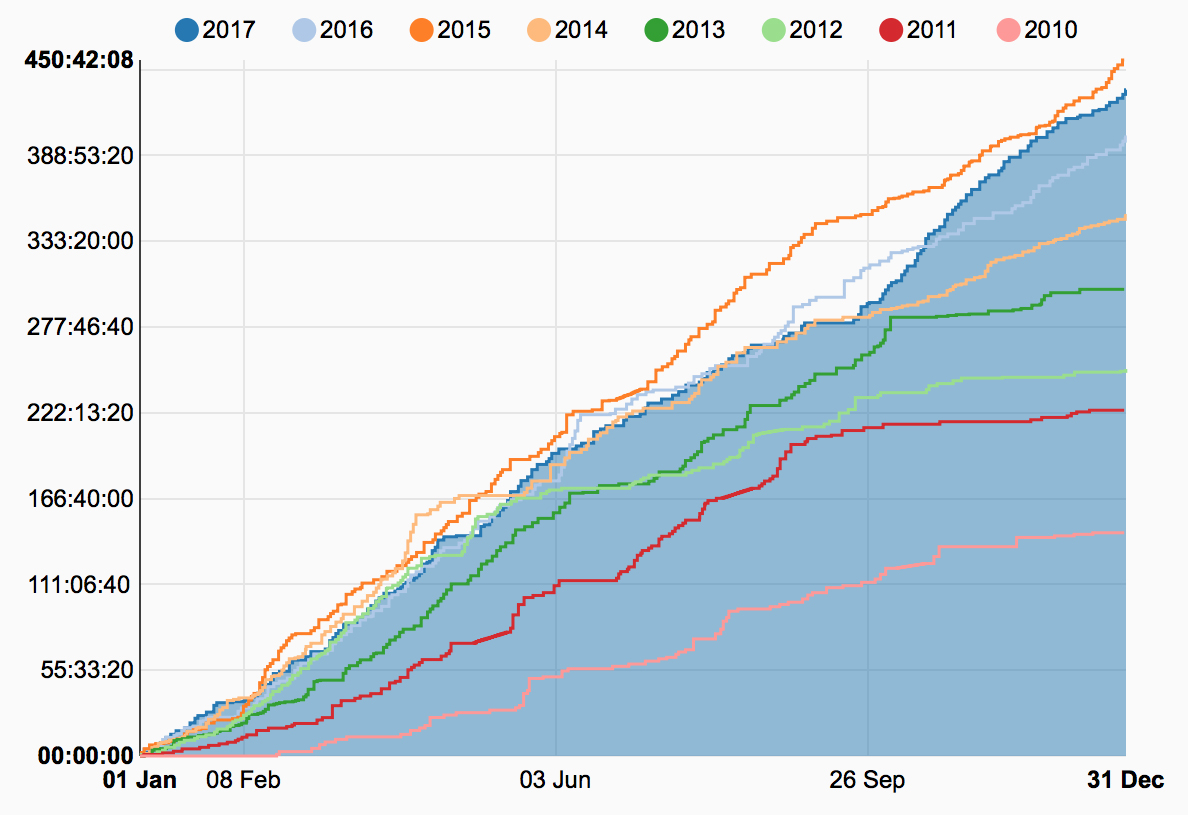
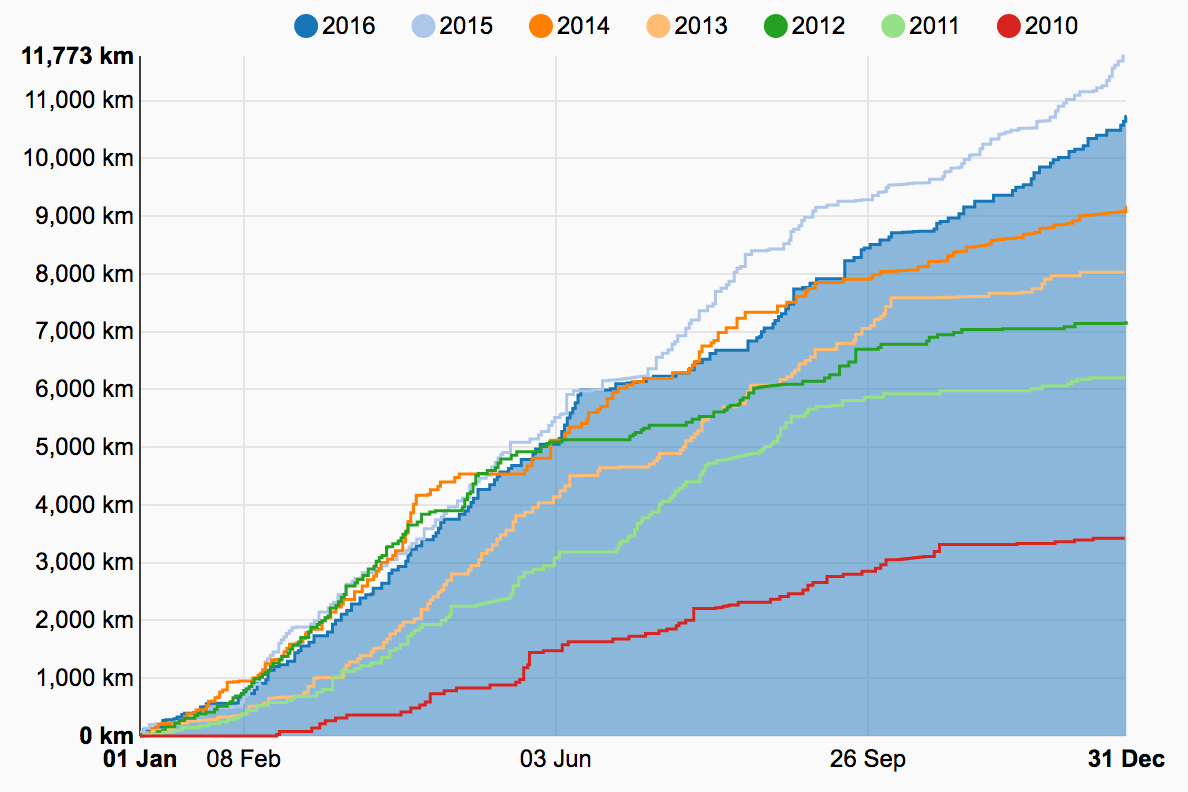
Here are the graphs showing the yearly evolution of my cycling distance, time, and elevation gain compared to the previous years.

New this year are some monthly figures, because the more the merrier, right? So below you will find the monthly totals and averages for distance, elevation gain, activity time, average steepness (meters climbed each kilometre on average), and average temperature.

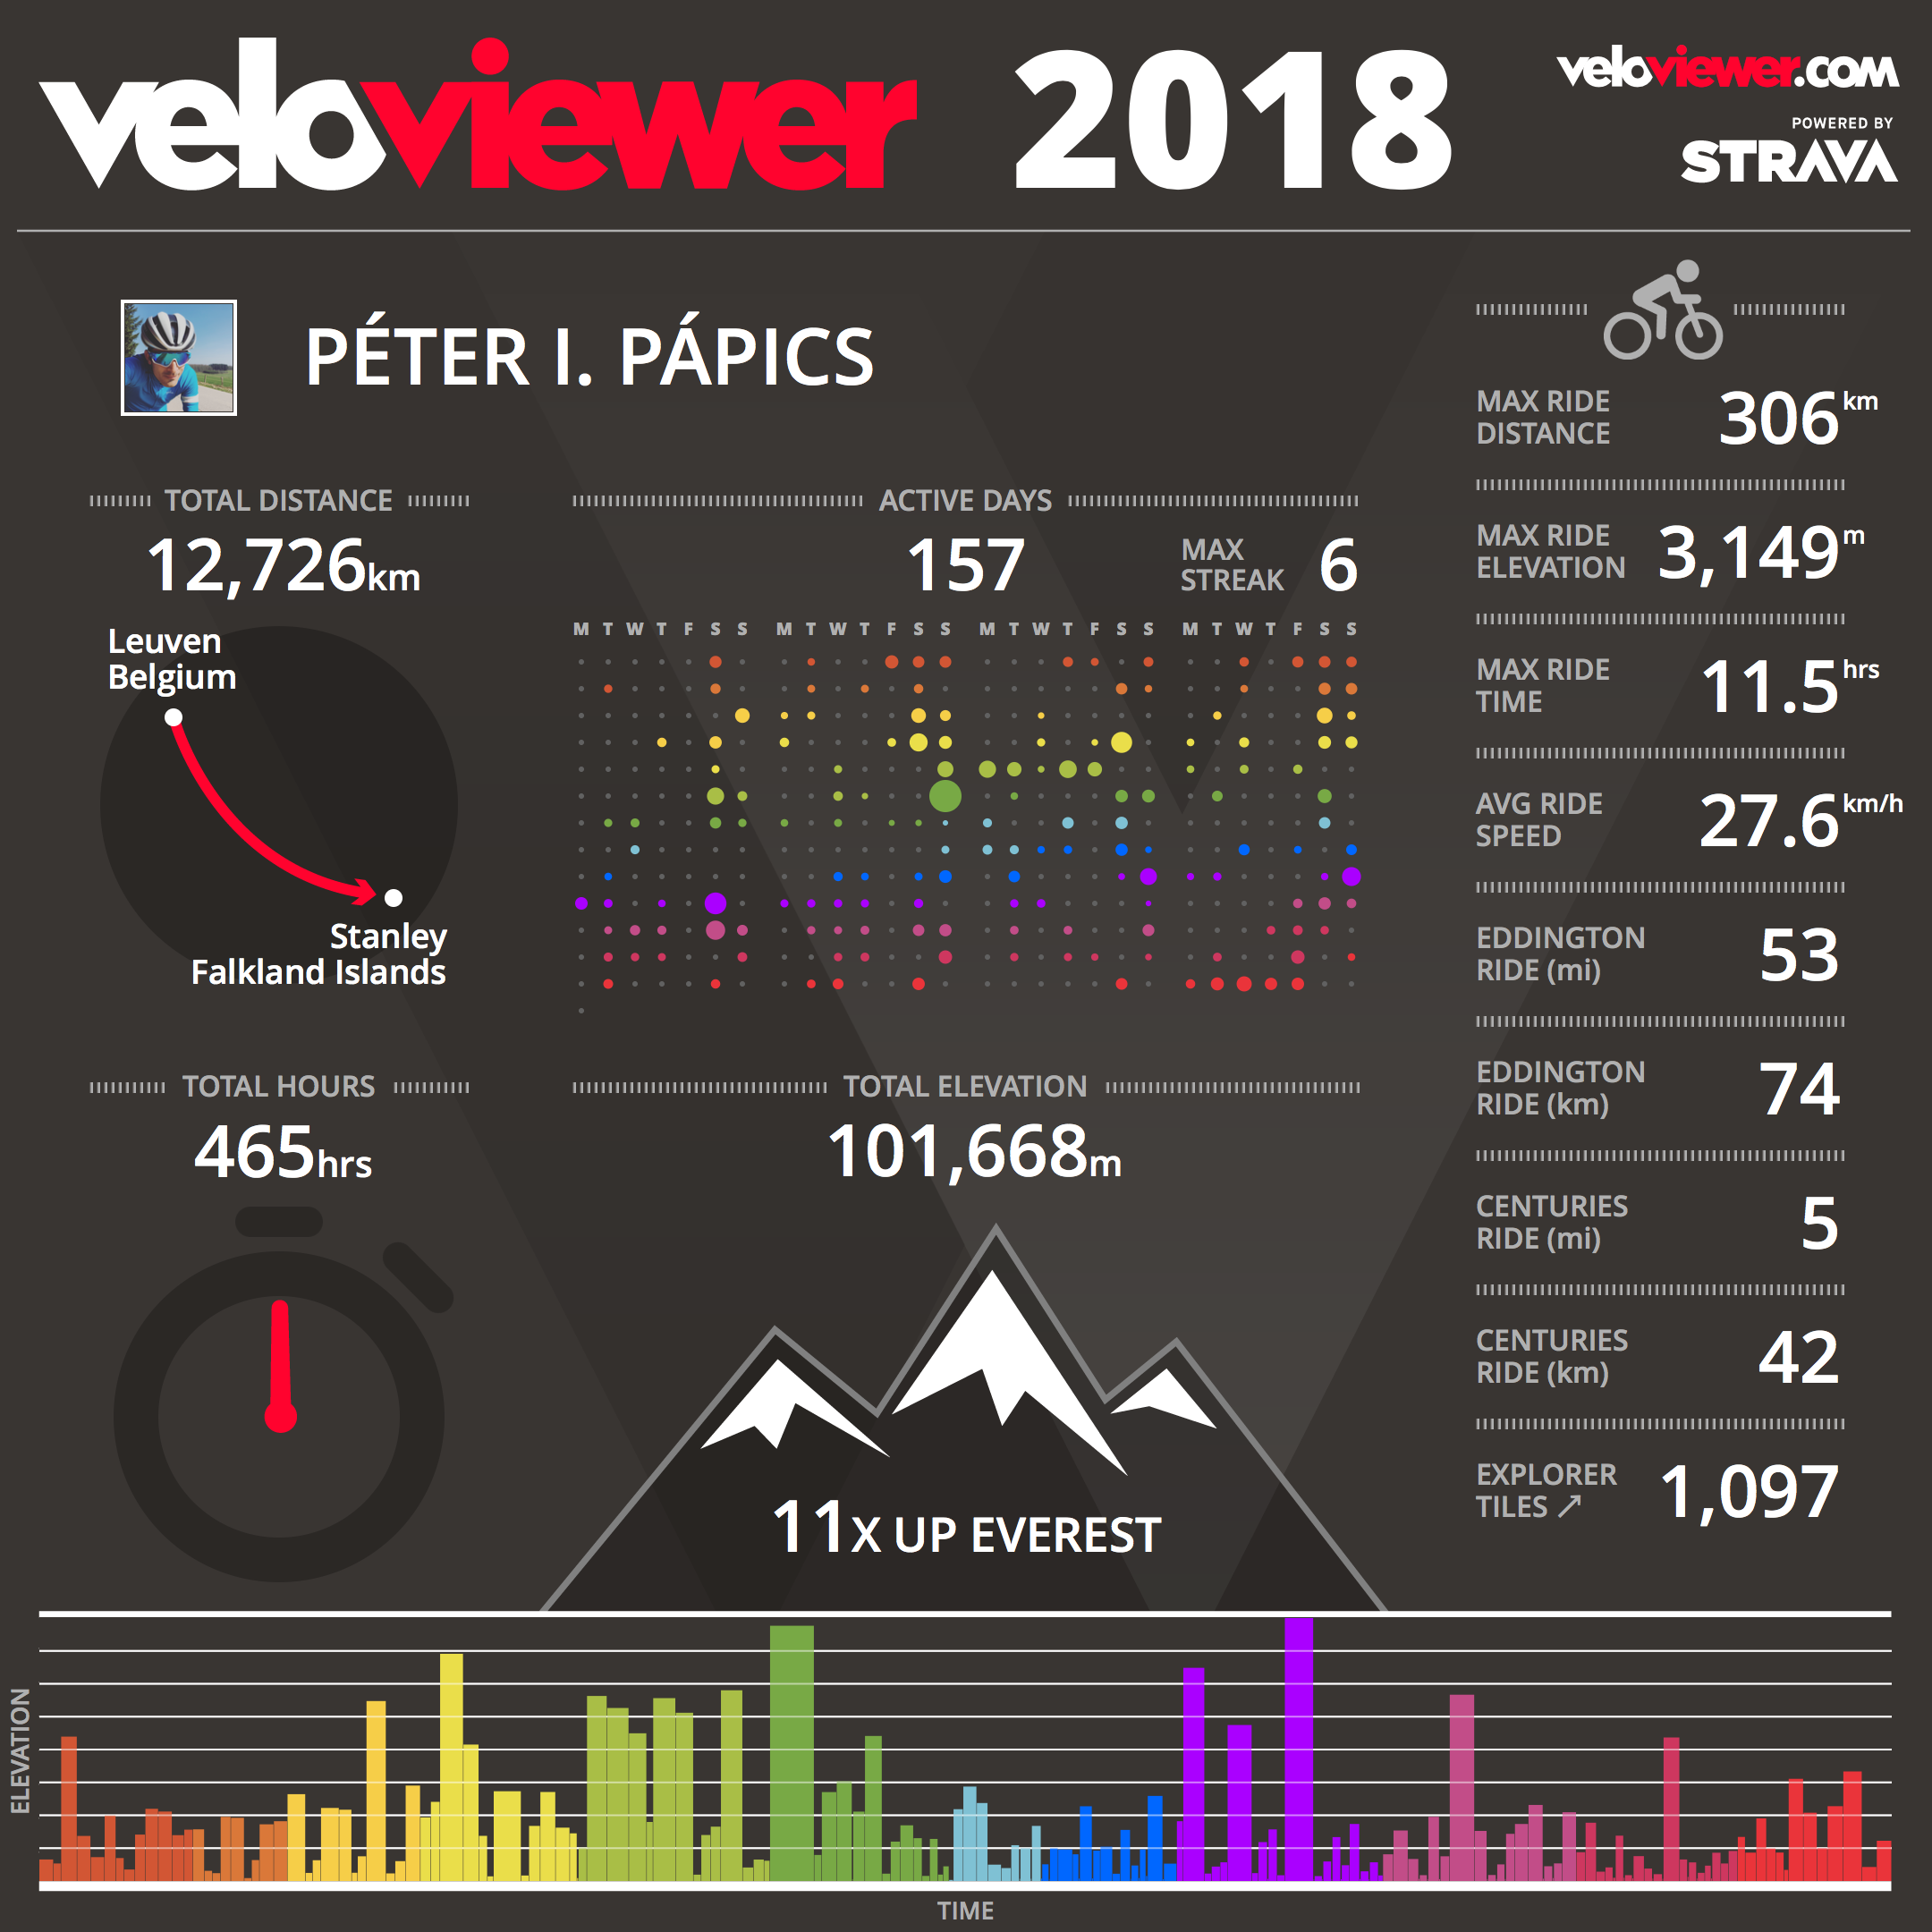
My non-cycling activities reached a long-time low, with only a tiny bit of hiking (17 km), and kayaking (4 km), so this is the first time since 2012 that I did not run at all (and I did not miss it to be honest). Here is the usual summary figure (including all activities) from VeloViewer.

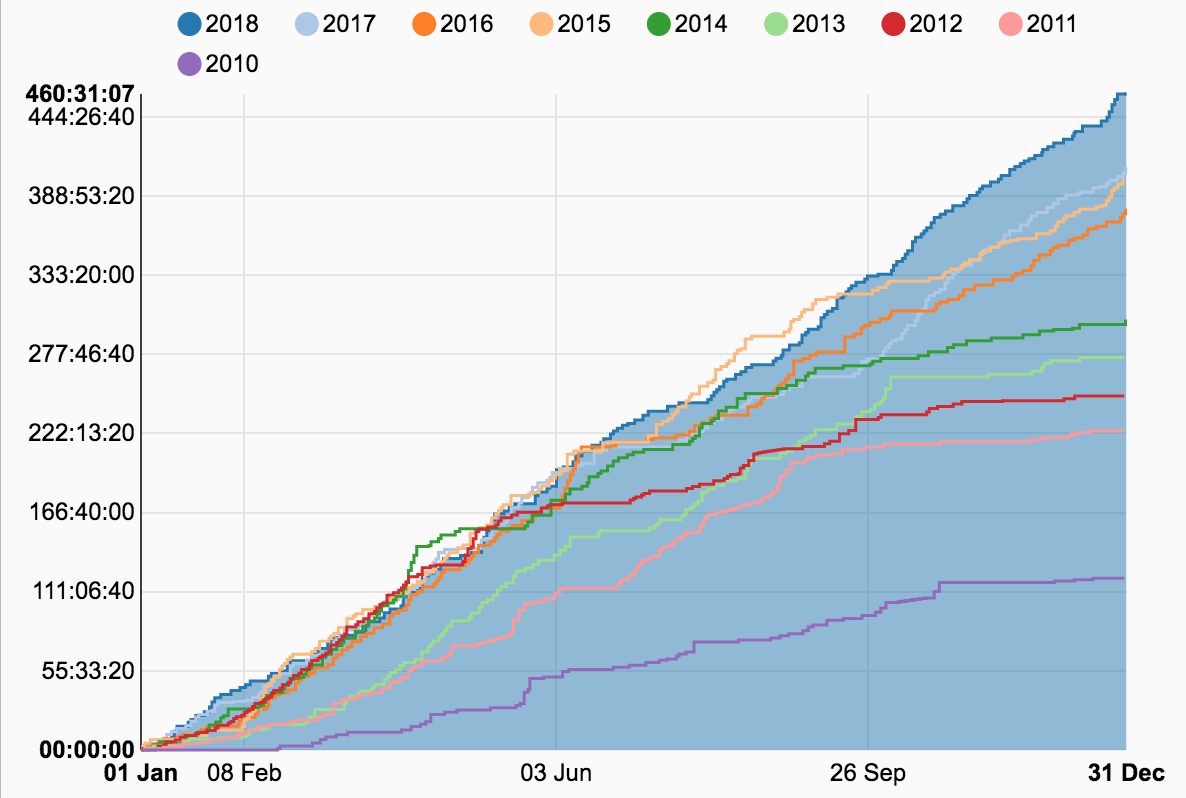
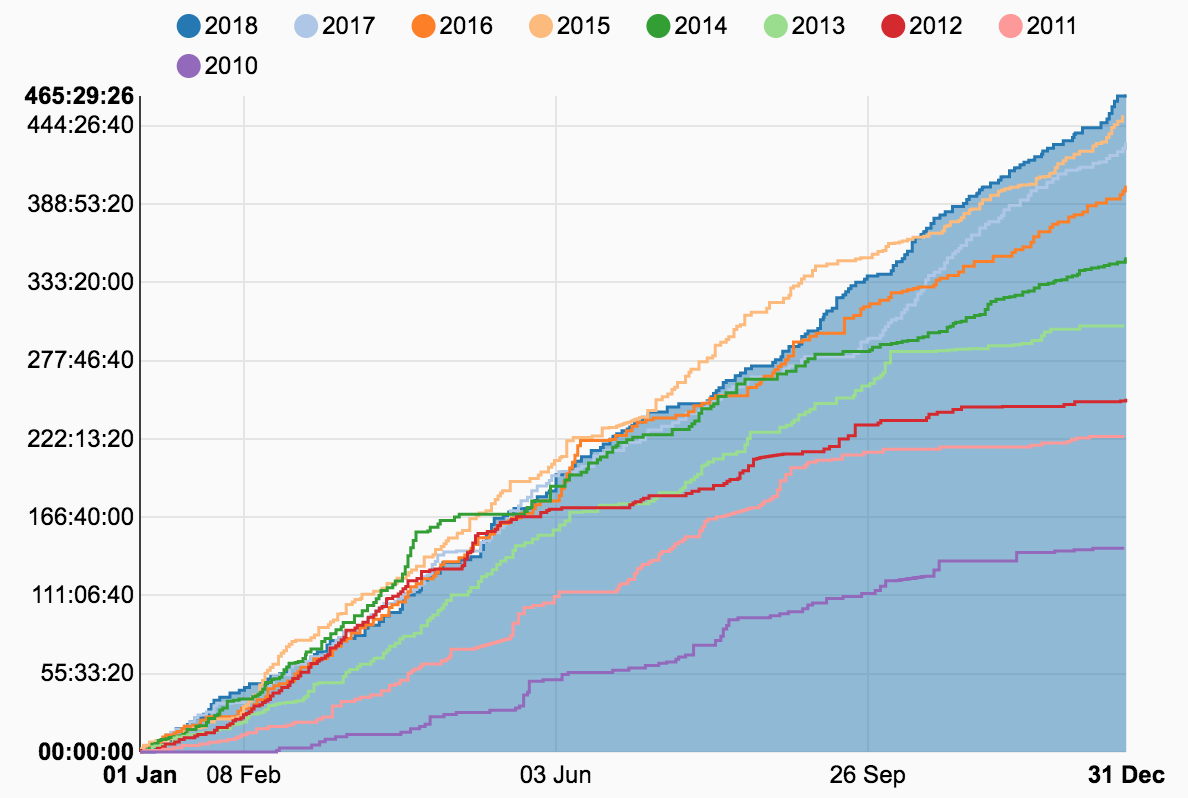
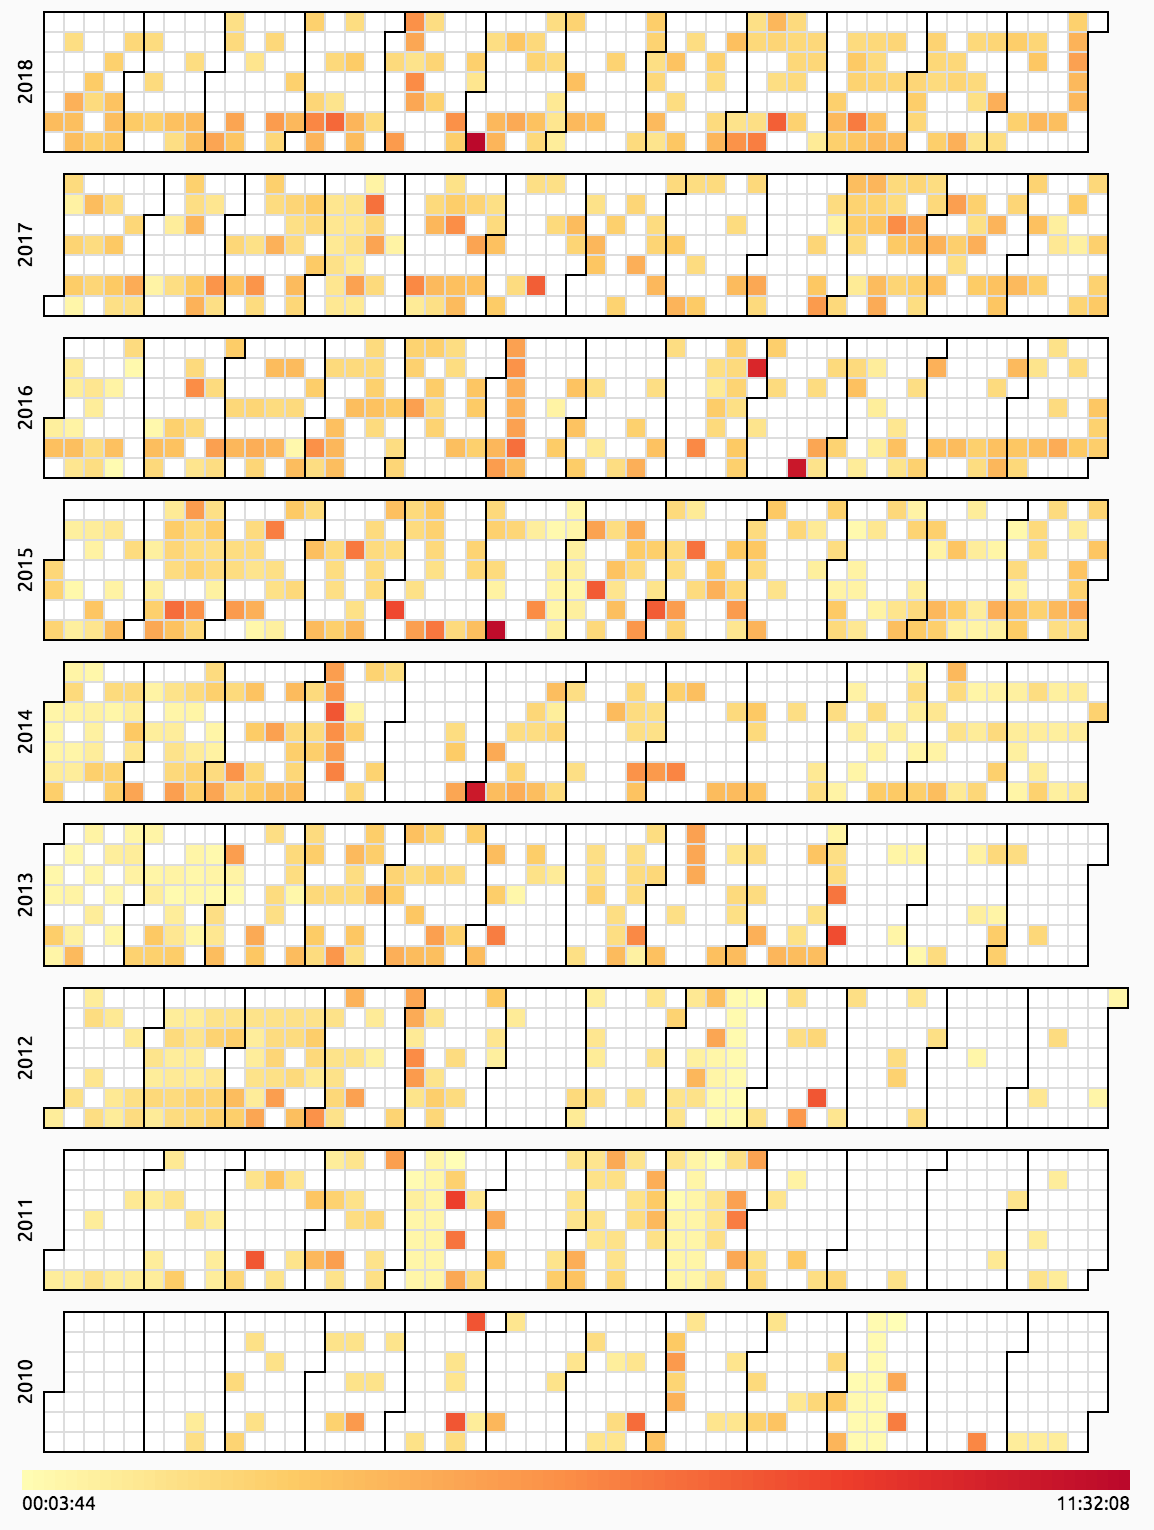
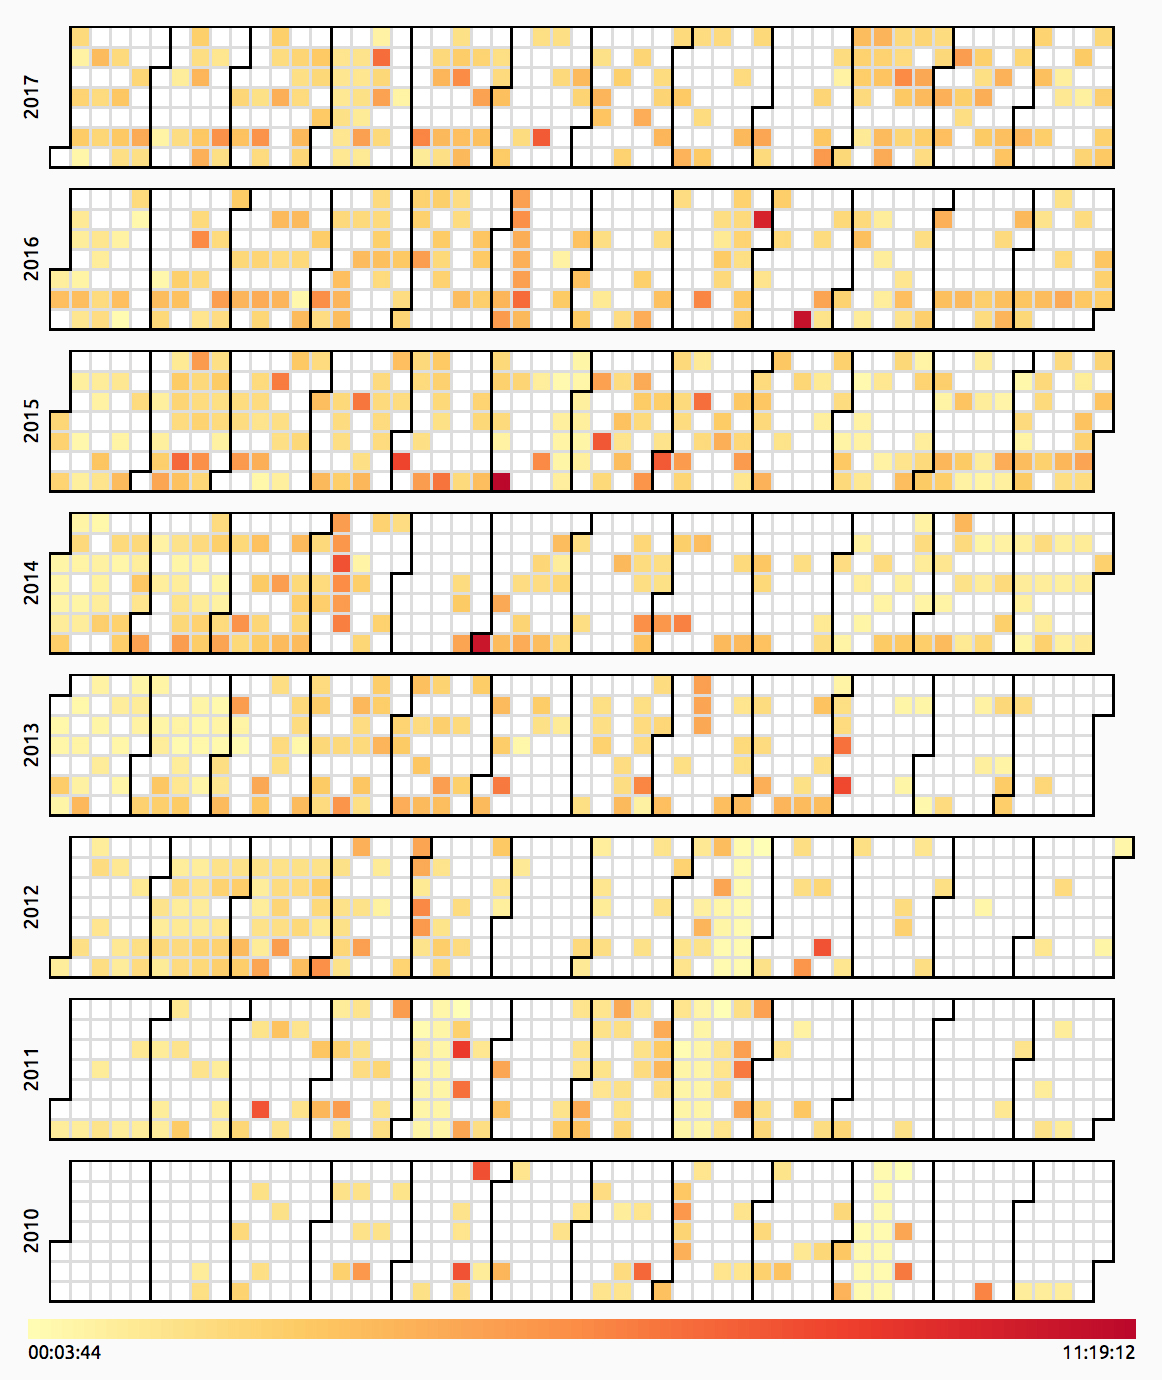
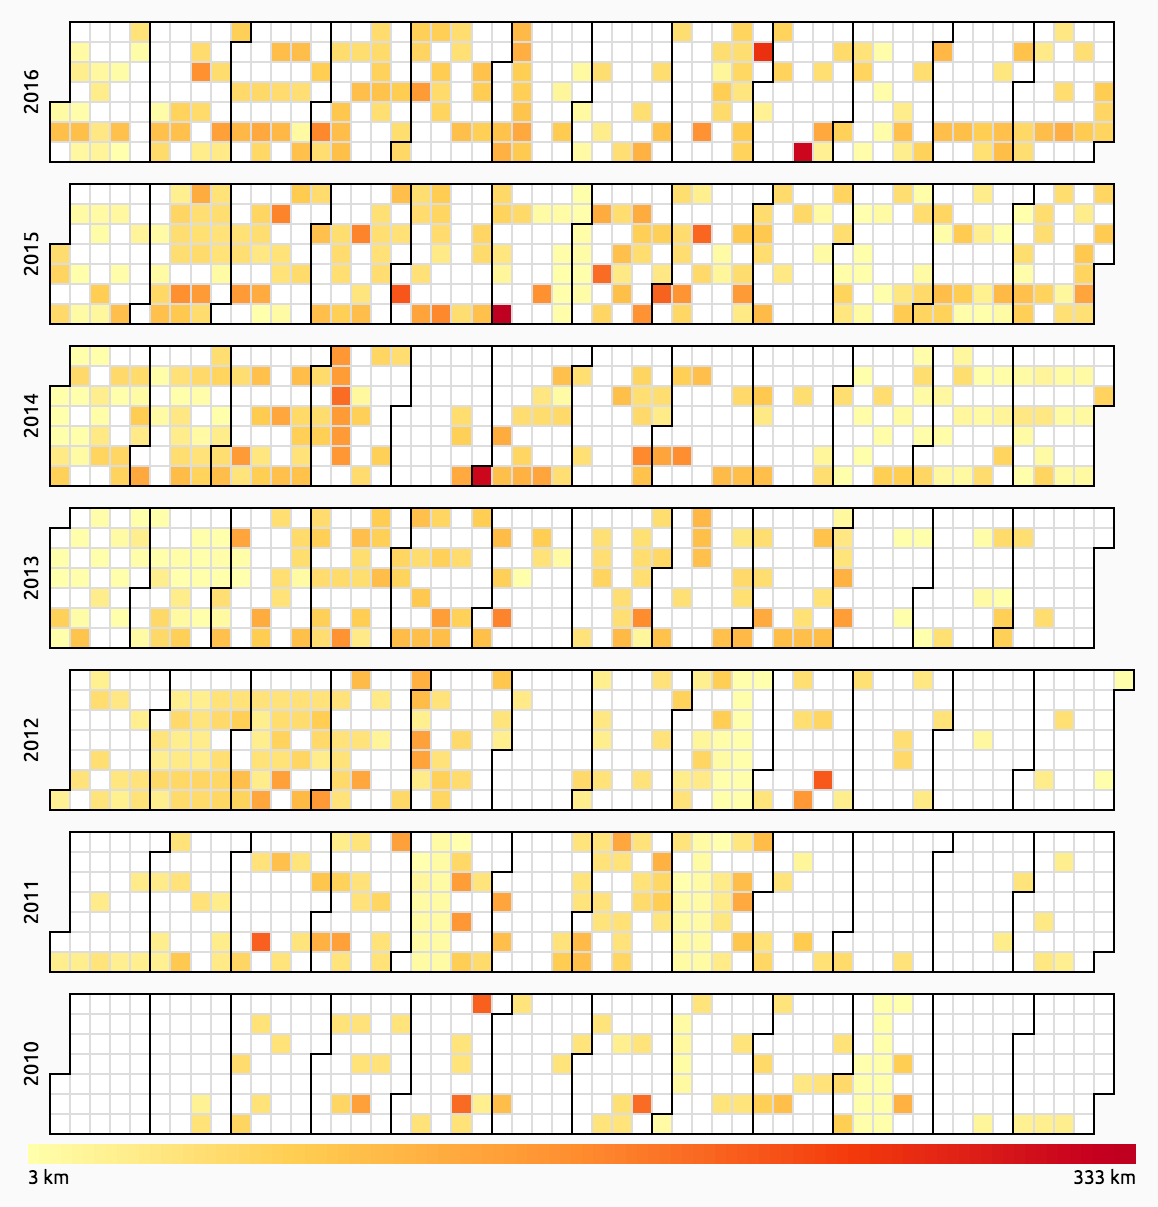
Finally, here is an overview of the evolution of the total activity time (also an all-time record with 465 hours), and its distribution across the calendar throughout the years.
The year (2017) in cycling (and other sports)

2017 was the third year in a row that I managed to bike more than 10000 kilometres, and mostly thanks to the combination of great weather and plenty of free time in October, I even made this my best cycling-year ever with 11330 km (but only with a tiny margin over 2015). October became my best month ever by a landslide, totalling in 1813 km, 65h 48m, and 9218 m of elevation gain.

I had no special plans for this year, but I still managed to collect plenty of long-lasting memories on the road. First of all, for the first time since 2013 (and likely for the last time), I took my racing bike to La Palma again to ride during and after my observing run, and since I gained some free time by having a drivers licence, I could put in some extra hours of quality high-altitude training while working at the observatory too. I had a slight insomnia problem afterwards, but still managed to pull off two epic rides around the island (and a few shorter ones). I also did a few beautiful (solo) rides in the Ardennes, which I hope to do more in 2018, because one of my favourite things in cycling is still discovering new, scenic, and quite roads. For the first time ever I finally had a positive experience in a race while participating in the 12 hours of Zolder with Squadra Tornado: I felt strong in my shifts, I contributed to the race, and I came away fully satisfied at the end.

The raw numbers for my cycling – without the daily commutes of course – in 2017:

Total distance: 11330 km
Total elevation gain: 86881 m
Total time: 408h 10m
Activity count: 155
Average speed: 27.8 km/h
Average heart rate: 151.9 bpm (max: 199 bpm, after 2.5 weeks of rest, uphill sprint)
Average cadence: 88 rpm (but I only have cadence measurement on my road bike)
Average temperature: 13.2°C (quite average, but with a very cold 0.6°C January)

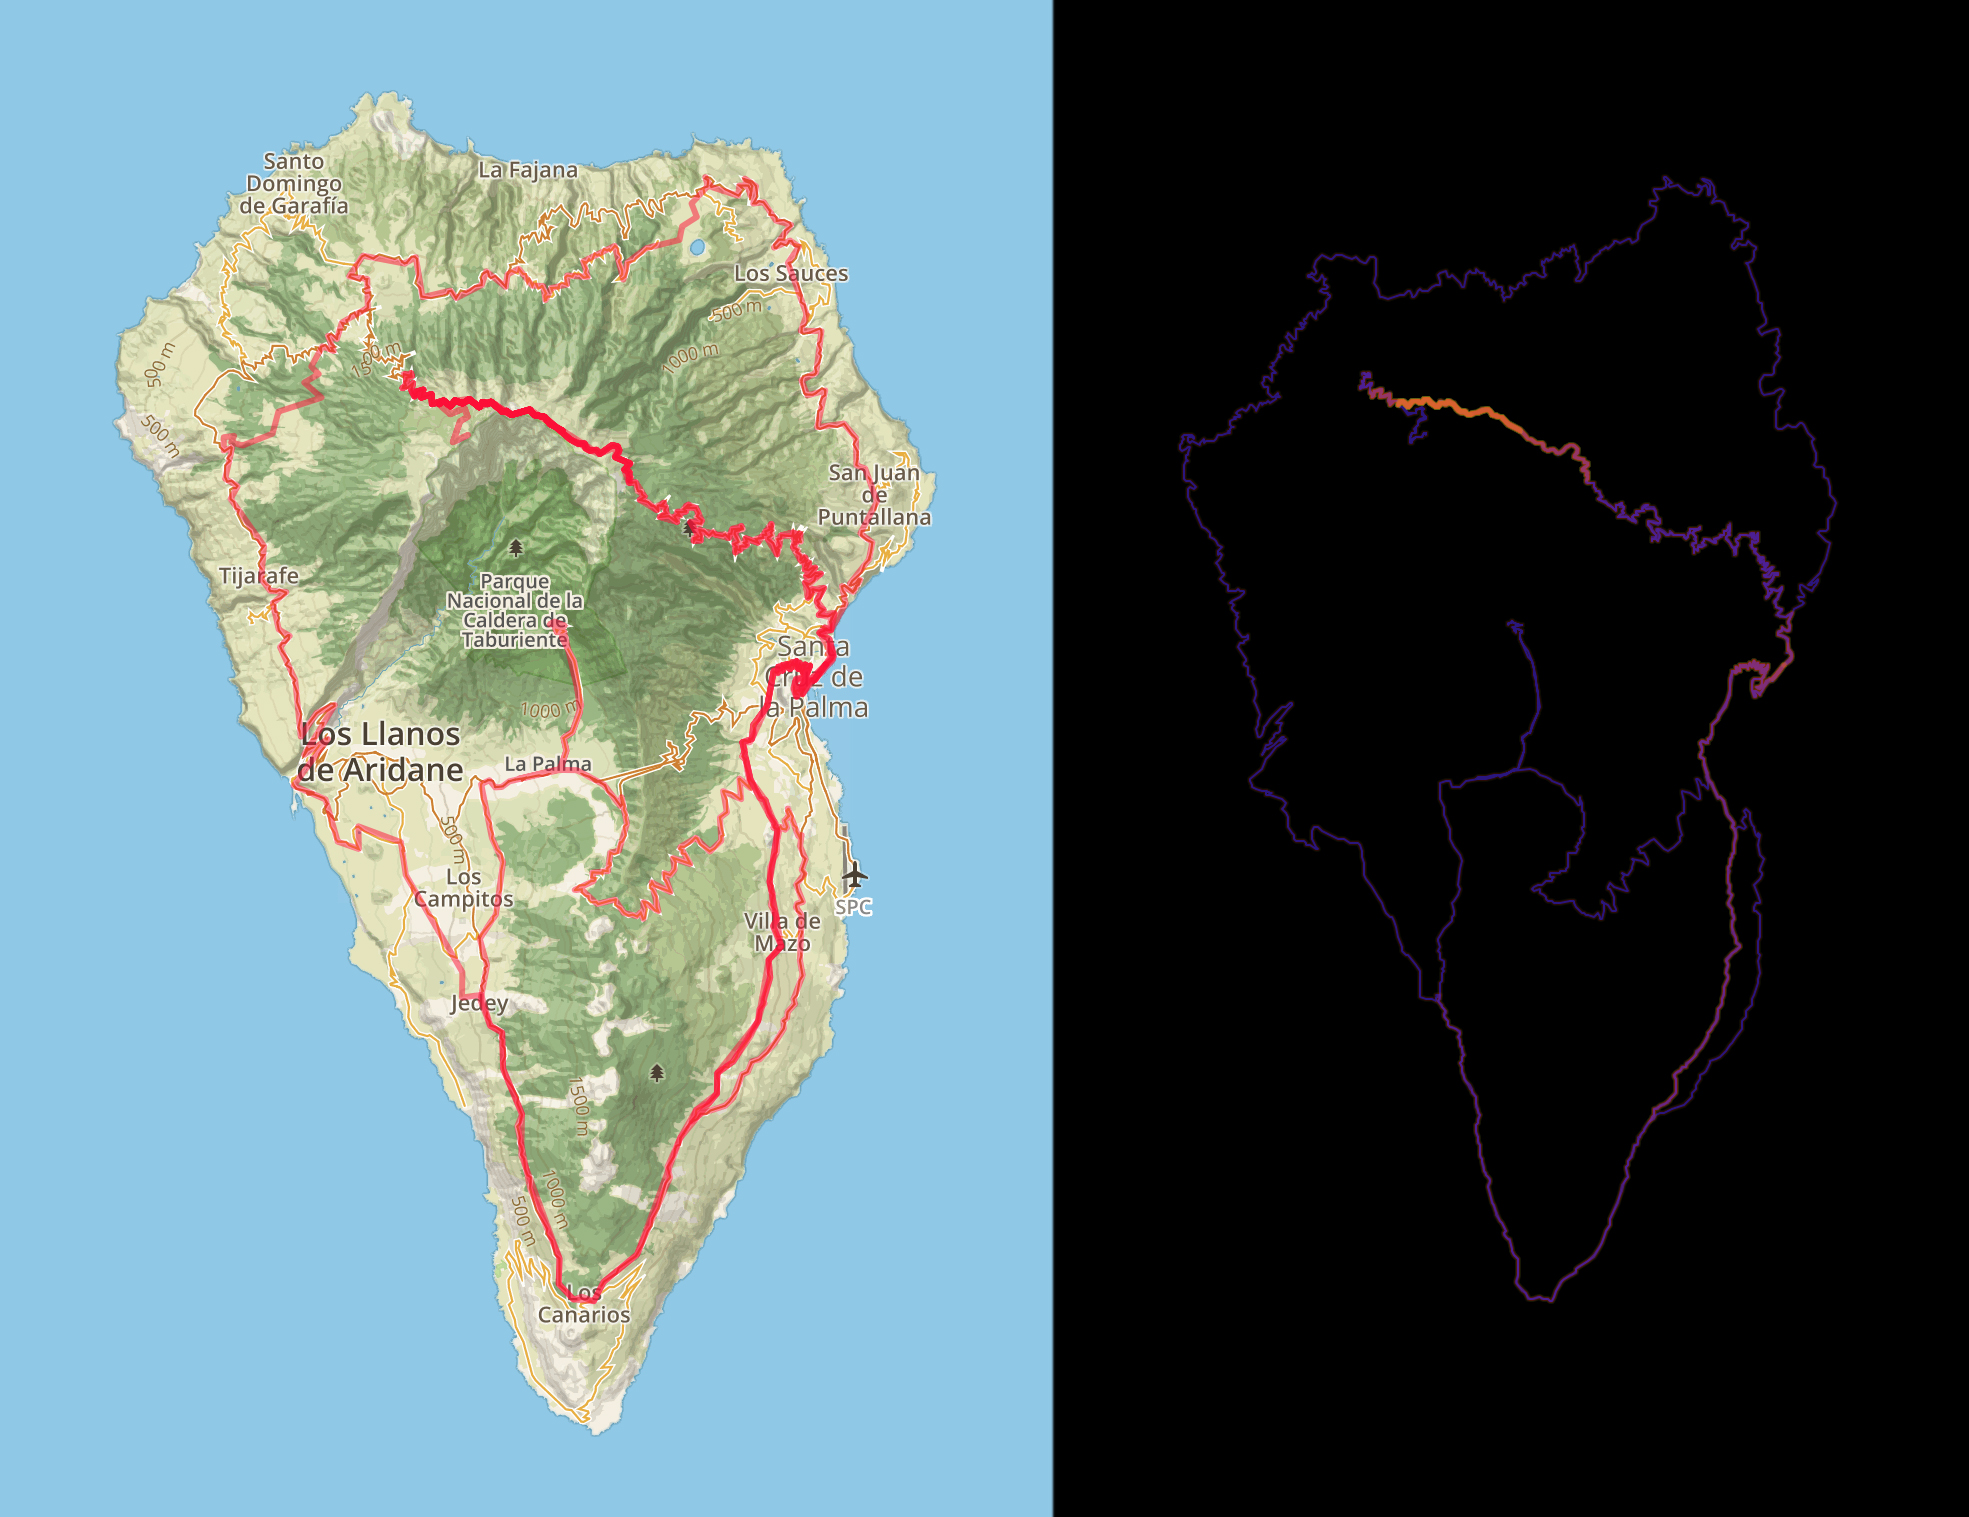
And now it is time to look at some maps and figures. Let’s start with the maps of cycling I have done this year. The first two maps show rides mostly in Belgium (with a zoom-in to the heat-map around Leuven), while the third is for La Palma.

20171231_CyclingHeatmap_1

20171231_CyclingHeatmap_2

20171231_CyclingHeatmap_3

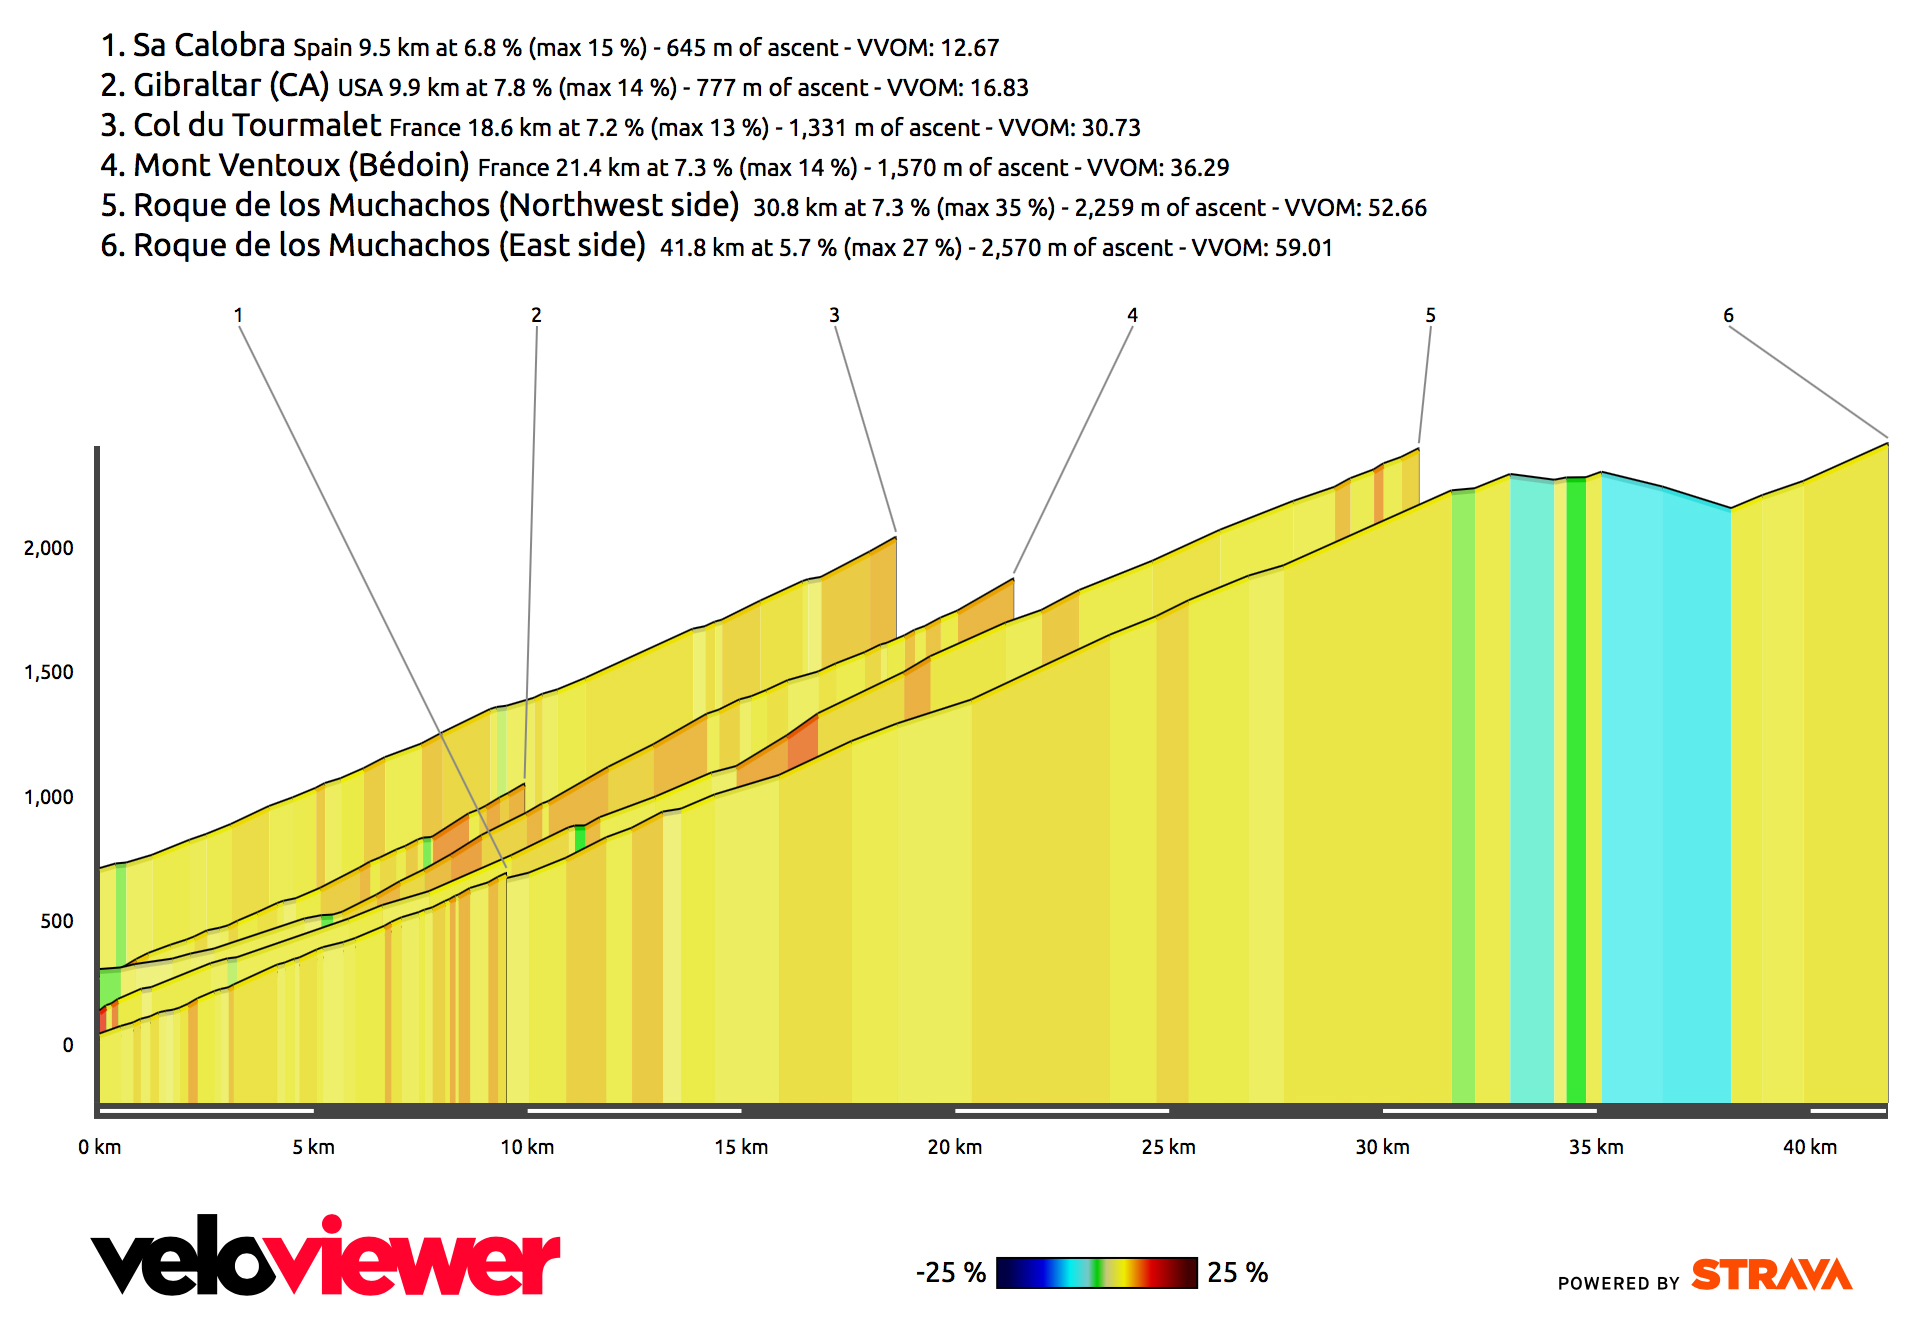
Just for the fun, here is a comparison of some of the bigger / more famous climbs I have done the past few years, with the last two being here on La Palma (although this year I only did the very last in this list).

20171231_Climbs

Out of the 155 activities, 110 were done solo, and 45 with at least another training partner, which means that I biked much more often alone this year. My most common partners in crime were Willem (23 times, for a total of 2.2 days) and his brother, Steven (19 times, 1.9 days). Here is a summary table of the rides by bike (note: the average speed for the track bike is incorrect).

20171231_Cyclingbybikes

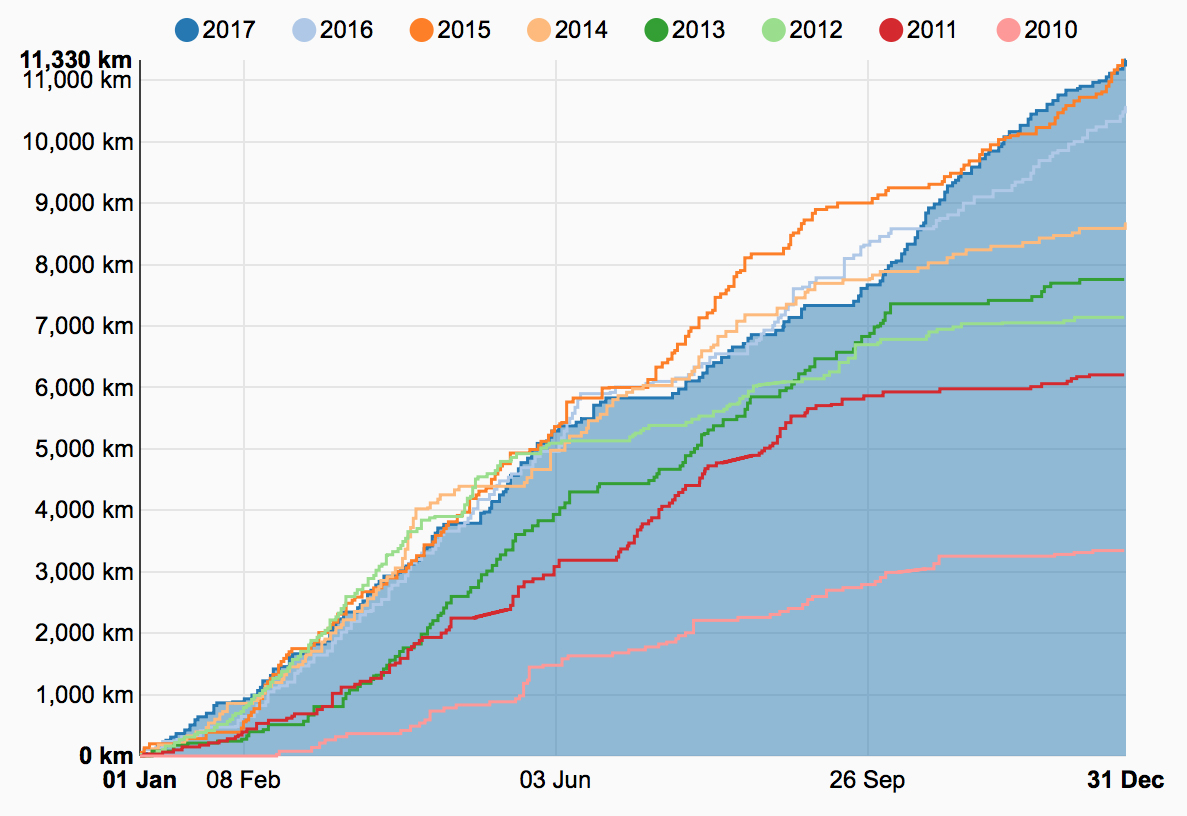
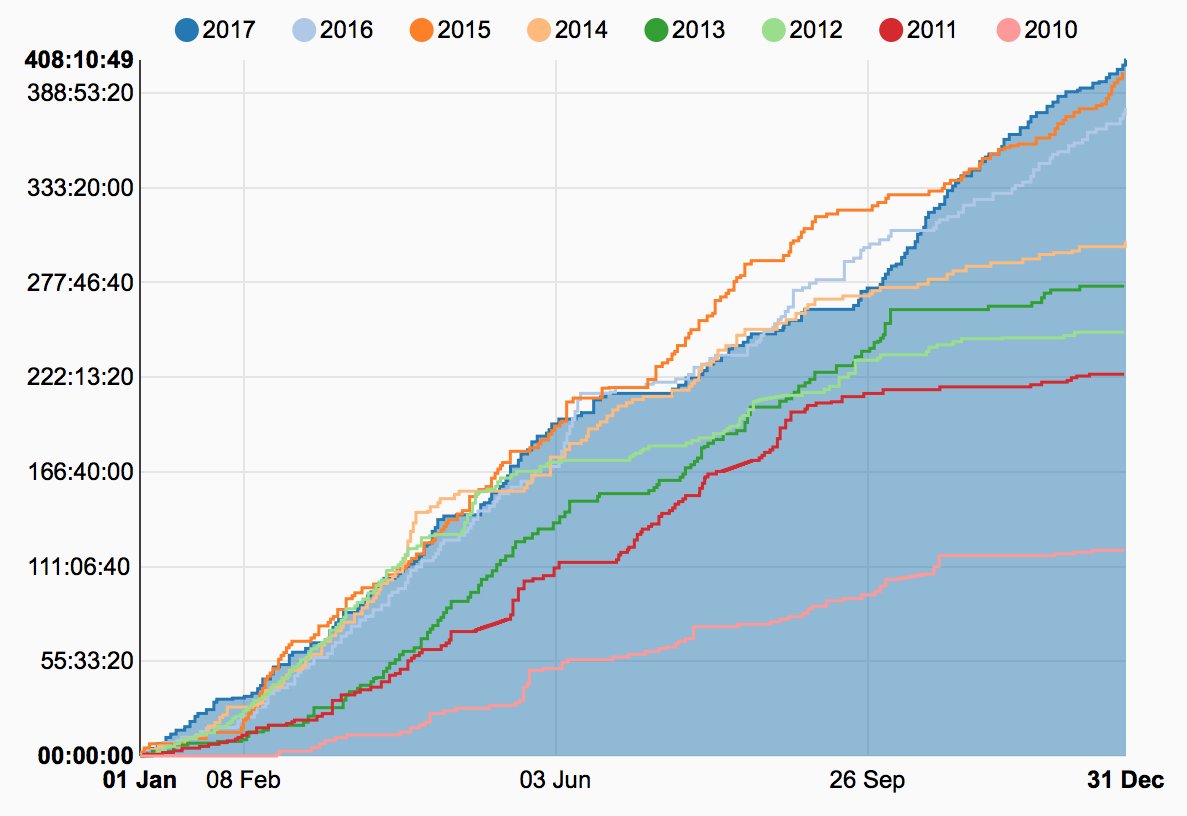
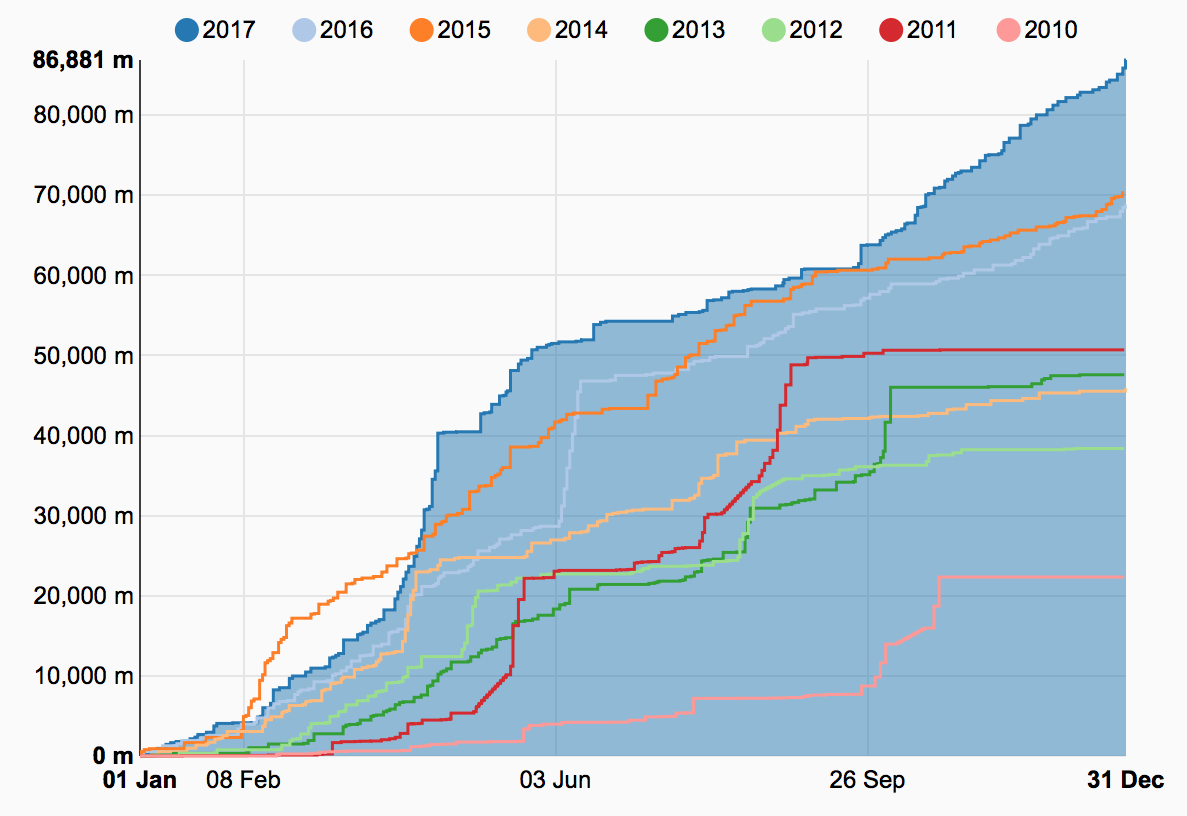
Here are the graphs showing the yearly evolution of my cycling distance, time, and elevation gain compared to the previous years.

20171231_Cycling_distance

20171231_Cycling_time

20171231_Cycling_elevationgain

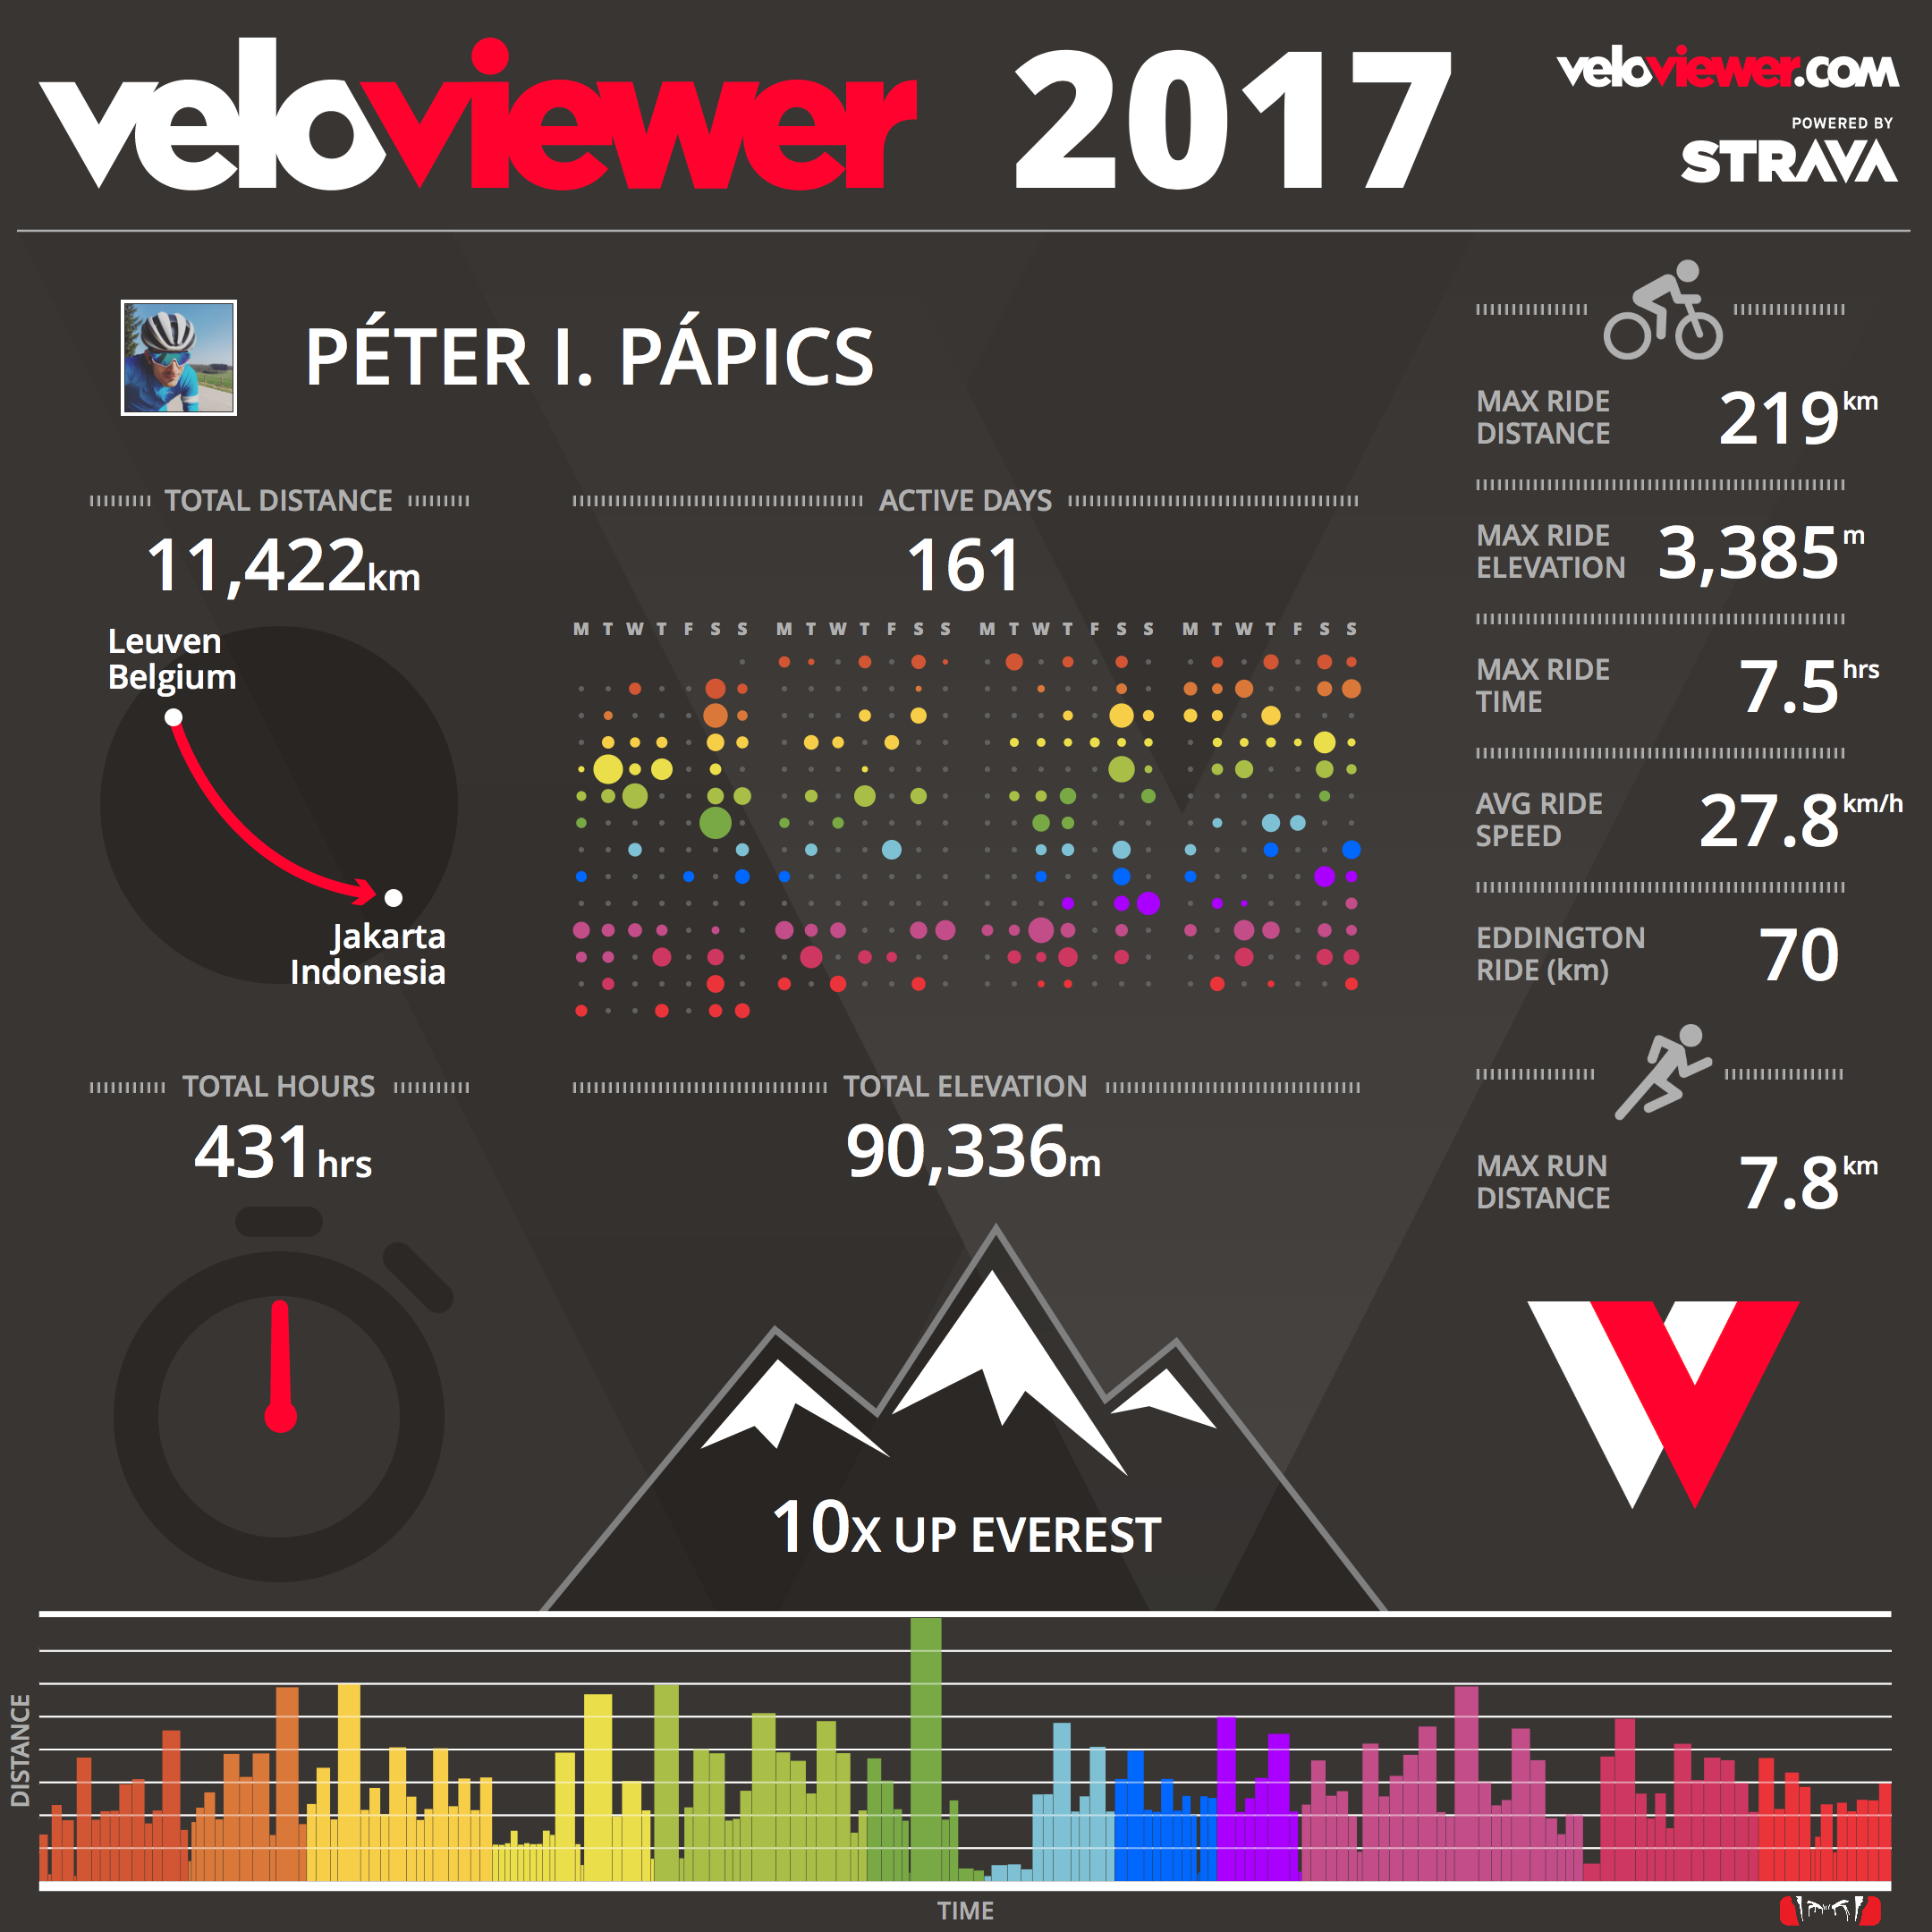
I also did a little bit of running (17.7 km) and hiking (74.8 km), adding up to a total activity time of 431 hours, which is not much worse than in 2015 (~450 hours, because I did much more running back then, besides almost the same amount of cycling). That is ~255000 extra calories burned!

20171231_VeloViewer2017

Finally, here is an overview of the evolution of the total activity time, and its distribution across the calendar throughout the years.
20171231_Activity_time

20171231_Activity_time_calendar

The year (2016) in cycling (and other sports)

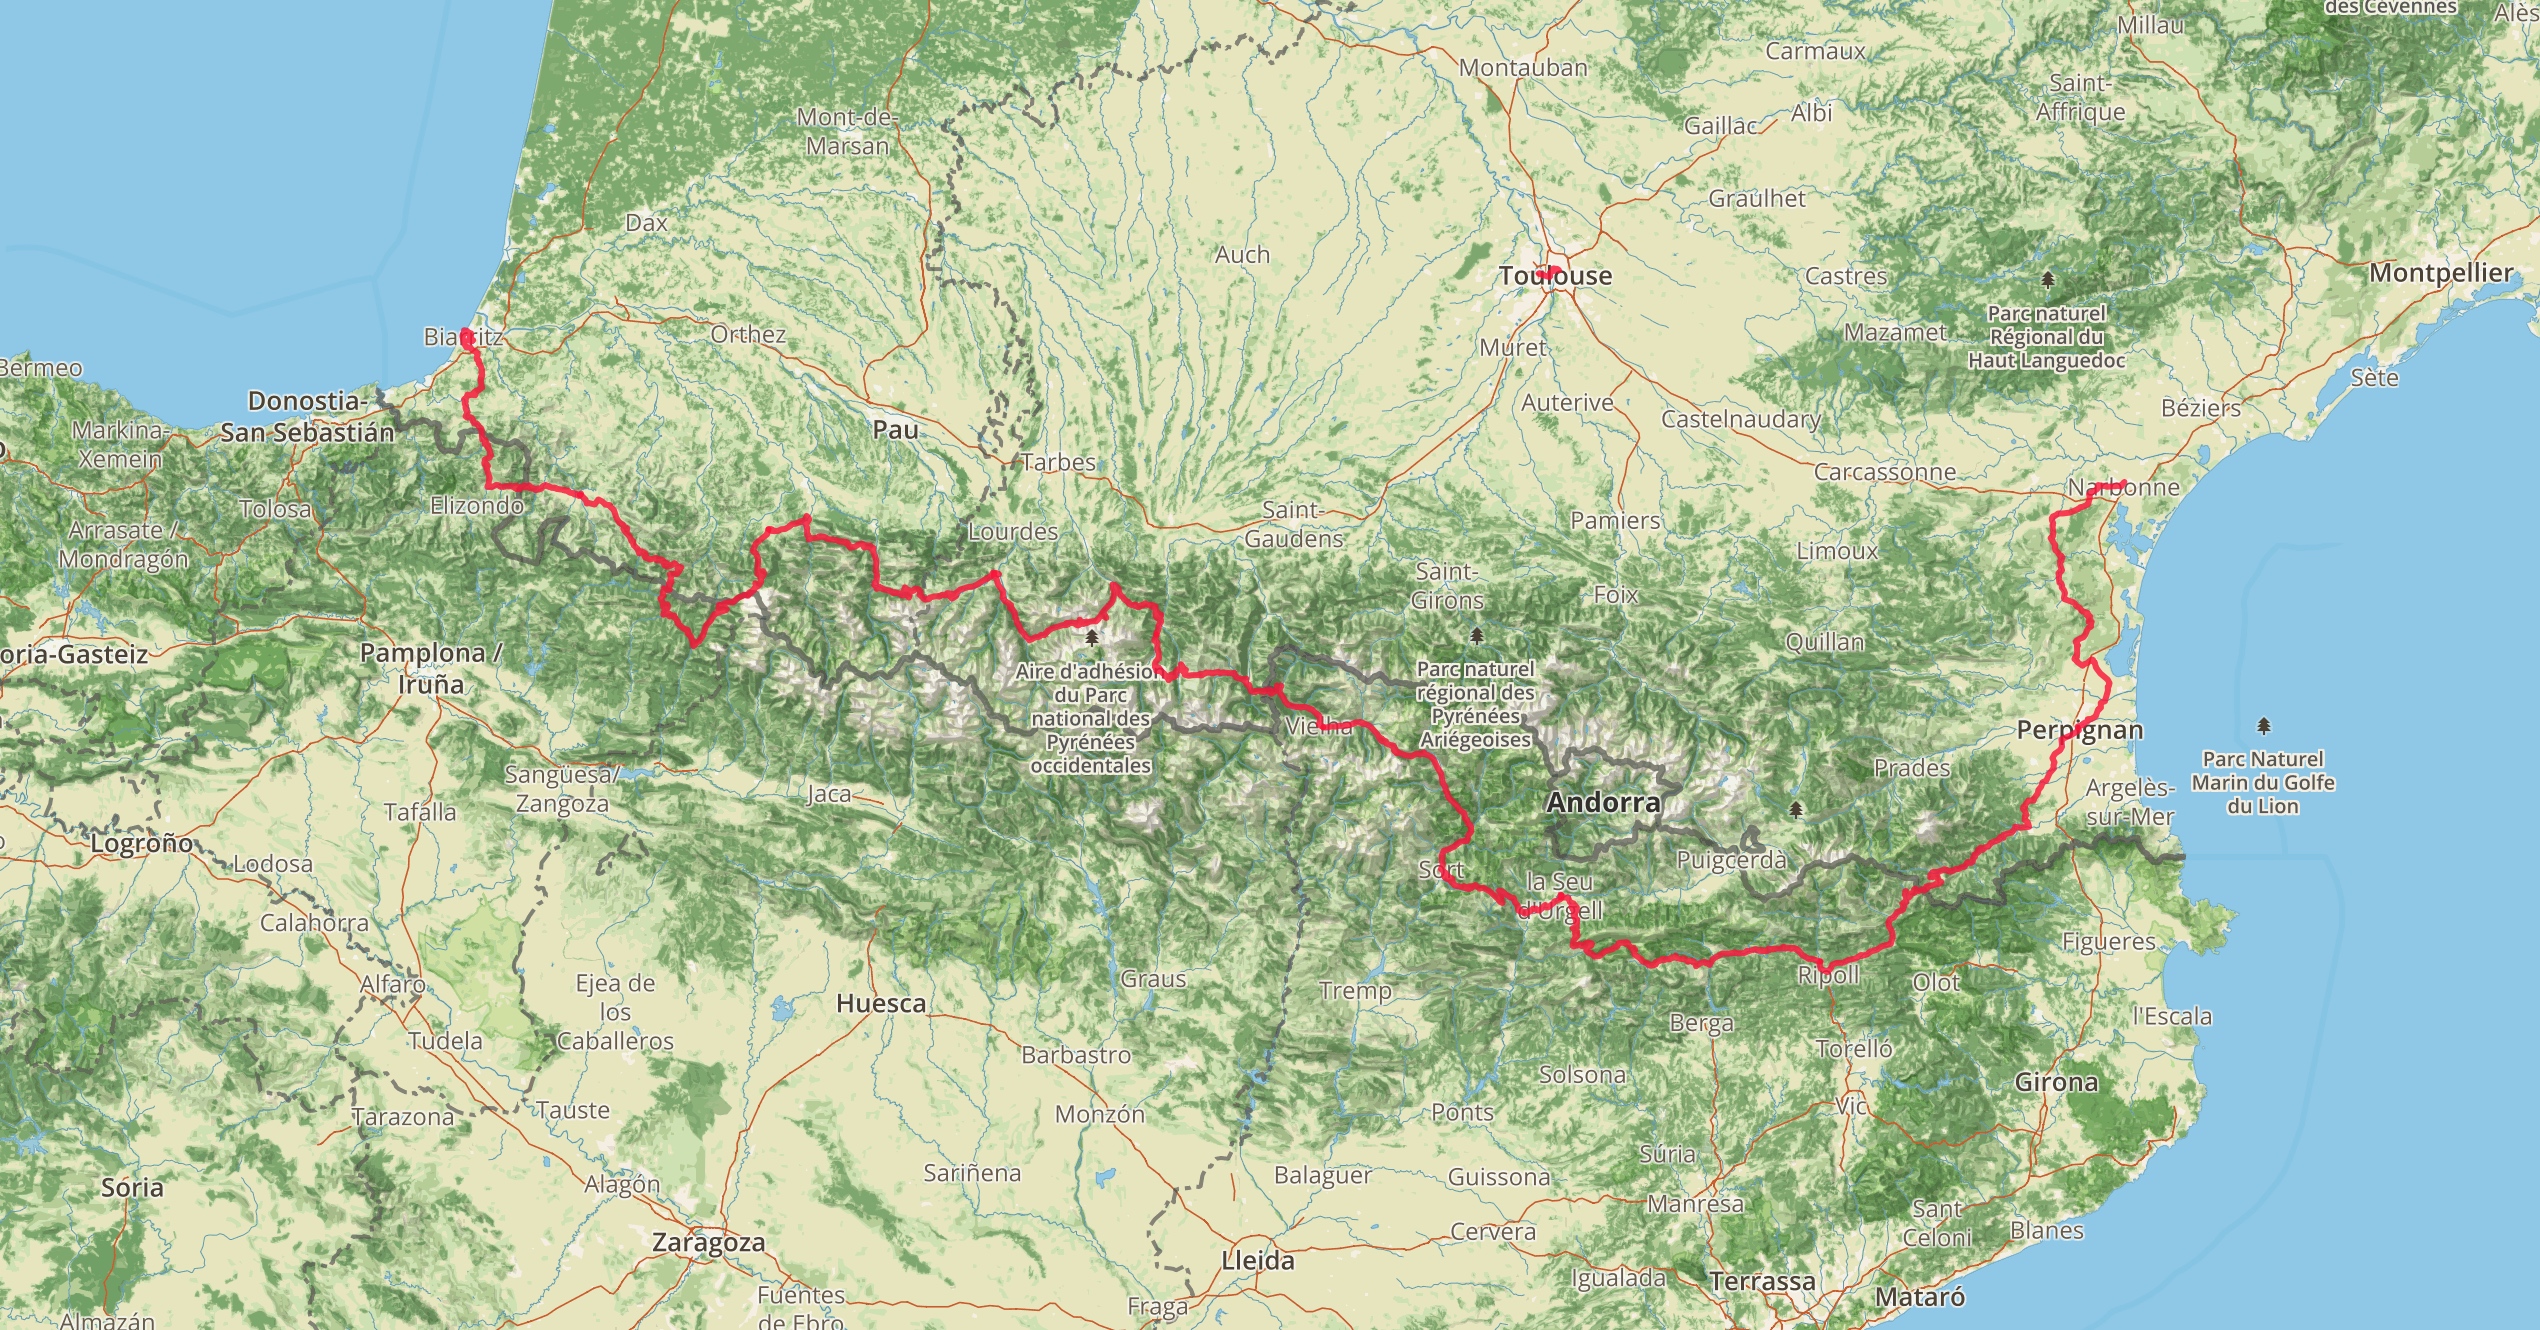
2016 was the first year when my total mileage did not turn out to be a new personal best, but it was still the second year in a row when I managed to cross the imaginary 10000 km line (quite easily), and – most importantly – I had a lot of fun on the bike. The high point of the year was undoubtedly the Trans Pyrenees ride with Willem (which almost single handedly made June 2016 my highest elevation gain month ever), there is really nothing that could come close to that. Honourable mention is given to the 263 km solo ride to the coast which is my longest solo ride to date. I also got a cyclocross bike.

The raw numbers for my cycling – without the daily commutes of course – in 2016:

Total distance: 10559 km
Total elevation gain: 68667 m
Total time: 379h 8m
Activity count: 133
Average speed: 27.9 km/h
Average heart rate: 152.4 bpm (max: 194 bpm, but sometimes I did not wear my HR strap)
Average cadence: 87 rpm (but I only have cadence measurement on my road bike)
Average temperature: 11.9°C (~2.5°C colder than the past 3 years, with a 1.8°C December…)

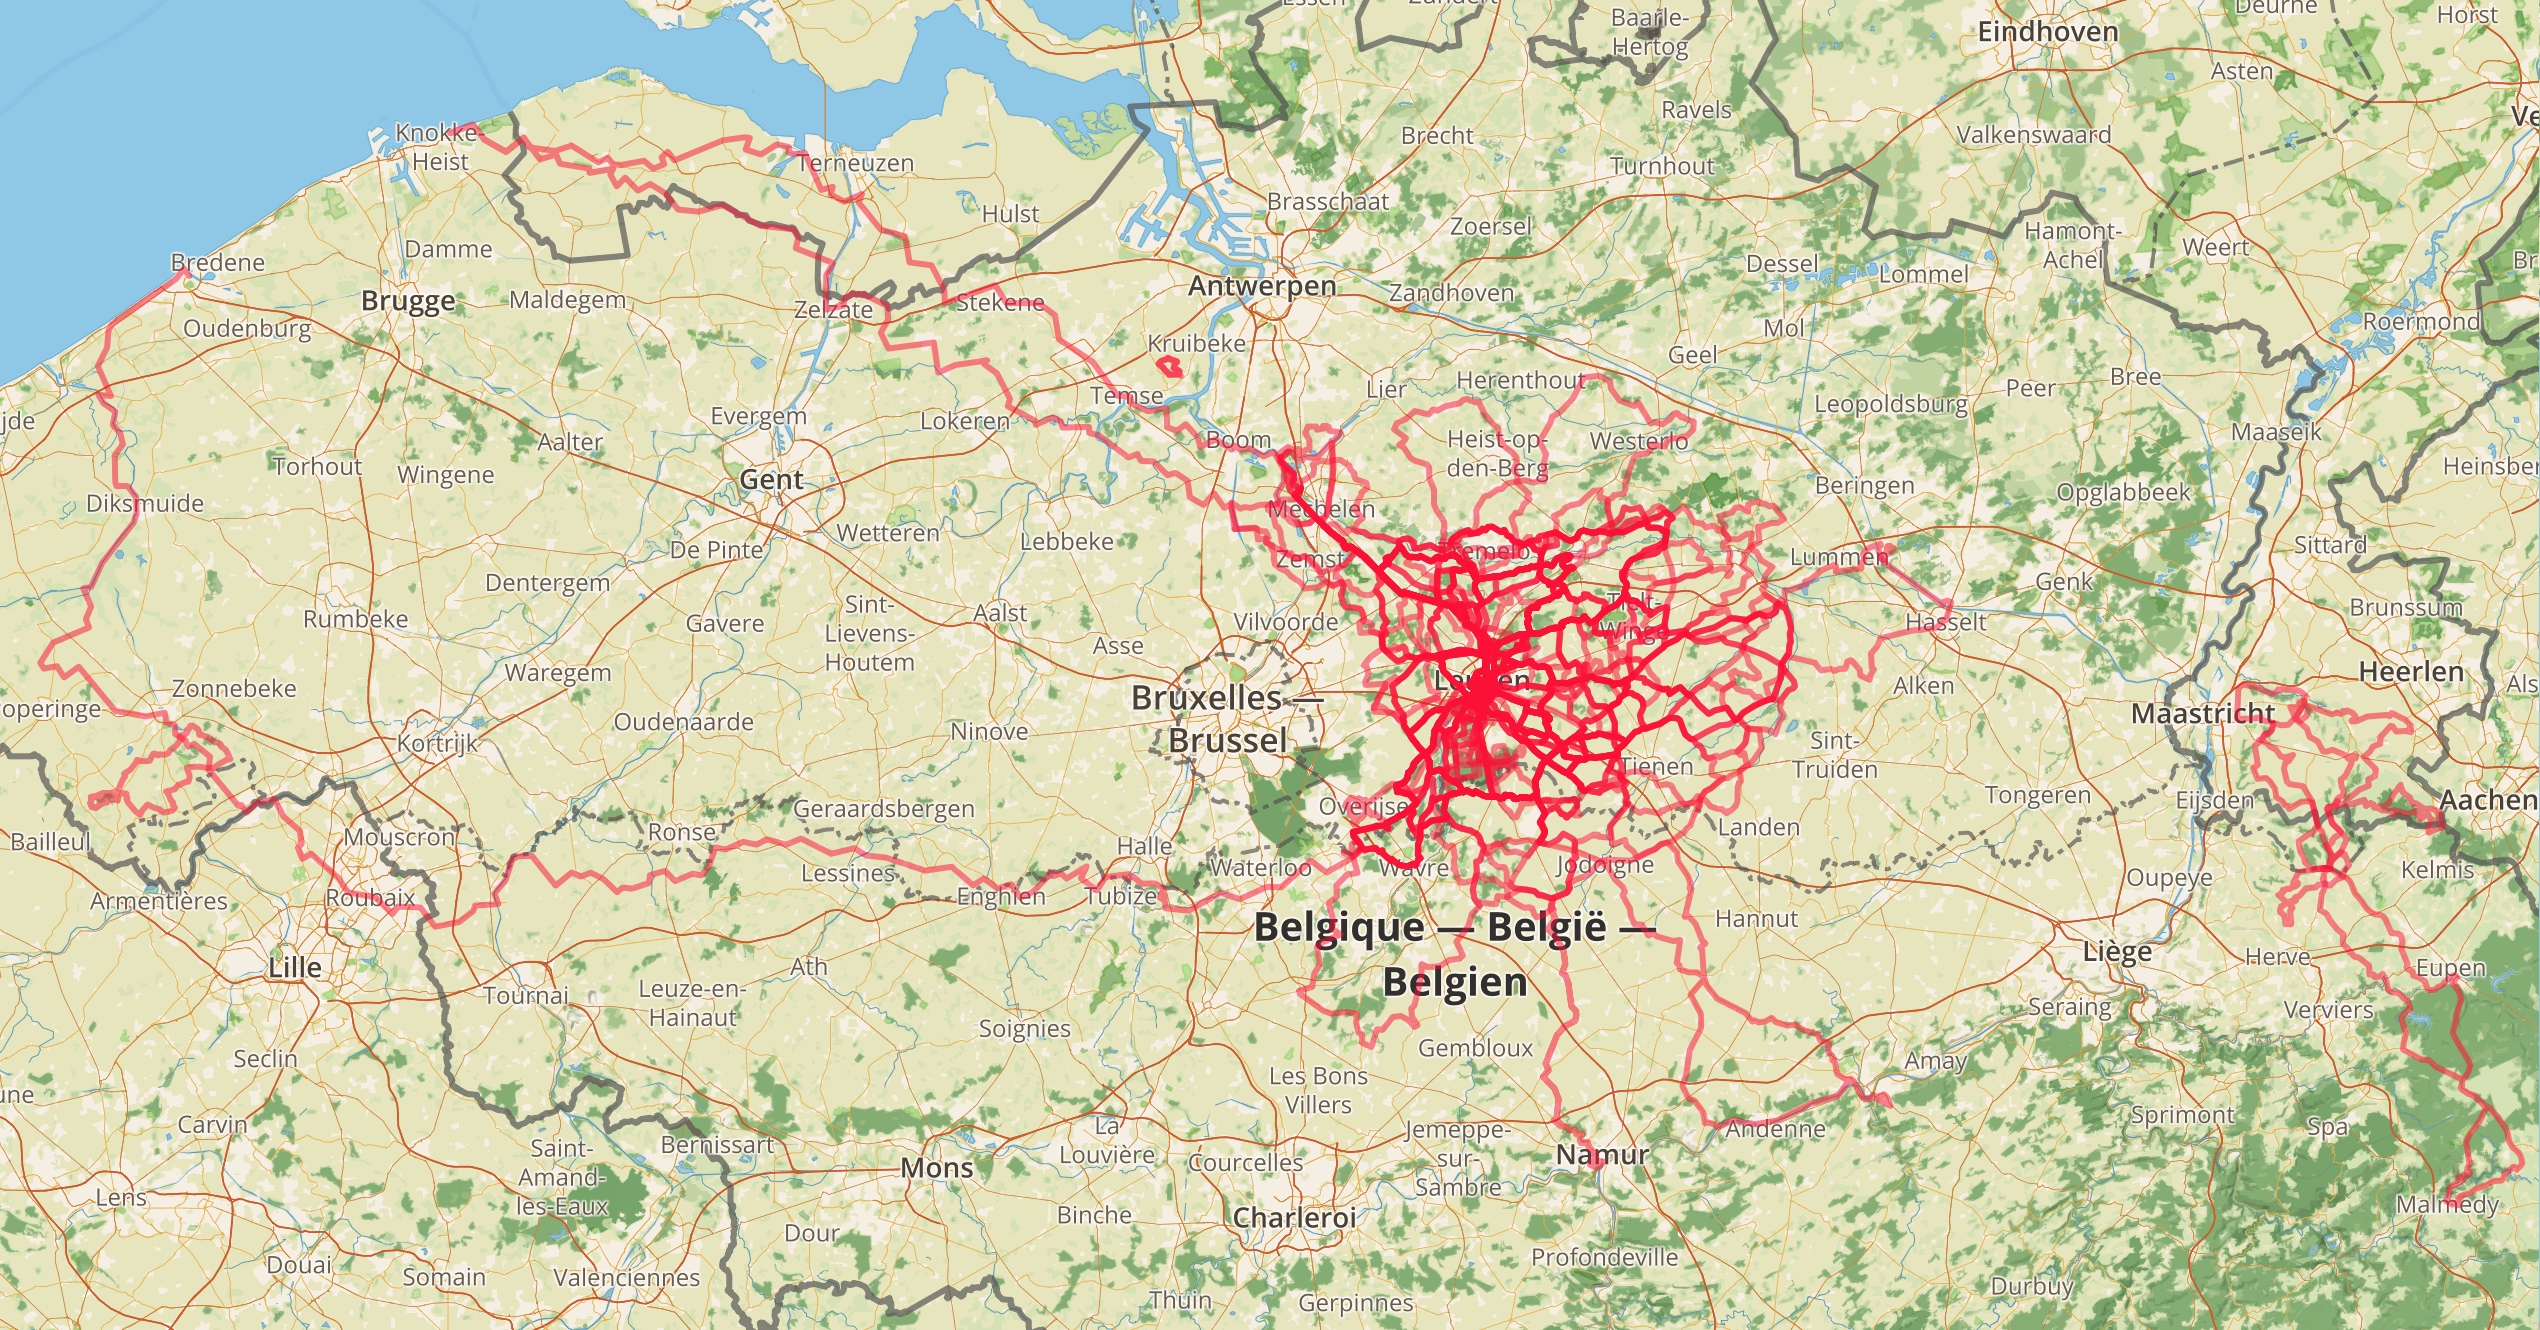
And now it is time to look at some maps and figures. Let’s start with the maps of cycling I have done this year.

20161231_BelgiumMap

20161231_PyreneesMap

Out of the 133 activities, 72 rides were done solo, while a large percentage of the rest were predominantly Squadra Tornado group rides. In this sense, this was my most social year on the bike so far. My most common partner in crime was unsurprisingly Willem, with whom I rode together 47 times (a total of 146 hours in duration). Here is a summary table of the rides by bike.

20161231_Bikestats

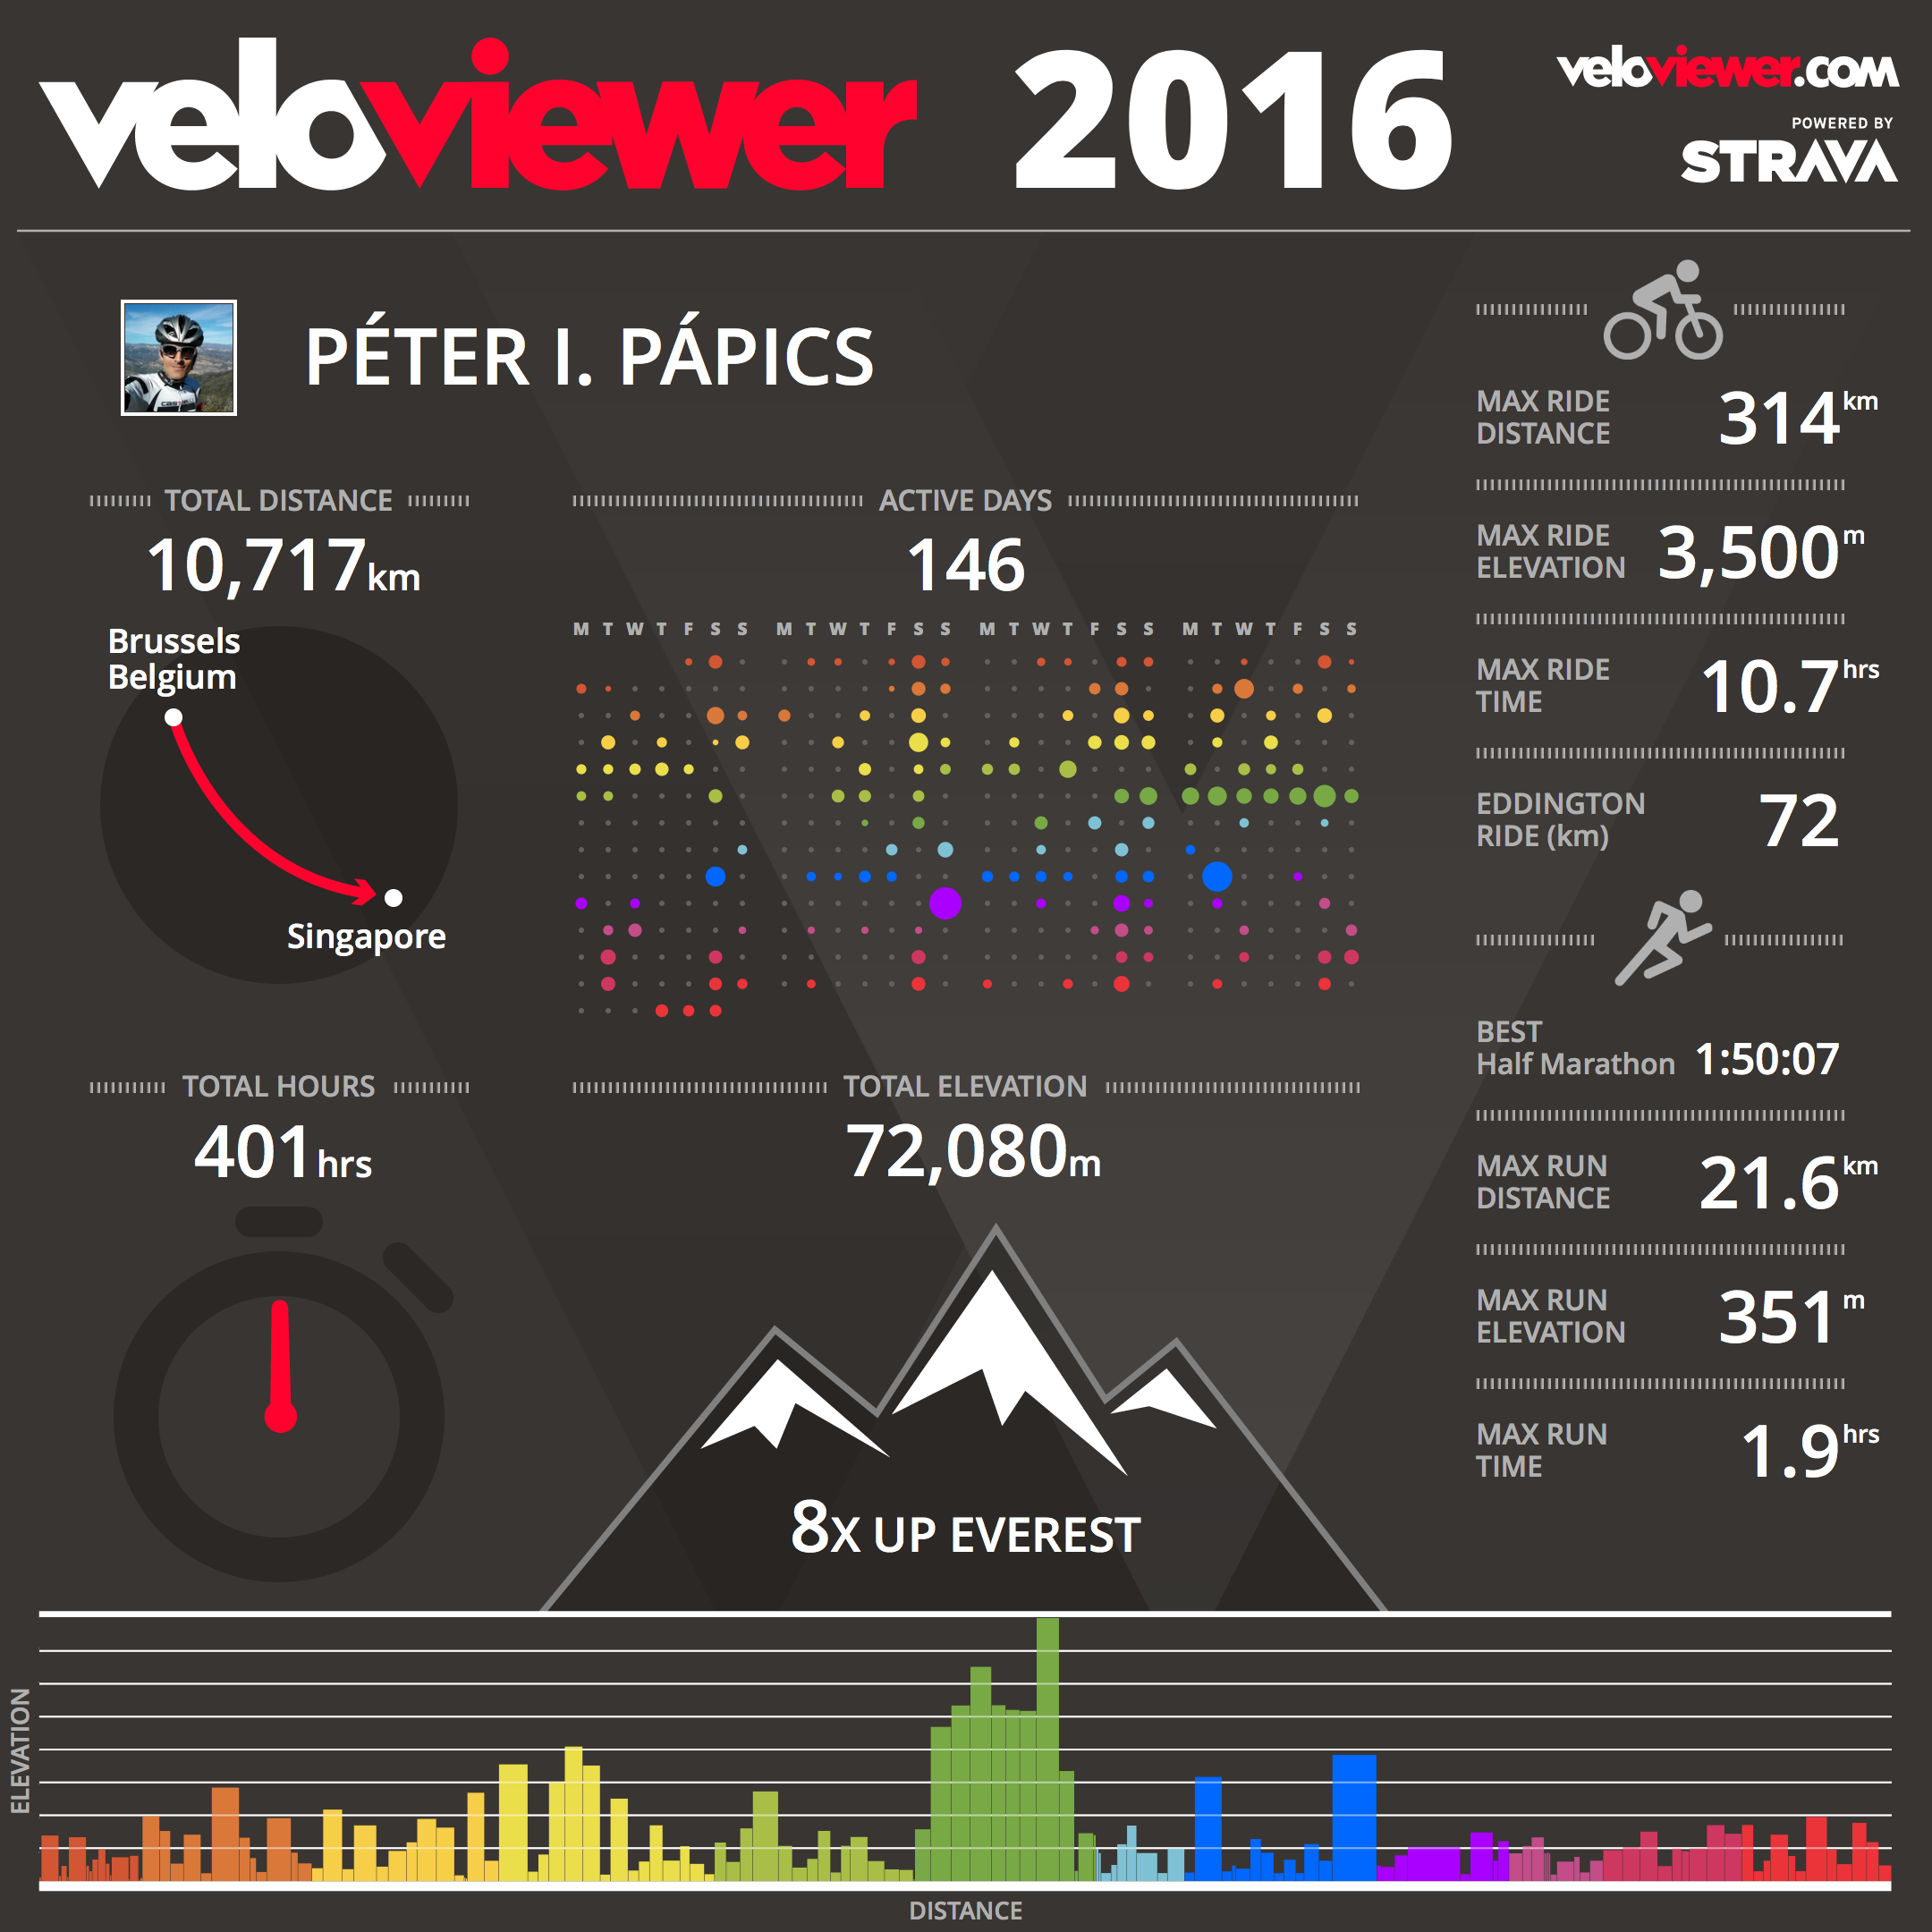
I also did some running (120 km) and hiking (38 km), adding up to a total activity time of 401 hours, which is halfway between my numbers from the previous two years. I would be happy with the same in 2017 for sure.
20161231_VeloViewer2016

At last but not least, here is an overview of my yearly progress (in kilometres, including running and hiking too) throughout the previous seasons.

20161231_VeloViewer_Distance

20161231_VeloViewer_DistanceCalendar

The year (2015) in cycling (and other sports)

2015 was quite an amazing year on the bike. I have never ridden so much, so far, so long, and with so much elevation gain before. The main themes of the year were definitely epic (solo) rides and new roads. I have ridden also much more alone, because this year I did not join WTCOOL anymore. This is likely to change again next year as I have recently joined Squadra Tornado, a more racing oriented team. The past two months I have already ridden with them on Saturdays. Besides these trainings, I did most of my rides solo in this year’s interbellum, or with Willem, who joined me quite a few times.

Memorable events from 2015 (before we jump into the raw numbers and figures):

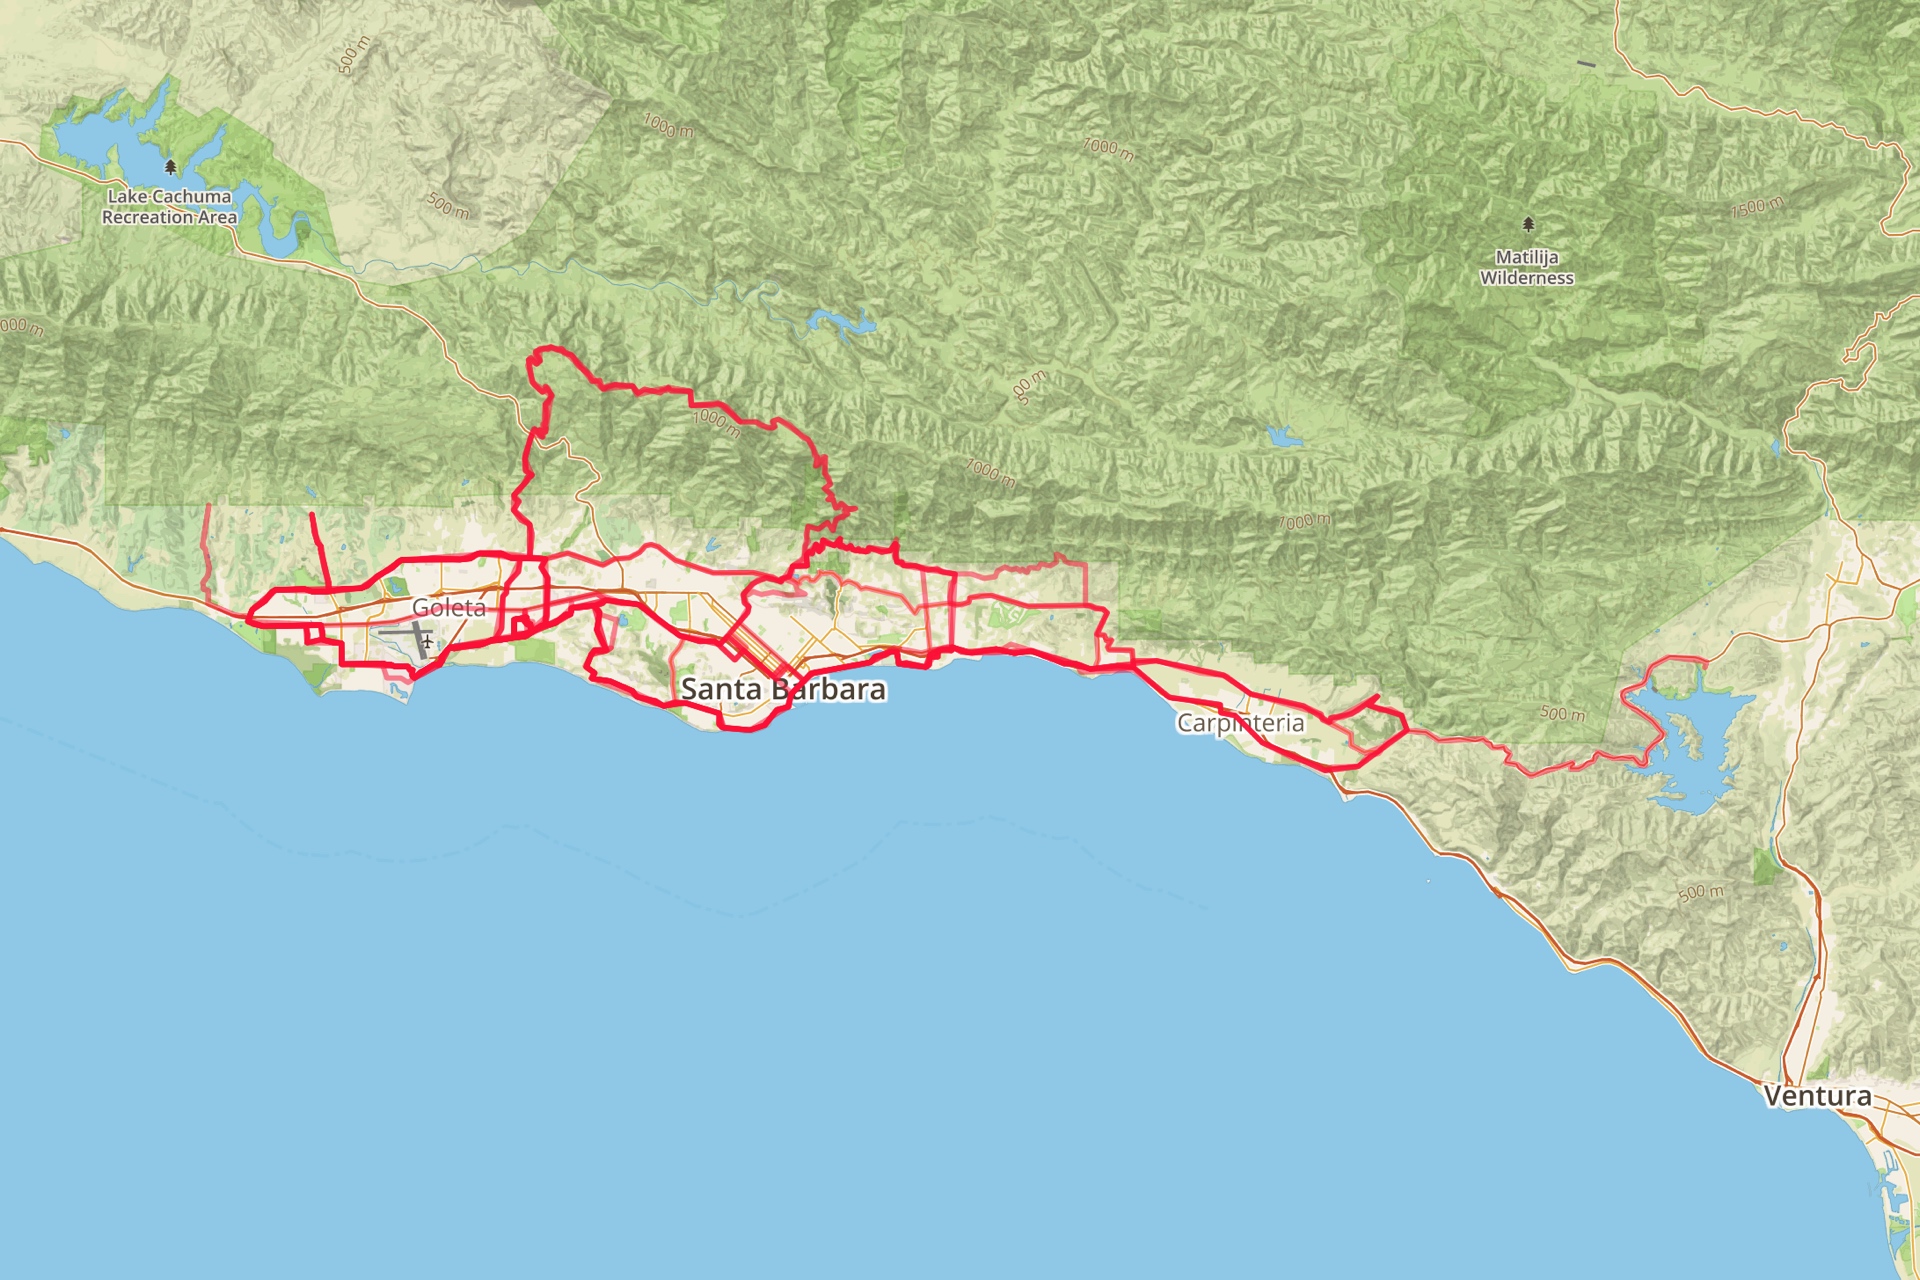
  1. I spent February working and cycling in Santa Barbara (Southern California, USA), and thanks to the warm and dry weather (similar to an average May/June in Belgium, but without the rain), in just 3 weeks I biked enough to make this month my 2nd best month ever on the bike (and my best month in sports if you add the three 10k runs I did before and after all the cycling).
  2. I bought a new road bike, a Canyon Ultimate CF SL 9.0 Di2. Since the beginning of March, I have ridden almost 9500 km with it, and I am extremely happy with the purchase. It’s a beautiful machine.
  3. I started to use a power meter on the bike, and although I would not go for the same Garmin Vector system again (because now there are better options in this fast evolving and still very young sector), I am happy to learn from all the data I record with it. (So now I know that I sprint quite good but my functional threshold power kinda sucks.)
  4. I did many epic rides, some alone, some with a few other guys, and one in a larger group to the coast and back just like last year. This Heverlee – Knokke – Heverlee ride was my longest ride ever with 333 km thanks to the small extra I did at the end (which made some people question my sanity). Other memorable epic days mostly on new roads include: a solo century around Santa Barbara with summer temperatures, an epic climb, and 5 bottles of water; a 223 km ride to Geraardsbergen in a company of six; 173 km of climbing through the Province of Namur with Willem over 2500 metres of elevation gain, a masterpiece of route-planning; Catching the Tour de France in Namur with Willem, not an extreme long ride, but very nice route, and just a day after coming home from observing on La Palma, so I totally died by the end; a 202 km solo over the Mur of Huy and the Citadel of Namur (a ride of total mental madness); and nicely fitting into the list of epic rides to epic climbs, a 210 km solo to Valkenburg (Cauberg) and back. In total I had 5 rides over 200 km, and 11 rides that qualify as at least a century (100+ miles).
  5. I have finished one very special challenge on Strava, the Rapha Festive 500, that challenges participants to ride 500 km on the eight days between Christmas Eve and New Year’s Eve. Normally we go to Hungary for Christmas, but this year we stayed in Belgium, so I thought I would give it a try. Although I got soaked twice, and almost blown off the road by the crazy wind a few times, I managed to complete the challenge with 6 rides in 7 days. The fact that the average temperature was more typical for April than December helped a lot of course ;) Thanks to the weather conditions and this challenge, I closed off December with 1095 km on the bike. That’s insane for a winter month (in Belgium, not in Southern California), and it is more than I biked in the previous 5 Decembers, combined.

And then the raw numbers for my cycling – without the daily commutes of course – in 2015:

Total distance: 11326 km
Total elevation gain: 70307 m
Total time: 400h 17m
Activity count: 140
Average speed: 28.3 km/h
Average heart rate: 152.6 bpm (max: 193 bpm)
Average cadence: 91 rpm

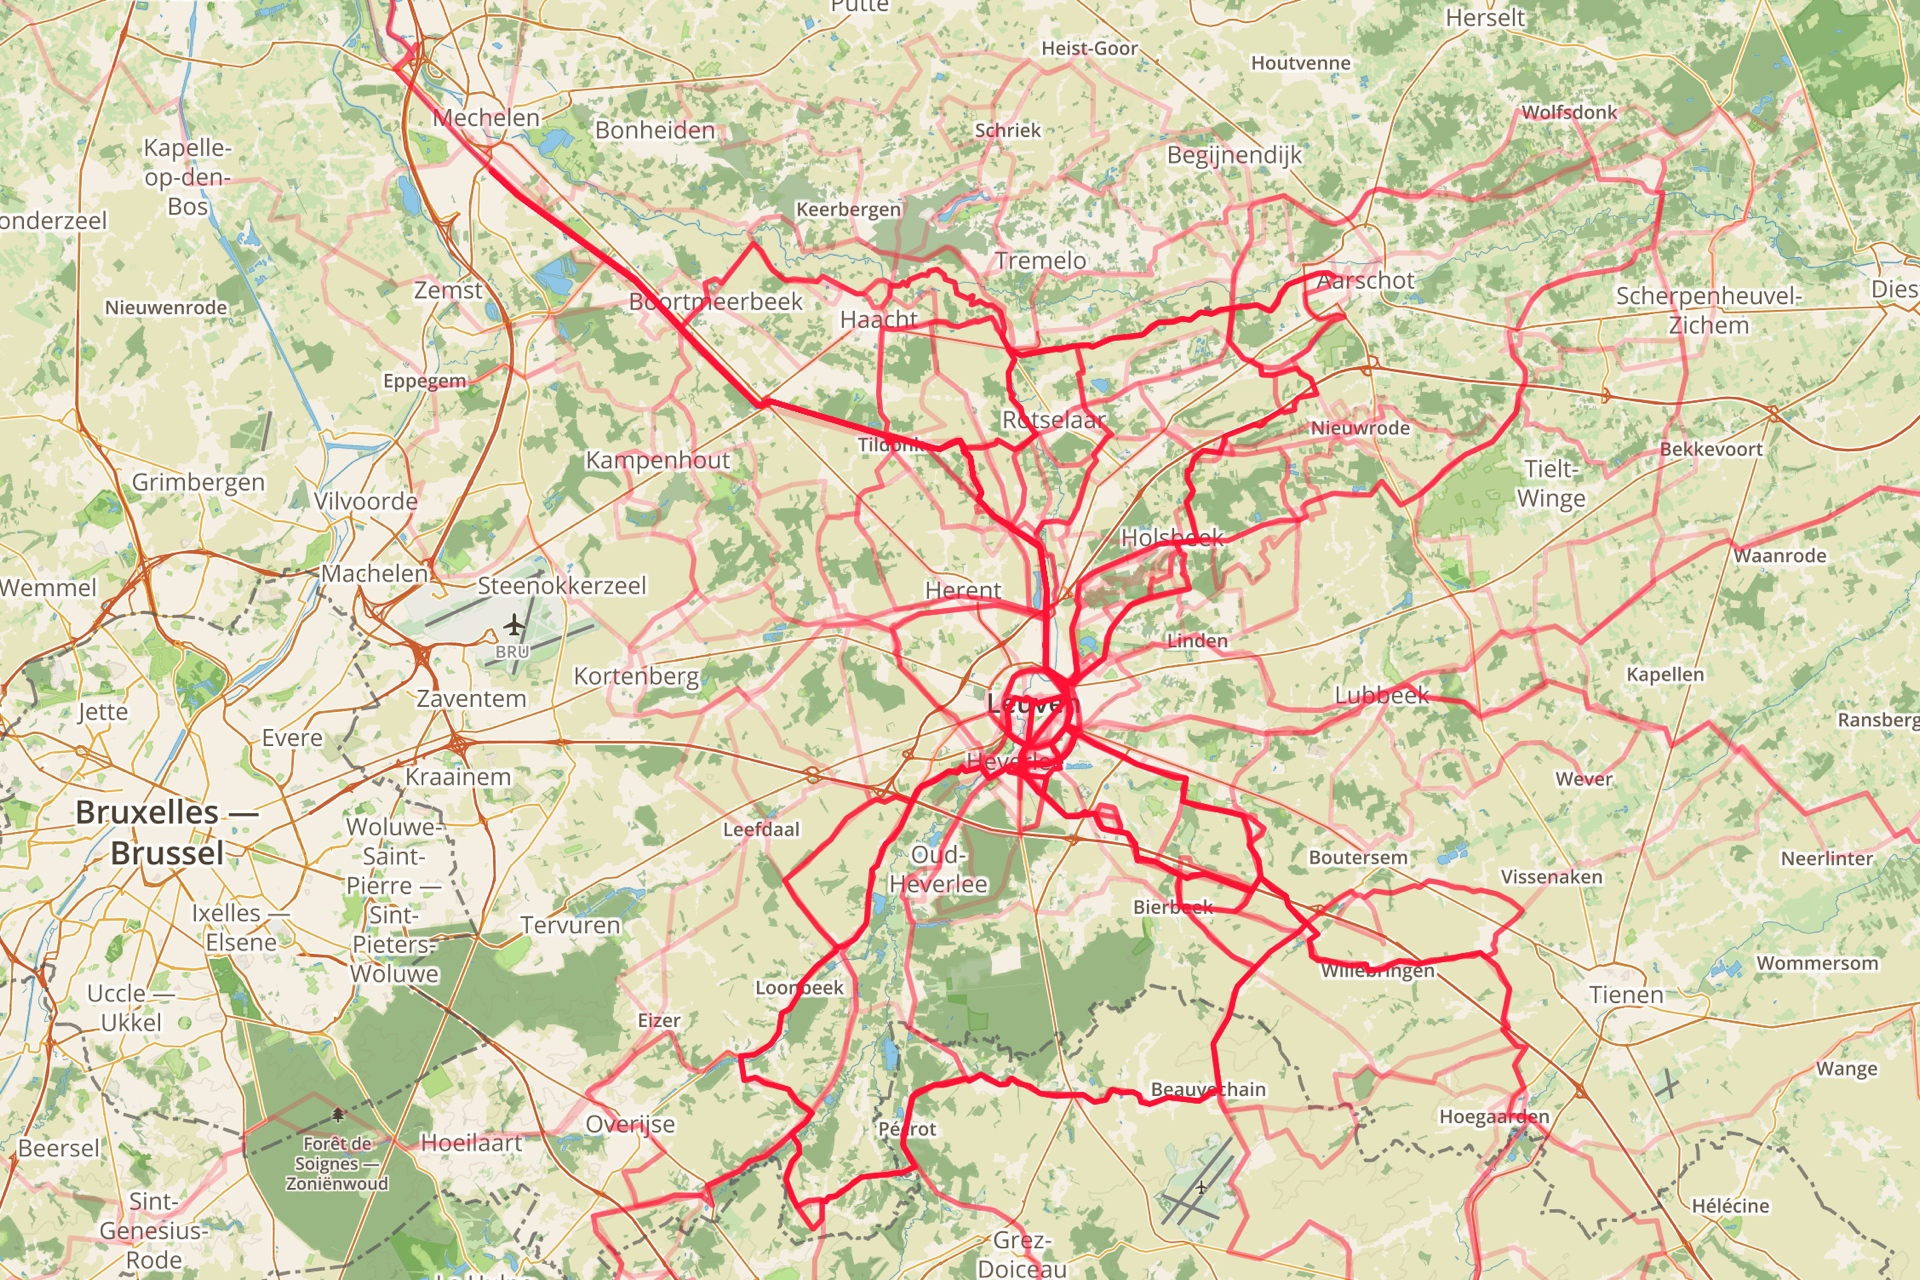
And here are the figures, coming up first the maps of cycling in Belgium, with a zoom in to the area around Leuven to show my most taken loops more clearly, and also a map of the biking I did around Santa Barbara.

20151231_BelgiumMap

20151231_BelgiumMapZoom

20151231_SantaBarbaraMap

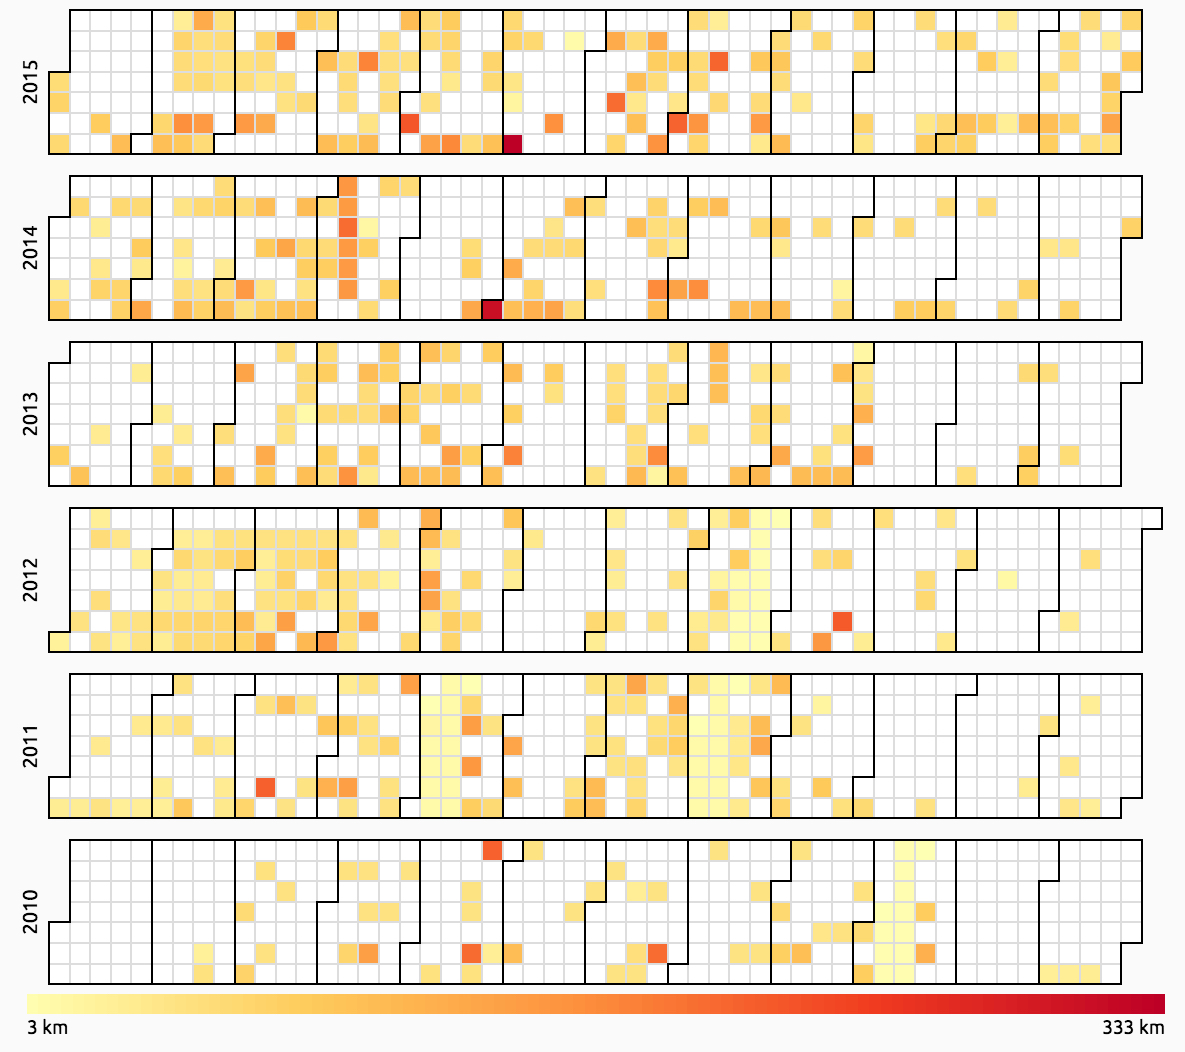
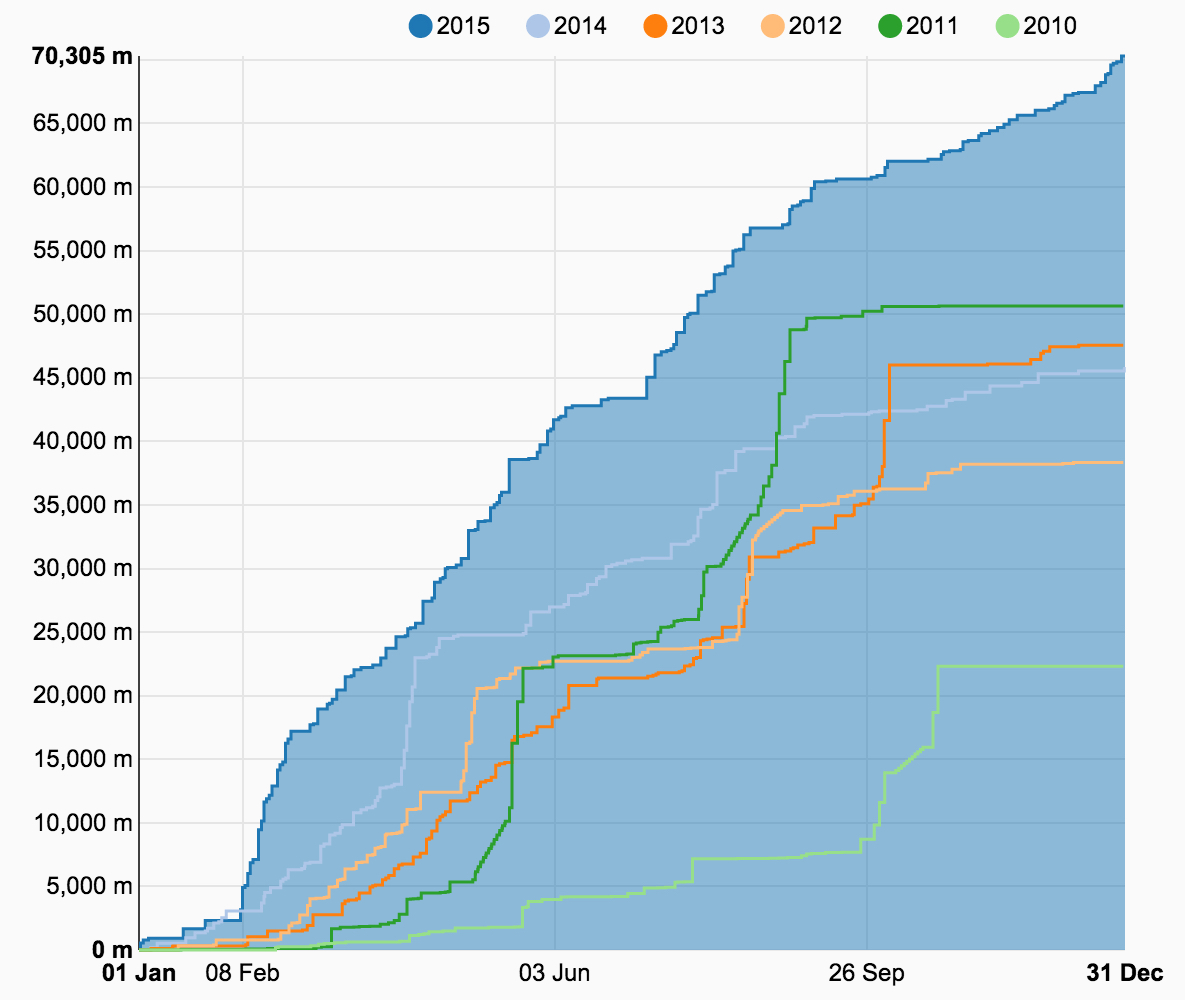
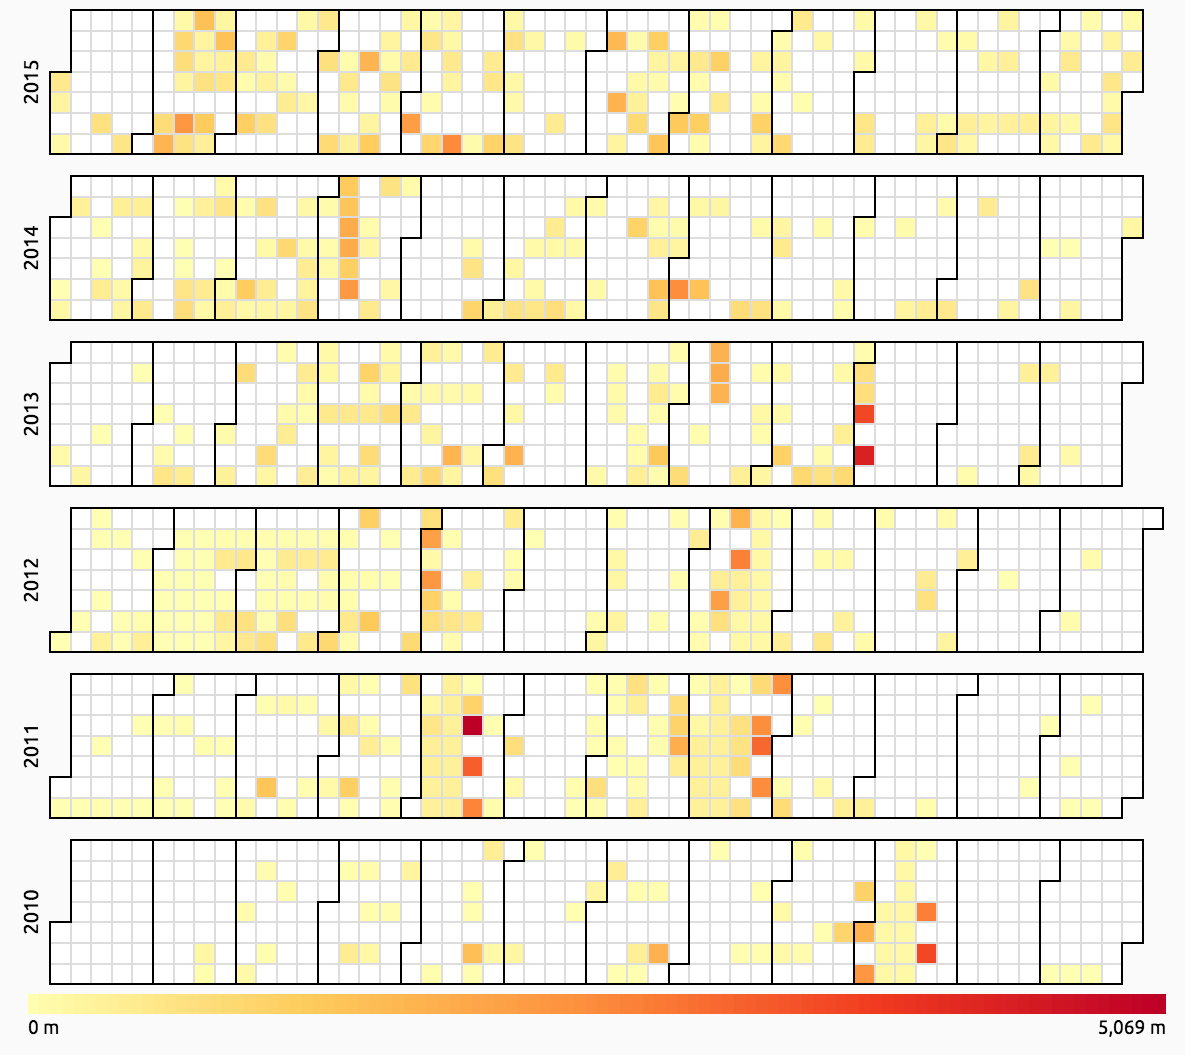
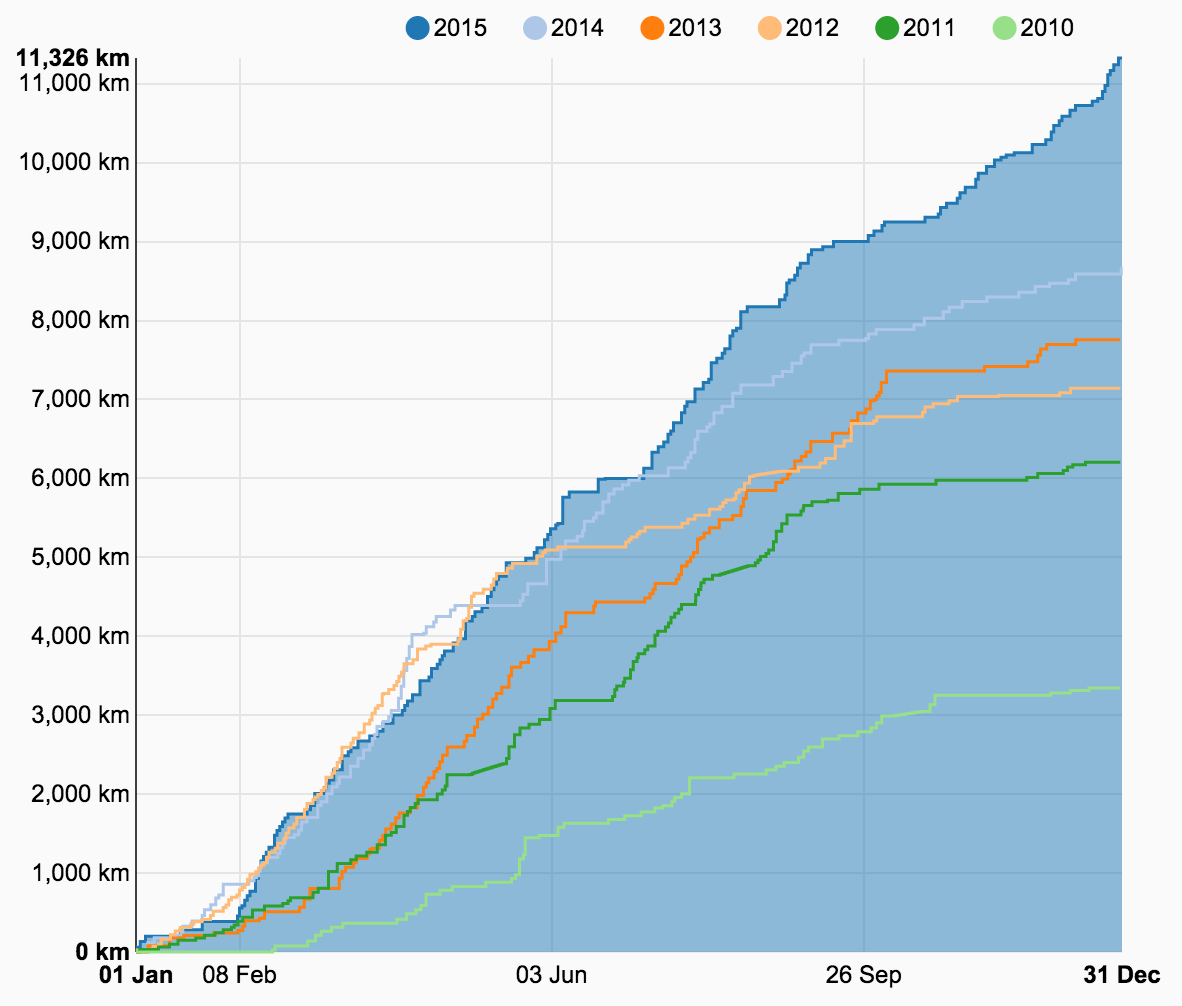
Then here are the charts of the yearly progress in terms of distance and elevation gain, followed by – in both cases – a calendar view of the same metrics. (Figures from VeloViewer.)

20151231_VeloViewer_Distance

20151231_VeloViewer_DistanceCal

20151231_VeloViewer_Elevation

20151231_VeloViewer_ElevationCal

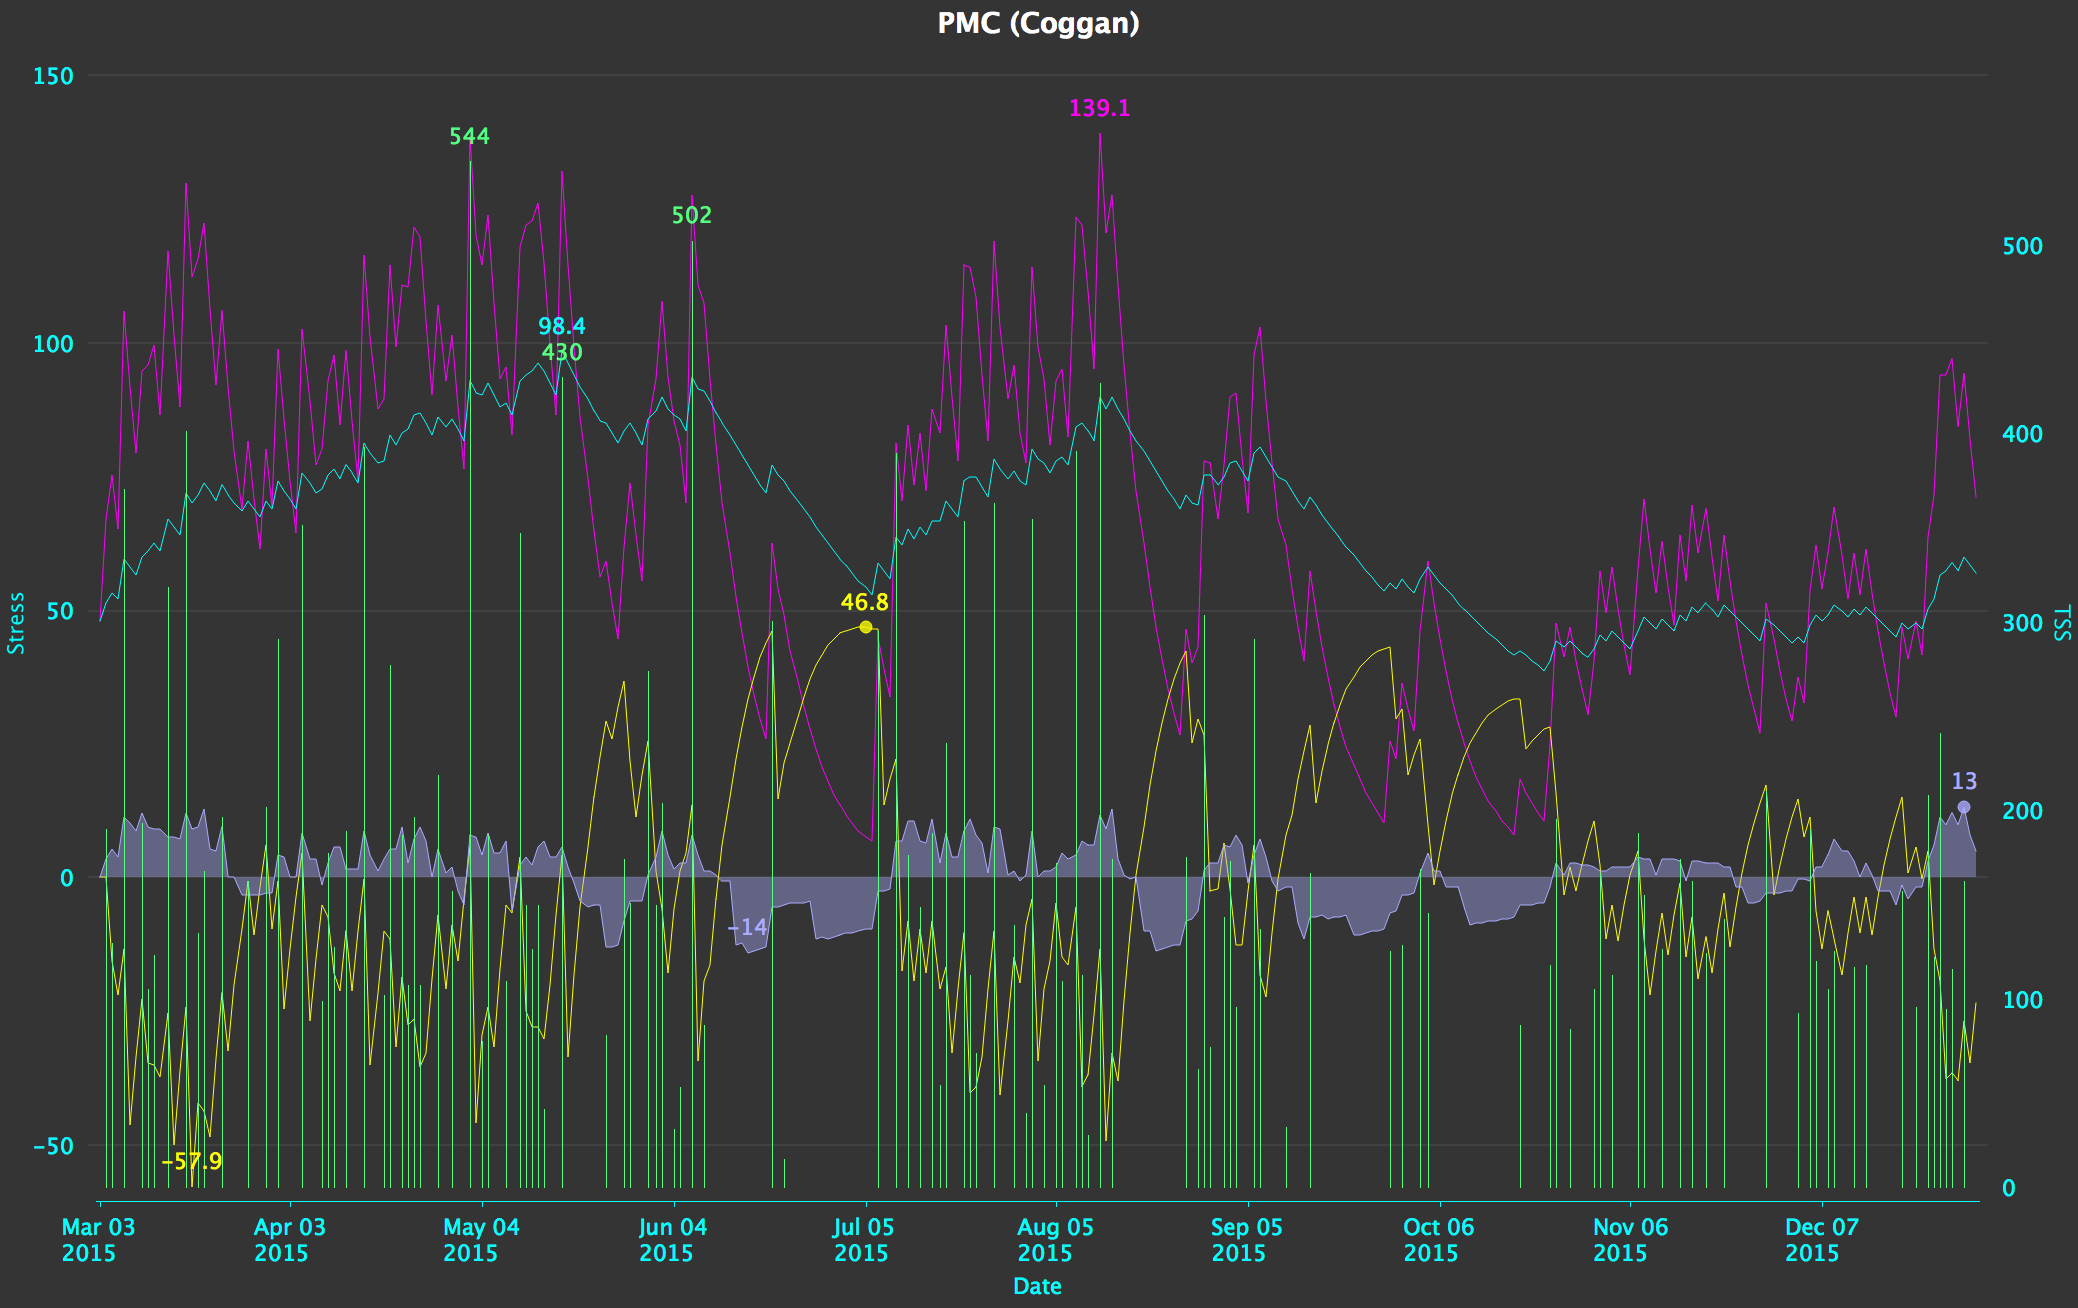
Then here is a figure from Golden Cheetah showing my Performance Management Chart since I have a power meter.

20151231_PMC

Then here I my statistics grouped by the 4 bikes I have ridden this year.

20151231_VeloViewer_Bikes

Concerning the social aspects, as I have already mentioned, this year I did many more solo rides compared to 2014. Out of the 140 activities, only 29 were not solo rides, and out of these only 19 were rides where I was riding with more than one person. When I was not alone I rode most often with Willem, on a total of 24 rides (a sum of 79 hours).

I did not want to put it on the list of memorable events, but this year I started using Rapha products. They are on the more expensive side, but the quality and the service is so good, the bibs are so comfortable, and the design is so clean and stylish, that it is totally worth it. I even tested their free repair service and it has exceeded my expectations (big time). So, if anyone needs a present idea for me, Rapha vouchers are always highly appreciated ;)

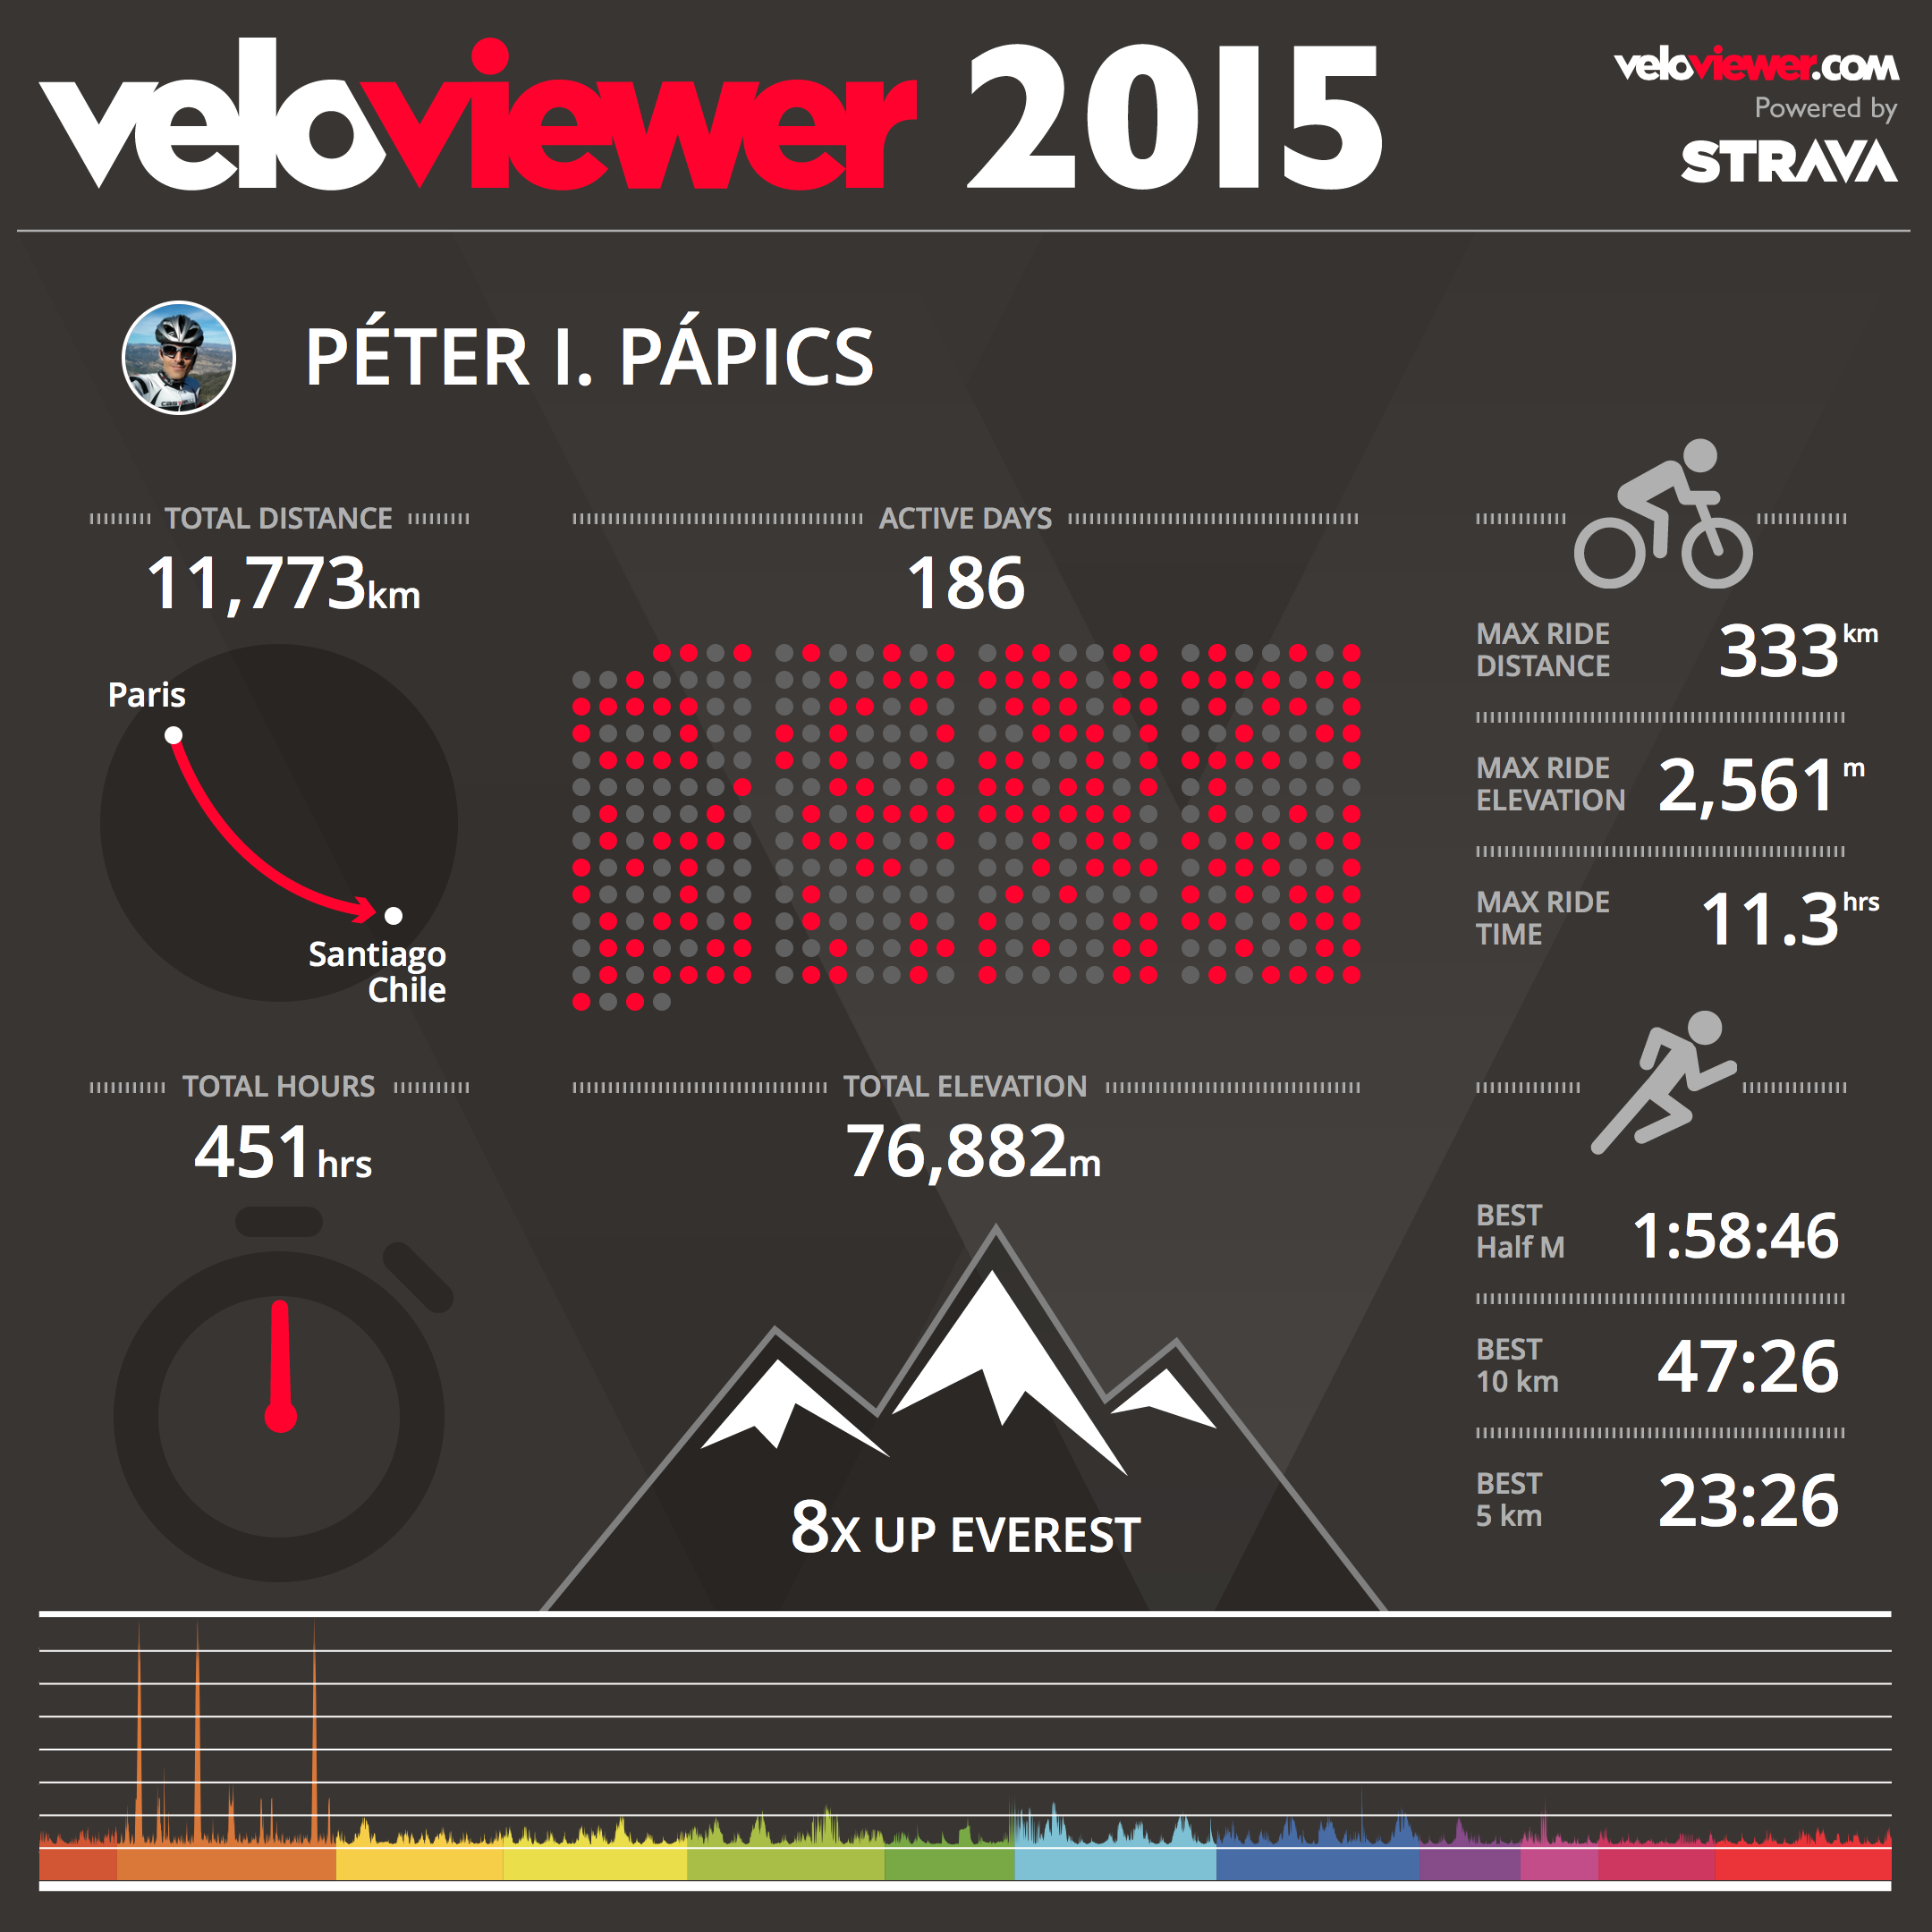
I have also ran 401 km this year (with quite some trail running on La Palma), and did some hiking with Clio, so at the end I had a total activity time of 451 hours (up from 350 hours in 2014). I am fully satisfied with that, and I am happy with all the achievements (see list of Strava challenges completed below) along the way.

20151231_VeloViewer_summary

20151231_StravaChallenges

I always wanted to have one year when I bike more than 10000 km, so now that I have achieved that, my goal for 2016 is more about quality, and not about quantity. I hope that in 2016 I will have even more self-supported epic rides, some good structured trainings, and maybe even a few races. The most important goal is to have fun on the bike :)

The year (2014) in sports

2014 was a great year, not only because of the nice holidays we had (which I still need to blog about…), or the papers I published, but also because I did more sports than any year before (a total of 350 hours of cycling, running, and a tiny bit of hiking). Before jumping into numbers and figures, let me review the main events.

Cycling: First of all, I bought a mountain bike – which was even stolen and found once since then (thanks again to the police and the people who spotted the suspicious activity) -, but so far I have not ridden it as much as I planned to (only 261 km in 7 rides). But it is very nice to ride through the forest with it, so I am happy with the purchase in any case.

2014_cycling_me

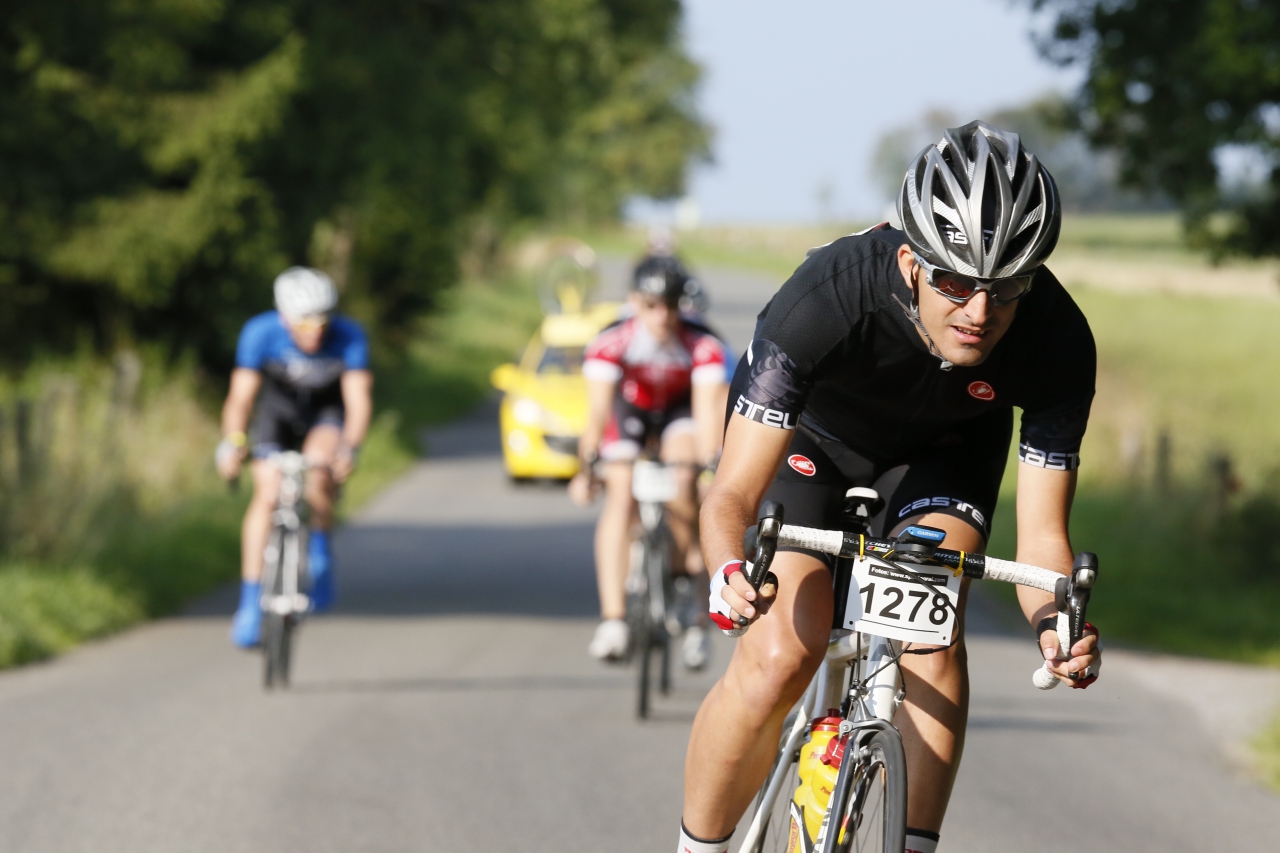
On the road bike, I had my longest ride ever (both distance and duration wise with 313 km in 10h 34m, see it on Strava for more), riding from home to the Belgian coast and back with several members of WTCOOL. Luckily, the route was totally flat… It was a great day, and we even had energy for a sprint along the channel around the 300 km mark. Crazy times :) I also had my heaviest week on the bike thanks to the holidays (a.k.a. training camp) on Mallorca with 962 kilometres, 9939 meters of elevation gain, and 34h 52m in the saddle, which meant that at the end of the week I was in the top 10 of Belgian Strava users! This of course made April my best month ever too (1532 km, 11371 m+, 53h 53m). Later through the year I participated in the 24 hours of Zolder (138 kilometres with a nearly 40 km/h average speed) and had a few nice organised rides in the Ardennes too (e.g., see picture above), with great company. All in all, this year saw me transforming from a lonely cyclist to a social cyclist. I still do solo rides, but it happens more and more often that I have someone else to ride with even at random times.

And then for the raw numbers:

Total distance: 8663 km
Total elevation gain: 45737 m
Total time: 301h 15m
Activity count: 108
Average speed: 28.8 km/h
Average heart rate: 152.5 bpm (max: 195 bpm)
Average cadence: 91 rpm

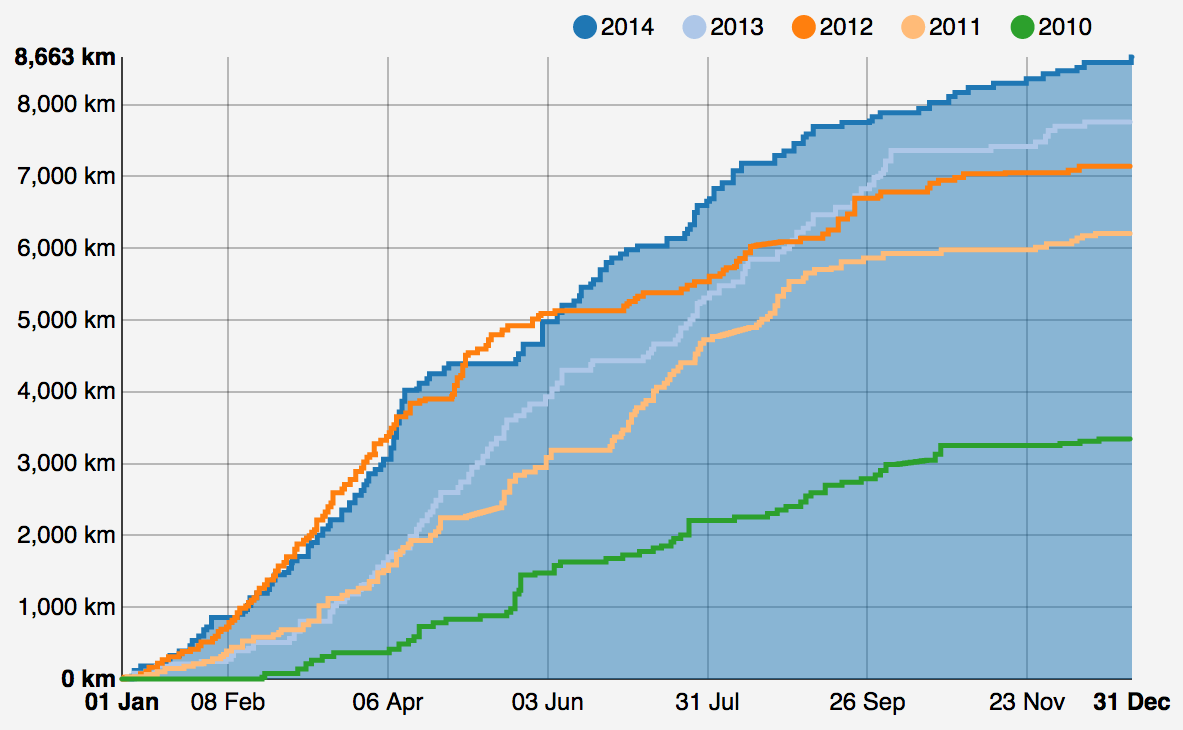
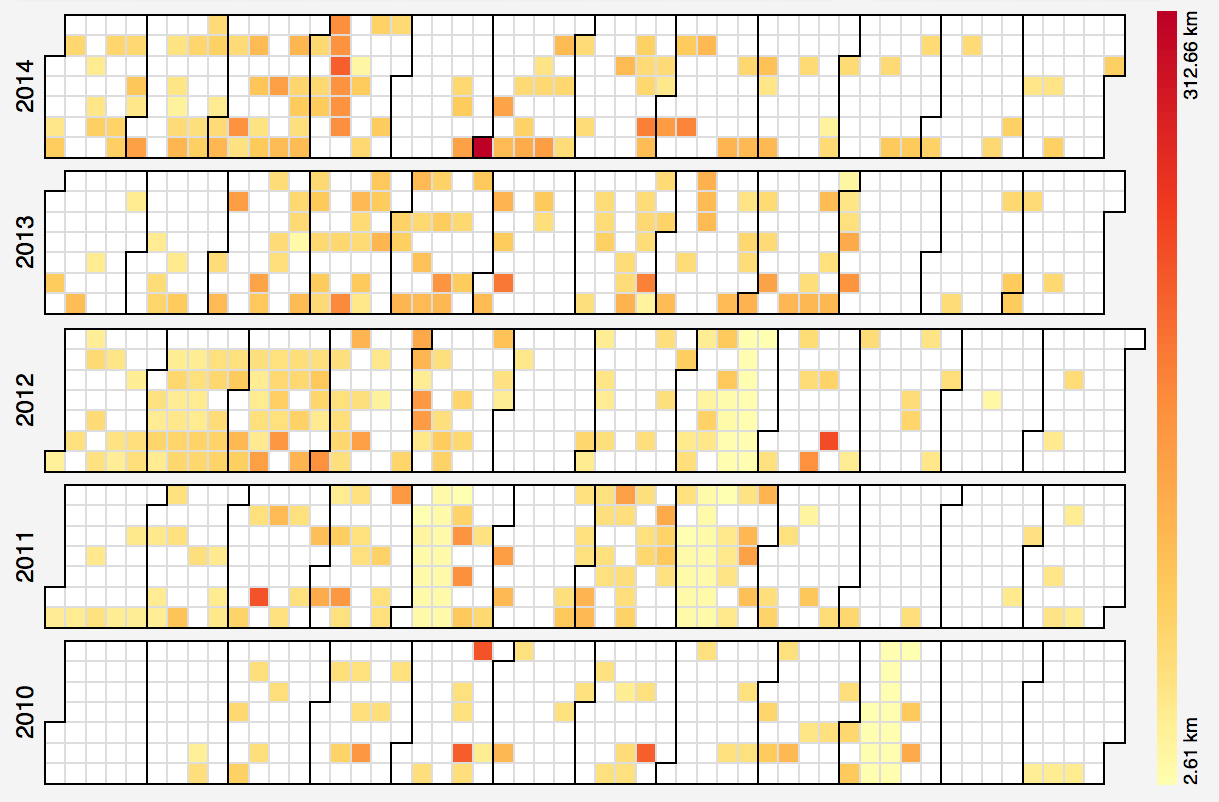
Here is a distribution of biking activities through the past years:

2014_cycling_curves

2014_cycling_distribution

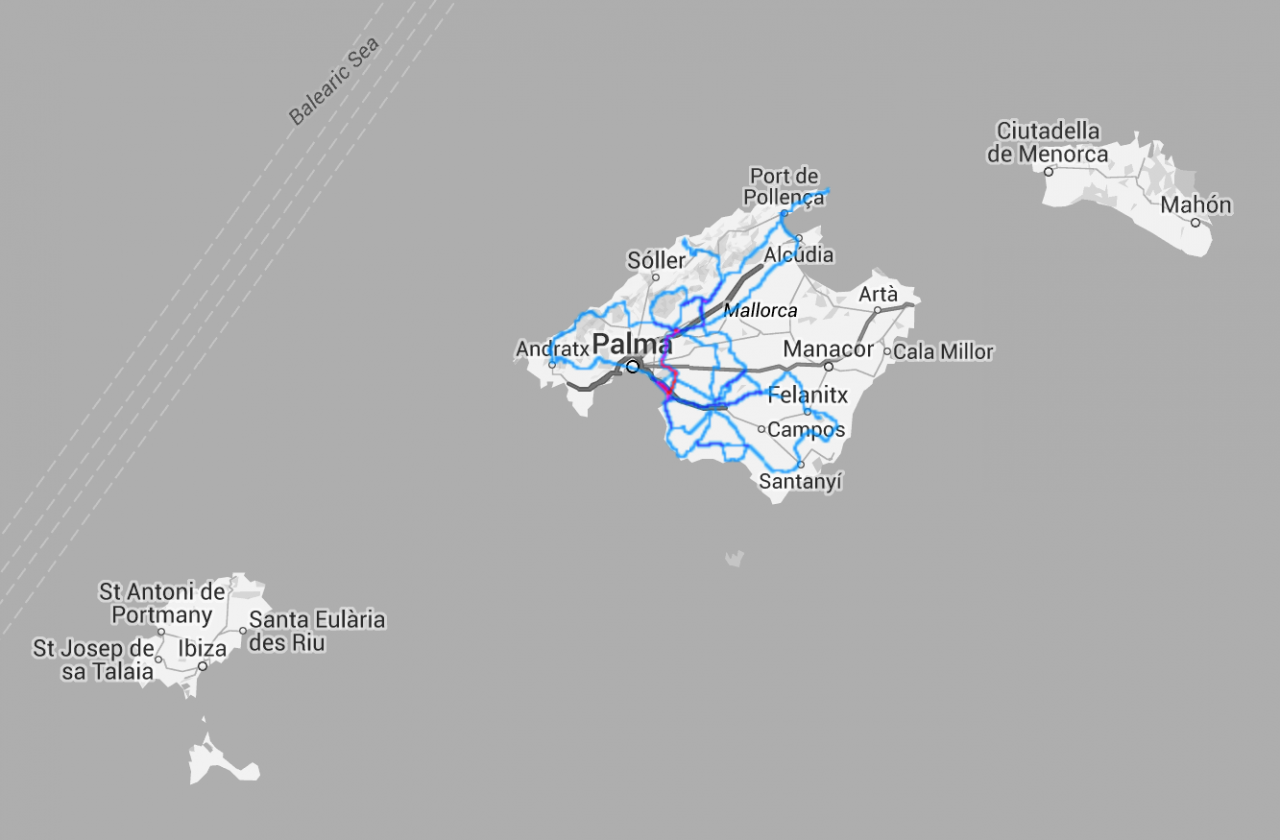
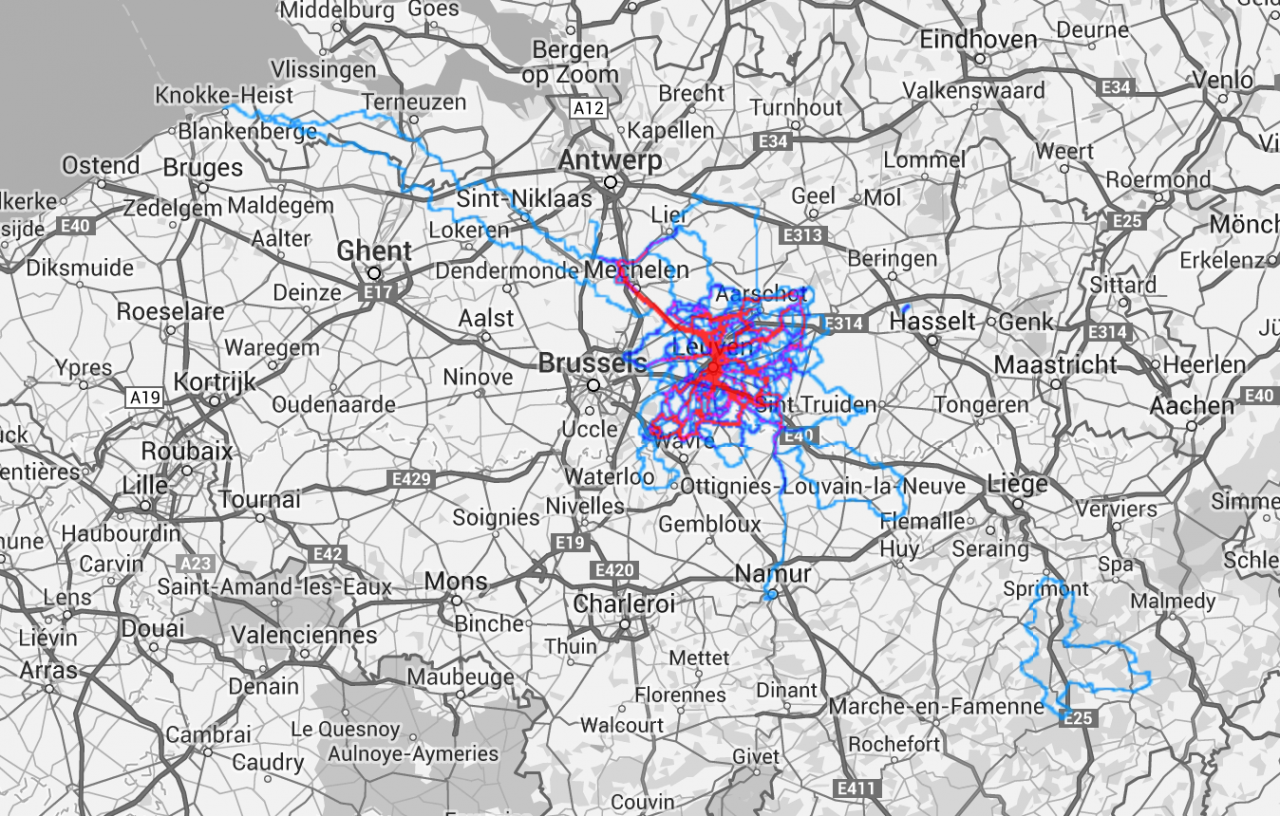
Of course the speed is pulled down a little by the mountain bike rides, but I am not making a full table for all activities here. Also it is clear that leading up to Mallorca I did a lot of training, then took it easier afterwards, and there is a big gap visible in May, since while I was observing in Chile, I did not do any sports… Looking at the geographical distribution, besides Belgium I also biked in Spain (Mallorca), and for a few kilometres in Holland. Here are the covered roads (zoomable version on Strava):

2014_cycling_map1

2014_cycling_map2

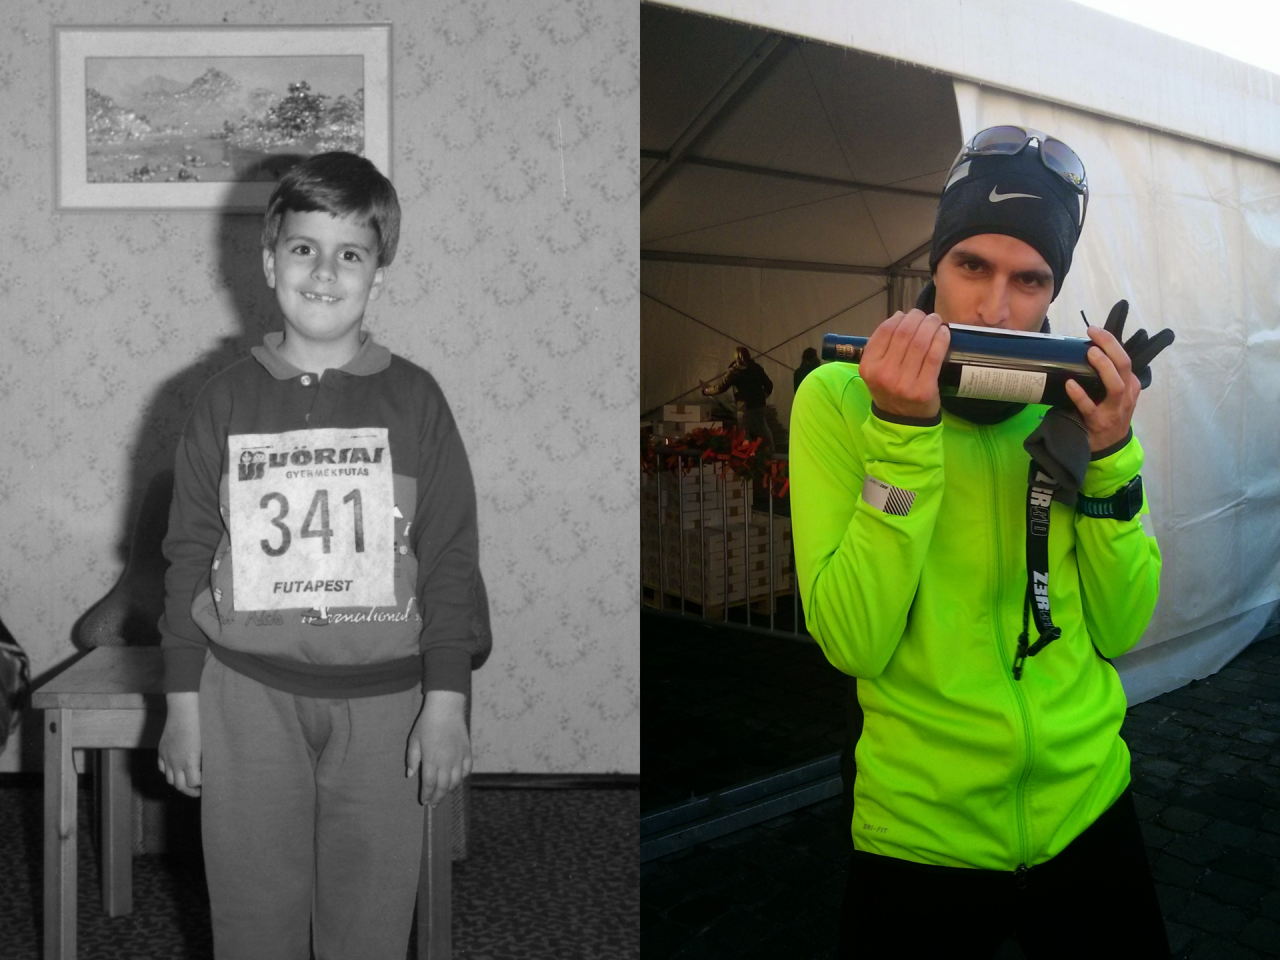
Running: This is the first time I am writing about running beyond simply mentioning it (if I remember correctly), but by now I can not avoid admitting it, that I am getting more and more fond of it. I never really liked running, and before I picked it up as cross training for the winter at the beginning of 2013, I actually literally hated it. I have never had trouble running after the ball (I played handball for three years during high school, than a few years of floorball during my University studies and the beginning of my PhD), but running just for the running itself was really never my thing. I remember participating in an organised run (probably 2 kilometers or even less) around the age 6 (and I guess that was my parents’ idea), but that was it. I always hated the yearly two Cooper tests (running for 12 minutes) in school, and in general, I never understood how can anyone enjoy this…

Then, as already many times with other physical activities before (long distance hiking, cycling), technology had a big part in making up my mind. (I just need a gadget, and then everything is all right.) During the last days of 2012 I decided, that I need something to do when the weather is just too miserable and/or it is too dark to go for a safe training ride. I needed something I can still keep track of (preferably on Garmin Connect/Strava), so I pretty much ‘decided’ I would like running from then on (or that at least I would do it for the training, even if it sucks – at least it takes less time and preparation for a similar effect than cycling). I bought a running GPS (Garmin Forerunner 210), some running shoes (Nike Zoom Structure+ 16), and then I started running. I started easy, following an online training plan, building up from 5k runs (short for 5 km runs, but runners fancy the short version for some reason) towards 14k, which I managed already after a little bit more than two months. Of course I had a generally very good physical condition because of the cycling, but normally an unexperienced runner should not raise the distance so fast, because it will lead to an almost certain injury. I still did not like running that much, but it was nice to be able to do some sports even in the snow (and that winter was snowy until very late). Then as soon as the snow melted, I also pretty much stopped, except for a run here and there (Sydney, Rhodes) on conferences. I did the same during the first two months of 2014, runs between 5 and 12 kilometers (also during holidays and work in Grenoble and Geneva), but as soon as the weather turned fine for cycling, I stopped again…

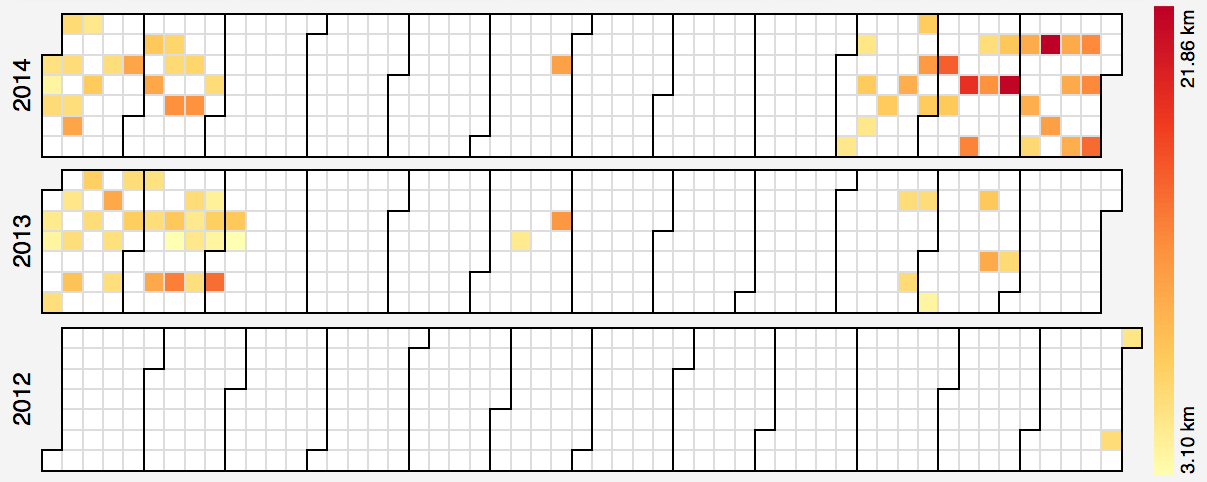
2014_running_history

I think the biggest change came this autumn, when I started running again, but this time – beyond keeping my fitness level a bit higher during the winter – with some actual goals in mind: namely, running a half marathon, and participating in the annual end of year run in Leuven. Staring from October, I was running 2-3 times a week, first on La Palma at 2300 meters, then most often at work with my colleagues, mostly through the forest, and as my body get more and more used to the running, I started actually enjoying it. Since after one point I was not constantly suffering, I got time to just enjoy being outside, a bit more like how I enjoy cycling. Running is much nicer when your mind is not too busy about dying on the spot. Of course I run for the achievements, the feeling of accomplishment, the instant nirvana which a well executed run delivers. I feel exactly as it is written/drawn in one of the great Oatmeal comics here. (Of course this stands for cycling too.) And with the fun, and a new running GPS (Garmin Forerunner 920XT), the results also came: after raising the distance week by week, I ran my first half marathon on the 27th of November through the forest with two colleagues (it took a little bit longer than two hours, since one of the others were a bit sick, and we wanted to do it together, as we did all the training together). It was a great feeling to accomplish something new. Then soon afterwards I did a solo half marathon after work into the evening with a headlamp, where I improved my time to 01:51:29 (5:17/km), which is a nice PR for the future to improve on. Then after training even during the Christmas holidays in Budapest, I participated in the first running race since that Kids Run back in the previous Millennium: I ran the 12k Eindejaarscorrida of Leuven in -4°C, and finished 597th out of the 1965 participants. Not only is this a top 1/3 finish, but I also broke all my previous best times on 1 miles, 5 kilometers, and 10 kilometers with an average pace of 4:43/km. For me, this was a really amazing result, and I was extremely happy after the finish (but during the run too). I even ran home afterwards. It was indeed a great year of sports. I hope 2015 will not disappoint either!
The raw numbers:

Total distance: 456 km
Total elevation gain: 3917 m
Total time: 41h 29m
Activity count: 49
Average pace: 5:27/km
Average heart rate: 168.9 bpm (max: 197 bpm)
Average cadence: 180 spm

PRs:

400m: 00:01:30
1/2 Mile: 00:03:27
1 km: 00:04:19
1 mile: 00:07:04
5 km: 00:23:21
10 km: 00:47:01
15 km: 01:18:14
10 mile: 01:24:15
20 km: 01:45:39
Half Marathon: 01:51:29

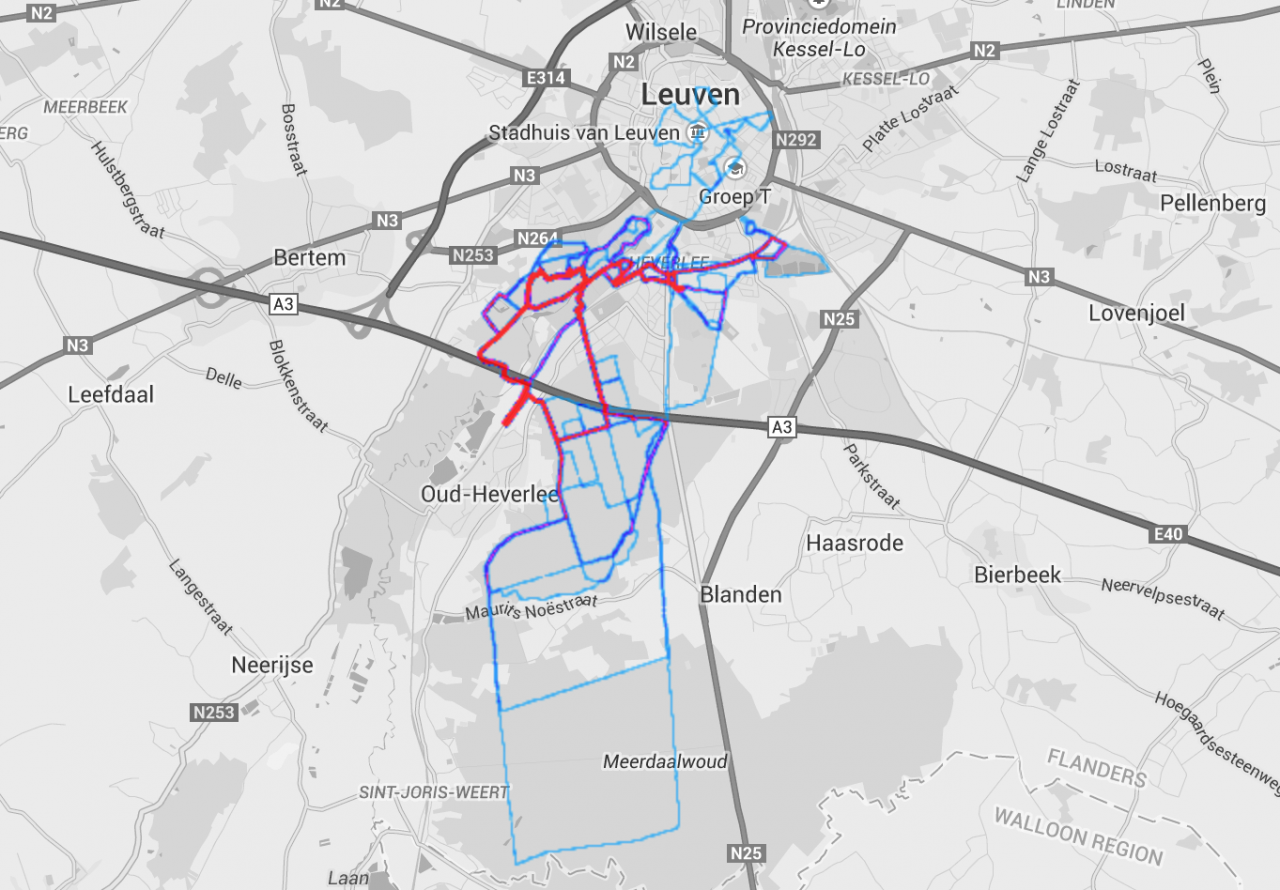
Activity distribution for the previous years, and the map for this year around Leuven (not showing runs outside Belgium, for that, click here):

2014_running_distribution

2014_running_map